DEMOGRAPHIC RESEARCH
VOLUME 32, ARTICLE 44, PAGES 1209
−
1238
PUBLISHED 3 JUNE 2015
http://www.demographic-research.org/Volumes/Vol32/44/ DOI: 10.4054/DemRes.2015.32.44
Research Article
Temporal-spatial patterns of one-person
households in China, 1982–2005
Adam Ka-Lok Cheung
Wei-Jun Jean Yeung
This publication is part of the Special Collection on “Living alone: One-person households in Asia,” organized by Guest Editors Wei-Jun Jean Yeung and Adam Ka-Lok Cheung.
© 2015 Adam Ka-Lok Cheung & Wei-Jun Jean Yeung.
This open-access work is published under the terms of the Creative Commons Attribution NonCommercial License 2.0 Germany, which permits use, reproduction & distribution in any medium for non-commercial purposes, provided the original author(s) and source are given credit.
1 Introduction 1210
2 Past literature 1211
2.1 Three sets of structural factors related to the increase in living alone 1212 2.2 Limitations of previous studies 1213 3 Chinese context and hypotheses 1215
3.1 The Chinese context 1215
3.2 Hypotheses of the current study 1216
4 Methods 1217
4.1 Data 1217
4.2 Measures for the prefecture-data analysis 1218
4.3 Analytic strategy 1219
5 Results 1219
5.1 Temporal and Spatial Distribution 1219 5.2 Two-way fixed-effect regression models (Prefecture-level) 1228 6 Discussion and conclusion 1230
7 Acknowledgements 1233
Temporal-spatial patterns of one-person households in China,
1982
−
2005
Adam Ka-Lok Cheung1
Wei-Jun Jean Yeung2
Abstract
BACKGROUND
The number of one-person households (OPH) in China has risen over the past few decades, but there are few examinations of the patterns and trends in this rapidly growing family type. The changing composition and regional heterogeneity of Chinese OPH have important implications for family and individual well-being, and for the country’s resource allocation.
OBJECTIVE
We examine the temporal-spatial patterns of OPH in China between 1982 and 2005, and address three research questions: 1) To what extent have the prevalence and composition of OPH changed? 2) How have the geographical distributions of OPH in China changed? 3) What are the local demographic and socioeconomic contexts related to the changes in OPH?
METHODS
We analyse data from the 1% sample of the 1982 and 1990 censuses, and a sample of the inter-censual 1% Population Sample Survey in 2005. Descriptive analysis at the provincial level presents the trends of the changing distribution and composition of OPH. Fixed-effect models at the prefecture-level examine how three sets of factors (i.e., demographic trends, socioeconomic development and internal migration) are related to the changing prevalence of OPH over time.
RESULTS
OPH have become increasingly heterogeneous. They are, particularly for the non-widowed who live alone, increasingly clustered in developed areas. Results show that industrialisation and internal migration largely explain the changing spatial variation
1
Department of Social Sciences, the Hong Kong Institute of Education, D3-1F-58, the Hong Kong Institute of Education, 10 Lo Ping Road, Tai Po, N.T., Hong Kong. E-Mail: [email protected].
2
of OPH. Lengthened life expectancy and a decline in fertility help to explain the increase in widowed OPH, while industrialisation and migration are associated with the rise of non-widowed OPH.
1. Introduction
For the past three decades, there has been a decline in household size and an increase in one-person households in China (Guo 2008, 2012; Zhao and Chen 2008). Official figures provided by the National Bureau of Statistics of China show that the proportion of one-person households increased from 4.9% in 1990, to 14.5% in 2010 (see Figure 1). The total population living in one-person households tripled from approximately 17 million in 1982, to approximately 58 million in 2010 (National Bureau of Statistics of China 2013). In 2010, the number of one-person households in China had already exceeded those of the United States (31.2 million), France (9.2 million) and the United Kingdom (8.1 million) put together.
Figure 1: Trend of the number and percentage of one-person households in
China, 1982–2010
Sources: China Statistical Yearbooks and Census Reports
0 .02 .04 .06 .08 .1 .12 .14 .16 % of O ne-per s on H ous ehol ds i n A ll F am il y H ous ehol ds 0 1000 2000 3000 4000 5000 6000 P opul at ion Li v ing in O ne-per s on H ous ehol ds (i n 10, 000 per s ons )
1982 1990 1995 2000 2005 2010
Year
Population % of Households
Previous studies have examined the trends and the driving forces behind the increase of one-person households in developed societies, particularly in Western contexts (Kobrin 1976; Kramarow 1995; Michael, Fuchs, and Scott 1980), but the factors that drive the recent increases in one-person households in Asian countries, where demographic and socioeconomic contexts are distinct from the West, have received little attention in the literature. In the Asian context, this reflects significant changes in institutional setups and in societal values and norms. The rise of one-person households has long-lasting implications for the well-being of individuals, and for a society’s consumption and resource allocation. Despite previous examinations of household structure in China (Guo 2008, 2012; Wang 2008; Zhao and Chen 2008) we know relatively little about how closely the dramatic demographic and socioeconomic transformations in China over the past three decades are related to this increase. In particular, there have been no studies that examine the regional differences in one-person households, or how the geographical distribution of one-person households has changed over time, even though regional economic inequality has been widely studied.
This study examines the temporal-spatial pattern of one-person households in China. We address three related research questions: 1) To what extent have the prevalence and composition of one-person households changed in the last three decades? 2) How has the geographical distribution of one-person households in China changed during this period? 3) What local demographic and socioeconomic contexts are related to distribution and changes in the prevalence and composition of OPH? To address these questions, we draw data from a 1% sample of the 1982 and 1990 Census micro-data, and a random sample of the inter-census 1% Population Sample Survey of 2005.
We find that the level of one-person households in China has grown at a faster rate in economically developed areas. Demographic factors (e.g., population aging), and economic development (e.g., change of occupational structure) are related to the increase. Population aging has led to the rise of all types of one-person householders − single, married, divorced and widowed − whereas non-agricultural occupational structure has played a significant role only in the increase of non-widowed one-person householders. The rapid increase in internal migration, due to uneven economic development, has also affected the increasing regional differences in the numbers and types of one-person households over time.
2. Past literature
studies have examined trends and reasons for the increase in a Western context (Hall, Ogden, and Hill 1997; Jamieson and Simpson 2013; Klinenberg 2012; Kramarow 1995; Ogden and Hall 2004; Ogden and Schnoebelen 2005; Stone, Berrington, and Falkingham 2011). Demographic transition and recent socioeconomic development have been identified as major causes in many developed countries. The literature has identified three main sets of factors related to the rise of one-person households – demographic changes, socioeconomic development and internal migration. We discuss these factors below.
2.1 Three sets of structural factors related to the increase in living alone
Demographic change is a significant factor leading to the increase of one-person households in Western countries. As family households constitute the majority of household types in most societies, the size of the family and kinship has an important influence on the tendency to live alone. Previous studies show that demographic changes, such as a decline in the rates of marriage and fertility and an increase in divorce rates, are related to changes in household structure (Ogden and Hall 2004). These changes directly affect the reduction of household size in Western countries (Kobrin 1976; Ogden and Schnoebelen 2005). Conjugal families have become more common in many modern societies, while living with extended families and multi-generation households are less common (Cherlin 2012). A cross-national comparative study by Fu and Heaton (1995) found that high rates of fertility and marriage are positively and directly correlated with household size. With a declining marriage rate, more adults remain single for a significant period of time and opt for solo living (Klinenberg 2012; Stone, Berrington, and Falkingham 2011; Vitali 2010). Those who have no children or are divorced or widowed also have a greater propensity to live alone, if they do not move back to live with their parents. While studies show that a significant proportion of one-person households are the widowed or divorced elderly (Bengtson and Putney 2000; Chevan and Korson 1972; Golini and Silverstrini 2013), an increase in single young adults who live alone in urban areas has also been observed (Jamieson and Simpson 2013; Ogden and Hall 2004).
that socioeconomic development, as measured by indicators such as GDP per capita, the share of agriculture in GDP, and school enrolment rate, has a strong negative correlation with household size, controlling for demographic factors such as marriage and fertility rates (Fu and Heaton 1995; Lopreato and Yu 1988). Klinenberg (2012) suggests that socioeconomic development and urbanisation provide the fundamental structural and cultural conditions for solo living. In an agricultural economy, where family is still largely a production and welfare unit, people benefit from sharing labour, and may not be able to live independently. As an economy develops, greater division of labour and more wage workers translate into a greater need, and perhaps the desire, for people to live alone. Studies show that highly educated, professional adults are more likely to live alone, as they embrace individualistic values and have a stronger preference for privacy (Stone, Berrington, and Falkingham 2011; Vitali 2010). Scholars suggest that, in recent times, more elderly people live independently; not because they have fewer children to depend on (due to declining fertility), but because they do not need to depend on their children (Bongaarts and Zimmer 2002; Gratton and Gutmann 2010; McGarry and Schoeni 2000).
Finally, geographical mobility is another partial explanation for the recent increase in one-person households, as this often leads to family separation (Jamieson and Simpson 2013). Immigrants and internal migrants are more likely to live apart from their family and live alone (Goldstein, Guo, and Goldstein 1997; Stone, Berrington, and Falkingham 2011). For example, Vitali (2010) argues that local economic performance leads young adults to migrate within Spain, therefore affecting their living arrangements. An early study in the US found a positive correlation between internal migration and the percentages of single and widowed one-person households across 50 states (Michael, Fuchs, and Scott 1980). More recently, Zhao and Chen (2008), also found that a high proportion (41%) of migrants in Beijing were living alone (Zhao and Chen 2008), based on survey data collected in Beijing in 2006, a much higher percentage than the national average.
2.2 Limitations of previous studies
Spatial variation in the increasing trend in one-person households
Previous studies show that the propensity to live alone varies across regions within developed countries (Vitali 2010). There is generally a greater concentration of one-person households in urban and economically developed regions than in rural and less-developed regions (Bongaarts and Zimmer 2002; Hall, Ogden, and Hill 1997; Ogden and Hall 2004; Ogden and Schnoebelen 2005). For example, the City of London (a central area of London) has the highest percentage of one-person households in the United Kingdom, at 56.4% (Office for National Statistics 2014). Similarly, more than half of the households in the City of Paris are one-person households (Ogden and Hall 2004; Ogden and Schnoebelen 2005). We as yet know very little about how demographic changes, socioeconomic development and increases in internal migration are related to the changing geographic distribution of one-person households over time. Our study addresses this issue by examining the changes in the provincial- and prefectural-level percentages of one-person households and their regional heterogeneity in China over time.
Lack of multivariate analysis in explaining the patterns
Few previous studies have examined the trend of one-person households with statistical analysis, beyond cross-tabulations or simple regressions (e.g., Kramarow 1995; Vitali 2010). Studies in the US show that neither population aging nor declining marriage or fertility affect household size and composition as much as economic development (Gratton and Gutmann 2010; McGarry and Schoeni 2000). It is important to distinguish the effects of different factors on the changing prevalence of one-person households to enable us to better understand the phenomenon. This study simultaneously estimates the correlation of all three sets of factors with the prevalence of one-person households, to separate the net effect for each set of factors.
One-person households as a heterogeneous population
indicators were related to the growth of single but not widowed one-person households in the 1970s in the US. This level of detail provides important information, but to date there have been few efforts to differentiate and explain the pattern of different types of one-person households in China. We examine four sub-types of one-person households categorised by the households’ marital status (never married, married, divorced and widowed) and how each group relates to the three sets of factors.
3. Chinese context and hypotheses
3.1 The Chinese context
Since the economic reform of the late 1970s, China has implemented a coastal-bias economic policy, for example, by providing greater expenditure and favourable tax breaks in coastal provinces (Démurger et al. 2002). The reform generated rapid but uneven modernisation and urbanisation. A time-series analysis conducted by Kanbur and Zhang (2005) shows that since the reform, rural-urban and inland-coastal economic inequalities have increased sharply. The growth rates of GDP per capita in coastal provinces are significantly higher than those of inland provinces (Démurger et al. 2002). Between 1979 and 1998, for example, coastal provinces enjoyed average annual growth rates of around 10% GDP per capita, while some inland provinces registered only about 5% (Démurger et al. 2002).
average household sizes in economically developed than less developed provinces. The average household sizes in less economically developed provinces such as Tibet, Hainan and Qinghai were 4.07, 3.64 and 3.40 in 2011, respectively − much higher than those in Shanghai (2.35), Beijing (2.53) and Zhejiang (2.68) (National Bureau of Statistics 2013).
In addition, the growing economic disparities between rural and urban areas and among provinces have led to a large number of labour migrants without local “hukou”
registration (government record of household and residence status) leaving home since the 1980s, leaving their family members behind (Liang and White 1997). Similar to economic growth and demographic changes, these migrants are disproportionately distributed between coastal and inland areas. Coastal areas contain a higher proportion of migrants, and Liang and Ma (2004) show that this disparity is increasing. In 1990, the five provinces with the largest collective proportion of the migrant population (the mainly coastal provinces of Guangdong, Jiangsu, Heilongjiang, Sichuan and Hubei) housed only 37.09%, but by 2000, those with the largest proportion (Guangdong, Zhejiang, Fujian, Jiangsu and Shanghai) had housed 50.35% in total (Liang and Ma 2004). Migrants typically have relatively low pay and low job security, forcing them to move from place to place in search of jobs. Without local hukou, their children are often not eligible to enrol in local public schools. Most, therefore, leave their family behind in their place of origin, or work in a separate location from their spouses. This has implications for the prevalence of one-person households in the provinces that send and receive migrants.
3.2 Hypotheses of the current study
From the above discussion regarding the Chinese context, we formulate the following hypotheses concerning the increase in one-person households in China.
Hypothesis 1a: The proportion of elderly people is positively correlated with the percentage of one-person households.
Hypothesis 1b: The proportion of single young adults is positively correlated with the percentage of one-person households.
Hypothesis 1c: The proportion of children is negatively correlated with the percentage of one-person households.
Hypothesis 2a: Non-agricultural occupational structure is positively correlated with the percentage of one-person households.
Hypothesis 2b: Education level is positively correlated with the percentage of one-person households.
In particular, socioeconomic development is more strongly related to the rise of non-widowed one-person households.
Hypothesis 3: The proportion of the floating population is positively correlated with the rise of one-person households.
In particular, we expect the proportion of the floating population to be more strongly related to the proportion of single/married one-person households.
4. Methods
4.1 Data
prefecture in a given year.3 Data on respondents’ marital status from Tibet in 1982 have many missing values, so the prefecture-year observations are dropped in the multivariate analysis.
4.2 Measures for the prefecture-data analysis
Dependent variables
Prefecture-level prevalence of living alone. The percentages of one-person households at the prefecture-level are the main dependent variables. One-person households encompass several subgroups, so we use five dependent variables to understand the patterns of these different types of OPH: 1) the overall percentage of one-person households in the prefecture-level population (hereafter OPH); 2) the percentage of unmarried one-person households in the prefecture-level population (hereafter Single-OPH4); 3) the percentage of married one-person households in the prefecture-level population (hereafter
Married-OPH); 4) the percentage of divorced one-person households in the
prefecture-level population (hereafter Divorced-OPH); 5) the percentage of widowed one-person households in the prefecture-level population (hereafter Widowed-OPH). The sum of the prevalence rates of the four OPH subgroups equals the overall prevalence rate of OPH in the prefecture-level population.
Independent variables
Independent variables in the multivariate analysis include both demographic and socioeconomic measures of the prefectures.5 The distributions of the independent variables are reported in Appendix 1:
Demographic variables: percentage of children in the population (i.e., the share of residents aged below 16 divided by the prefecture population), percentage of elderly (i.e., the number of residents aged above 64 divided by the prefecture population), percentage of singles among those aged 25 to 35 (the number of unmarried residents aged between
3 In China, the boundaries of some prefectures and provinces changed between 1982 and 2005. For example,
Chongqing was not a provincial-level city in 1982. For this reason, we used the harmonized geographical identifier provided by the National Bureau of Statistics of China (using the administrative boundary at Year 2000) for 1982 and 1990 data. That is, each case in the micro-data is coded with two geographical identifiers (4-digit district code at the survey year, and the district code for that location in 2000). Using the district code in 2000, the effects of changing boundaries of provinces and prefectures can be minimised.
4 Prefecture level % of single-OPH = (Total number of one-person households who were never married) ÷
(Total prefecture-population living in family households)
25 and 35 divided by the prefecture population in the same age range and living in family households).
Socioeconomic measures: percentage of high school graduates and percentage of manual labourers/service-related workers (the number of residents in the prefecture who have a non-agricultural occupation, such as factory workers and clerks, divided by the working age population in the prefecture).
Internal migration: percentage of floating population (the number of residents without local hukou registration divided by the total prefecture population).
In general, the data show that socioeconomic variables and internal migration have larger variance across time and space than demographic variables.
4.3 Analytic strategy
We start by describing the geographical pattern of one-person households and its change over time at the provincial level (i.e., the unit of analysis is province-year observations). For a more detailed analysis, we move to prefecture-level data for multivariate analysis (i.e., the unit of analysis is prefecture-year observations). A series of two-way fixed effect regression models are estimated to examine the association between the changing prevalence of various types of one-person households and the three main sets of independent variables.
5. Results
5.1 Temporal and Spatial Distribution
Provincial/Municipality-level percentages of population living in one-person households
Table 1 shows that the subgroup percentages of those living in OPH increased for almost all subgroups. However, the rates of increase in living alone are different between different groups. There is an increase in the propensity to live alone for both males and females, but the rise for females has been more rapid. By 2005, the prevalence rate was similar, at 3.9% and 3.3% for male and females, respectively. The prevalence of living alone for the young population (e.g., the percentage-point change for children under 15=1.32) increased more sharply than for the elderly group (i.e., percentage-point change for elderly aged 65 or above=−1.48), although the prevalence rate of living alone for the young population is still significantly lower than for the elderly. The increasing incidence of widowhood at old age means that the prevalence for the over-65 age group has always been the highest of all age groups, although this has decreased over the past three decades, to approximately 11% in 2005. However, despite the lower prevalence rate, it should be noted that the total number of elderly people living in OPH has increased, due to the aging population. Over time, the likelihood of living alone increased at a similar rate for those with both low and high educational achievements.
Table 1: Changing prevalence rates of living in OPH by demographic
characteristics, 1982–2005
1982 (%) 1990 (%) 2005 (%) Percentage-point change between 1982 and 2005
Gender
Male 2.28 1.99 3.90 1.62 Female 1.33 1.23 3.25 1.92
Age
0−14 0.08 0.07 1.40 1.32 15−24 0.77 0.59 2.81 2.04 25−34 1.78 1.24 2.68 0.90 35−44 2.12 1.36 2.63 0.51 45−54 2.45 2.17 3.95 1.50 55−64 4.80 3.68 5.31 0.51 65+ 12.42 9.42 10.94 -1.48
Education
Primary or below 2.20 2.10 4.63 2.43 Junior middle 1.39 1.12 2.57 1.18 Senior middle or above 2.08 2.08 4.23 2.15
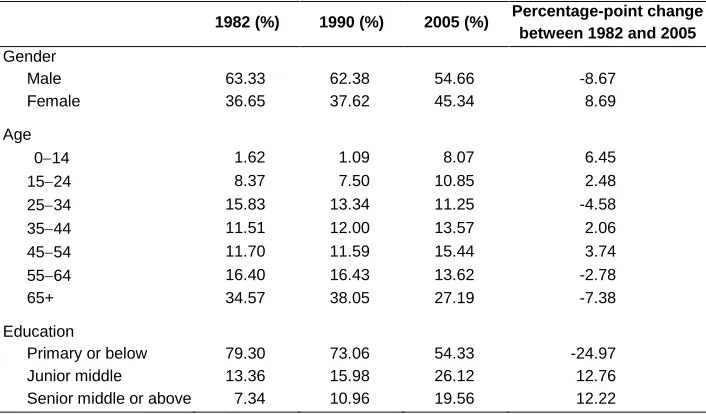
Table 2 shows that males account for a larger proportion of those who lived in one-person households in China throughout the period, but the relative proportion of females increased significantly over time, from 37% to 45% of the total OPH population. In terms of age groups, the elderly has always been the largest group, accounting for more than a third of those living in OPH, but this proportion has decreased over time, partly due to the relative increase in children and adults who live alone. By 2005, those aged 65 or over accounted for 27% of the total OPH population. In terms of socioeconomic status, in 1982, about 80% of those who lived in OPH had an education attainment of primary school or below. By 2005, this proportion has declined to about one half, with those having high school education or above accounting for one in five of the total OPH population. These patterns largely reflect the educational expansion in China during this period.
Table 2: Demographic profile of those living alone in China, 1982–2005
1982 (%) 1990 (%) 2005 (%) Percentage-point change between 1982 and 2005
Gender
Male 63.33 62.38 54.66 -8.67 Female 36.65 37.62 45.34 8.69
Age
0−14 1.62 1.09 8.07 6.45 15−24 8.37 7.50 10.85 2.48 25−34 15.83 13.34 11.25 -4.58 35−44 11.51 12.00 13.57 2.06 45−54 11.70 11.59 15.44 3.74 55−64 16.40 16.43 13.62 -2.78 65+ 34.57 38.05 27.19 -7.38
Education
Primary or below 79.30 73.06 54.33 -24.97 Junior middle 13.36 15.98 26.12 12.76 Senior middle or above 7.34 10.96 19.56 12.22
Table 3 and Figure 2 present the changing provincial-level percentage of people who lived alone in China between 1982 and 2005, and reveal an increased regional heterogeneity over time. In general, municipalities and coastal provinces have higher percentages of people living in OPH than do inland provinces. The percentage of people living in OPH is small, but the number of individuals is large due to the size of the Chinese population overall. For cross-national comparison, we also include the percentage of OPH across all family households. While the individual-level percentage informs us of the number of people at risk, the household-level percentage shows the relative importance of OPH in terms of Chinese household composition. OPH constitutes a significant proportion of all family households in China. Table 3 shows that about 10.73% of all family households in 2005 were one-person.
The disparities between coastal and other provinces have increased over time. In 1982, the difference between the province with the highest percentage of OPH (Zhejiang: 2.98%) and that with the lowest (Gansu: 0.69%) was 2.29 percentage points. This had increased to 5.19 by 2005 (Zhejiang: 6.25%; Tibet: 1.06%). Coastal provinces showed a higher percentage of OPH and also a sharper increase over time. While the prevalence level grew faster between 1982 and 2005 in the more economically developed provinces such as Zhejiang, Fujian and Shanghai, the less-developed inland provinces experienced a slower increase or even a decline in the percentage of the population who live alone (e.g., Tibet and Shanxi). The standard deviation of the provincial-level rate also increased from 0.006 (0.6%) in 1982 to 0.014 (1.4%) in 2005. These differences are all statistically significant. The maps in Figure 2 visually present the increasing regional disparities.
Table 3: Province/Municipality-level percentage of population living in
one-person households, 1982–20051 and % OPH of all family
households2 in 2005
1982 (%) 1990 (%) 2005 (%)
Percentage-point change between 1982 and 2005
2005 (% in all family
households)
Overall (National level) 1.81 1.62 3.42 1.61 10.73
Municipality
Beijing 2.80 4.01 5.55 2.75 15.02
Tianjin 2.28 3.04 3.08 0.80 9.01
Shanghai 2.86 3.75 6.04 3.18 16.04
Chongqing 2.11 2.69 5.09 2.98 14.42
North
Hebei 2.13 1.58 2.29 0.16 7.60
Shanxi 2.50 1.85 2.26 -0.24 7.65
Inner Mongolia 1.74 1.23 2.95 1.21 8.59
Northeast
Liaoning 1.68 1.18 2.96 1.28 8.64
Jilin 1.64 0.80 1.87 0.23 5.86
Heilongjiang 1.15 0.75 2.32 1.17 6.91
East & Coastal
Jiangsu 2.81 2.00 4.24 1.43 12.34
Zhejiang 2.98 2.83 6.25 3.27 17.09
Anhui 1.70 1.52 3.88 2.18 11.73
Fujian 1.63 1.48 5.09 3.46 15.22
Jiangxi 1.45 1.07 2.92 1.47 9.61
Shandong 1.91 1.62 3.65 1.74 10.57
Guangdong 1.87 1.69 4.12 2.25 14.00
Central & South
Henan 1.36 1.25 2.30 0.94 7.88
Hubei 1.40 1.19 3.16 1.76 9.71
Hunan 2.06 1.75 3.52 1.46 11.07
Guangxi 1.29 1.38 3.31 2.02 11.18
Hainan 1.42 1.87 2.44 1.02 9.38
Southwest
Sichuan 1.92 2.10 4.80 2.88 14.13
Guizhou 1.30 1.32 2.45 1.15 8.46
Yunnan 0.92 1.05 2.23 1.31 7.99
Tibet 1.72 1.03 1.06 -0.66 5.34
Northwest
Shaanxi 1.44 1.23 2.70 1.26 8.81
Gansu 0.69 0.72 1.78 1.09 6.54
Qinghai 1.05 1.40 2.11 1.06 7.73
Ningxia 1.04 0.60 1.81 0.77 6.48
Xinjiang 2.21 1.61 2.39 0.18 8.32
Note: 1
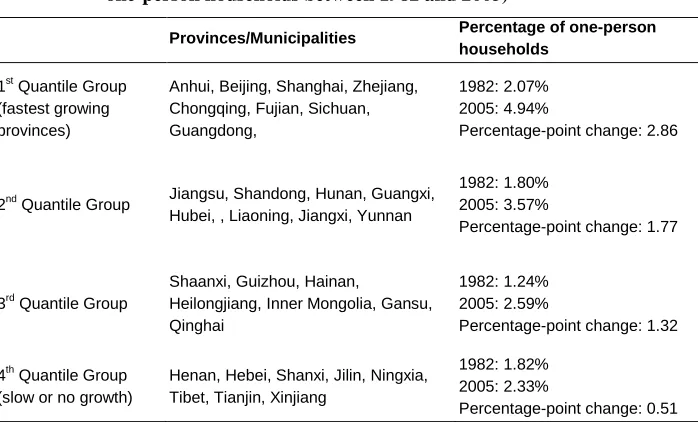
Table 4: Four quantile groups of provinces and municipalities in China (Grouped by the percentage-point change of population living in one-person households between 1982 and 2005)
Provinces/Municipalities Percentage of one-person households
1st Quantile Group
(fastest growing provinces)
Anhui, Beijing, Shanghai, Zhejiang, Chongqing, Fujian, Sichuan, Guangdong,
1982: 2.07% 2005: 4.94%
Percentage-point change: 2.86
2nd Quantile Group Jiangsu, Shandong, Hunan, Guangxi, Hubei, , Liaoning, Jiangxi, Yunnan
1982: 1.80% 2005: 3.57%
Percentage-point change: 1.77
3rd Quantile Group
Shaanxi, Guizhou, Hainan,
Heilongjiang, Inner Mongolia, Gansu, Qinghai
1982: 1.24% 2005: 2.59%
Percentage-point change: 1.32
4th Quantile Group (slow or no growth)
Henan, Hebei, Shanxi, Jilin, Ningxia, Tibet, Tianjin, Xinjiang
1982: 1.82% 2005: 2.33%
Percentage-point change: 0.51
Figure 3: Changing percentage of those living alone in the provincial population and its marital composition 1982 and 2005
For the first (fastest growing) and second quantile groups, data show that the growth of OPH in these provinces was mainly fueled by the increase in single- and married-OPH. While 33.41% and 21.98% of OPH were for single and married in the first quantile group in 1982, respectively, these figures increased to 37.16% and 32.69% by 2005. There was a smaller proportion of widowed-OPH for these provinces over time (38.95% in 1982 and 25.74% in 2005). The first and second quantile groups shared a similar pattern of change in the profiles of OPH. Relatively speaking, the increase for the third quantile group was driven by the increase in married OPH. The final group (slow or no growth) has a relatively stable marital composition over time. As shown, there was stronger growth in the proportion of single and married OPH in the coastal provinces and municipalities. Regardless of the location and time, divorced OPH accounted for less than 10% of all OPH, and was the smallest group.
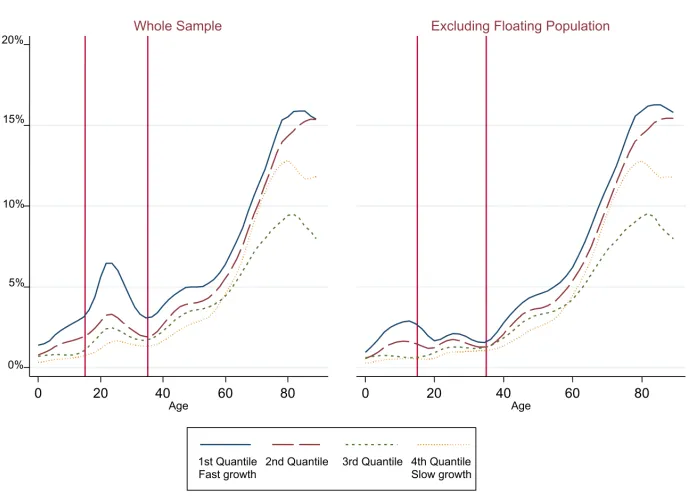
likely to live alone, with approximately twice as many (about 10%) as young adults (less than 5%). From the older age group, those in coastal provinces (i.e., fast-growing areas) had a higher tendency to live alone than those in inland provinces. In addition, the likelihood of young adults aged between 18 and 35 living alone was significantly different between the four quantile groups. A peak for this age group was recorded for the fastest growing provinces, but this was less obvious for the other quantile groups, and almost negligible for the slow growth quantile. The clustering of young adults living in OPH in the economically developed provinces is likely to be due to internal migration.
Figure 4: Age-specific probability of living in one-person households in the four
quantile groups of provinces/municipalities in 2005
5.2 Two-way fixed-effect regression models (Prefecture-level)
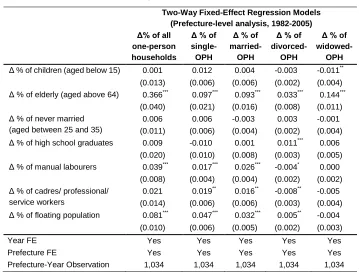
Next, we conduct several fixed effect regression analyses at the prefecture level. Table 5 shows the results of fixed-effect regression models predicting the changes in prefecture-level percentages of different types of one-person households between 1982 and 2005 in China.6 The dependent variables of the models are the prevalence rates of various types of OPH between 1982 and 2005 in a particular prefecture. The independent variables are the percentages of various demographic and socioeconomic indicators at the prefecture level between the three points in time (N=1,034 prefecture-year). After controlling for prefecture- and time-fixed effects, the regression coefficients indicate the change in prefecture-level prevalence rate of OPH associated with a one percentage-point change in the independent variables. Results from the fixed effect regression models show that both local demographic and socioeconomic trends at the prefecture-level are closely associated with the changes in the percentages of one-person households.7
Controlling for the prefecture- and time-fixed effects and other factors, a single percentage-point increase in the proportion of the elderly population in the prefecture is related to a 0.366 percentage-point increase in the prevalence rate of the overall OPH (B=0.366). The increasing proportion of manual labourers (B=0.039) and the influx of migrants without local hukou (B=0.081) also led to an increase in the overall prefecture-level percentage of one-person households. Of the three significant predictors, the proportion of elderly people in the prefecture population is strongly related to the changing prevalence of one-person households between 1982 and 2005 in China. This pattern is consistent across all four types of one-person household. The increasing proportion of elderly in the prefecture population is associated with the increase in the prevalence of single-OPH (B=0.097), married-OPH (B=0.093), divorced-OPH (B=0.033) and widowed-OPH (B=0.144). Not surprisingly, population aging has the strongest effect on the rise of widowed-OPH, compared with its effect on other types.
Economic development, as indicated by the local occupational structure, is also related to the rise of OPH between 1982 and 2005 in China. The increased quantity of the working-age population in manual labour is associated with the increase in the prevalence rates of single-OPH (B=0.017), married-OPH (B=0.026), and the decrease in the prevalence rate of divorced-OPH (B=−0.004), but is not significantly related to the changing prevalence of widowed-OPH. Service/professional-related occupational structure is significantly and positively related to the prevalence of single-OPH (B=0.019)
6 Two way fixed effect models are defined as: y
it = α0 + βxit + αi + γt +εit . where the subscripts i and t denote
prefecture units and year, y and x denote vectors of dependent and independent variables, β denotes a vector of
the corresponding coefficients, α0 denotes the overall constant, αi denotes the prefecture fixed effect, γt denotes
the year fixed effect and εit denotes the error term. For the descriptive statistics of the covariates, please see
appendix 1.
and married-OPH (B=0.016), and negatively related to that of divorced-OPH (B=−0.008). Again, it is not related to widowed-OPH. This finding is consistent with the pattern reported in Figure 3, in that the rise of single- and married-OPH are the main drivers of the increase in OPH in economically developed areas, and the proportion of divorced among all types of OPH is in decline in these areas. The division of labour between service and professional occupations is also not significantly related to the changing prevalence of widowed-OPH. Controlling for other factors, the proportion of high school graduates, another indicator of socioeconomic development, is associated with the increase in divorced-OPH (B=0.011), but not significantly related to changes in the other types of OPH.
Table 5: Fixed-effect models: Prefecture-level population living in one-person
households in China, 1982–2005
Two-Way Fixed-Effect Regression Models (Prefecture-level analysis, 1982-2005) Δ% of all
one-person households
Δ % of single- OPH
Δ % of married-
OPH
Δ % of divorced-
OPH
Δ % of widowed-
OPH
Δ % of children (aged below 15) 0.001 0.012 0.004 -0.003 -0.011** (0.013) (0.006) (0.006) (0.002) (0.004) Δ % of elderly (aged above 64) 0.366*** 0.097*** 0.093*** 0.033*** 0.144***
(0.040) (0.021) (0.016) (0.008) (0.011) Δ % of never married
(aged between 25 and 35)
0.006 0.006 -0.003 0.003 -0.001 (0.011) (0.006) (0.004) (0.002) (0.004) Δ % of high school graduates 0.009 -0.010 0.001 0.011*** 0.006
(0.020) (0.010) (0.008) (0.003) (0.005) Δ % of manual labourers 0.039*** 0.017*** 0.026*** -0.004* 0.000
(0.008) (0.004) (0.004) (0.002) (0.002) Δ % of cadres/ professional/
service workers
0.021 0.019** 0.016** -0.008** -0.005 (0.014) (0.006) (0.006) (0.003) (0.004) Δ % of floating population 0.081*** 0.047*** 0.032*** 0.005** -0.004
(0.010) (0.006) (0.005) (0.002) (0.003) Year FE Yes Yes Yes Yes Yes Prefecture FE Yes Yes Yes Yes Yes Prefecture-Year Observation 1,034 1,034 1,034 1,034 1,034
* p<.05 **p<.01 ***p<.001
Robust standard errors are in parentheses.
1
Next, we focus on the effect of internal migration. The proportion of the floating population in a prefecture is positively associated with all types of OPH except for widowed-OPH in that region. Additionally, the proportion of the floating population is more closely related to the rise in single-OPH (B=0.047) and married-OPH (B=0.032) than to the rise in divorced-OPH (B=0.005). Consistent with the descriptive statistics, the increased floating population affects the probability of living alone in the young working-age population, but not the percentage of widowed-OPH.
The literature suggests that the increasing proportion of single adults has led to the rise in one-person households. However, controlling for other factors, we show that among young adults this is not significantly related to the rise in any of the one-person household types at the prefecture level in China between 1982 and 2005. Nevertheless, the data show that a decline in the proportion of children is associated with the rise in those widowed and living alone (B=−0.011).
6. Discussion and conclusion
This paper contributes to the literature on the international landscape of changing household structures by focusing on the temporal-spatial pattern of one-person households in China. In so doing, it examines the fastest growing family structure in the world’s most populous country. With nearly 60 million people currently living alone in China, it is important to fully understand the profile of and explanation for this growth. Extending the previous literature, we document the trends and patterns and the changing demographic profile of those who live alone, their changing geographical distribution, and the factors contributing to the growth of this household type. We show how demographics, socioeconomic development, and internal migration have led to the increase in different types of one-person households in different ways.
Demographic change has also significantly affected the increase and distribution of one-person households in China. The decline in fertility and the rise of internal migration are related to the increasing proportion of elderly and decreasing proportion of younger adults and children in some local areas. The results presented here suggest that the trend and geographical pattern of aging are related to the increase in one-person households. The coefficients of the proportion of elderly in the fixed-effect models are greater than the other coefficients in the models, and the variation in the age structure is less than the variation in most of the socioeconomic indicators. Therefore, the regional heterogeneity of economic development explains more of the regional variation in the prevalence of OPH than does the aging trend.
We find that the three sets of factors have different effects on the four subgroups. Socioeconomic development is associated with an increase in the number of single and married one-person households in coastal areas over the years, fueled by a growing industrialised economy. In contrast, the demographic structure is more important in explaining the changes in the prevalence of widowed one-person households than other types. When young adults migrate to cities to work, or have fewer children, their parents are more likely to live alone, particularly after widowhood. A decrease in the proportion of children increases the percentage of widowed one-person households in the prefecture population. These results lend considerable support to the three hypotheses in this study. However, we do not find significant evidence showing that the increase in the percentage of single young adults has led to an increase in one-person households. Lack of an effect of singlehood may be due to the fact that single young adults may not be able to afford to live independently or may not be inclined to leave their parental home.
Although we agree with Klinenberg that the growing individualistic culture is related to the increase in living alone arrangements, we argue that the growth in one-person households in China over the past thirty years is influenced by other factors. In particular, the growth in one-person households in China from the 1980s to early 2000s was driven by the aging trend, declining fertility, and the increasing floating population in economically developed areas. This has important implications for the nature of the rising trend of one-person households in China, and therefore the well-being of the people living in these households. We show that there is a substantial increase in young, single and married people who live alone in China. There is now a significantly larger proportion of non-widowed OPH in China than previously. However, single and married one-person households in China are likely to be labour migrants without local
they live far away from their family members. Much research focuses on the well-being of elderly people living alone, but the consequences of these living arrangements for younger people are not well understood. We demonstrate that a substantial number of those who live alone are married, so further studies should examine how this living arrangement is related to spousal dynamics and parent-child relations. More studies on living-apart-together couples, as a new family form, are needed (Levin 2004). The increase in one-person households raises important questions about how the family functions and, indeed, the definition of the family system itself. More work, including qualitative research, would help in understanding the lives of those who live alone. The geographical proximity of the family members of those who live alone also warrants further investigation.
Our findings have important implications for the trajectory of one-person households. In the next few decades, we expect to see a rapidly aging population, an increasing divorce rate, and a continuous increase in internal migration in China, so we anticipate the sharp rise in one-person households to continue, especially in economically developed areas. A greater proportion of non-widowed one-person households is also expected. A new middle-class group who sees living alone as a preferred lifestyle choice may emerge in large metropolitan areas, as in Western societies. The unusually rapid rate of aging in China will result in a substantial increase in the number of widowed one-person households in the next few decades. We can also expect to see a new group of one-person households consisting of disadvantaged men to increase in the next few decades, as the highly skewed sex ratios resulting from the one-child policy leads to an excess of 30−40 million men approaching family formation age. Many of these men in rural areas may not be able to find marriage partners. The general consequence is that a larger and even more diverse one-person household population can be expected in the future.
Limitations
The current study has several limitations. The data analysed are from the micro-level data of the Census and inter-census 1% Population Sample Survey. These data provide a sufficiently large sample size for investigating the spatial pattern, even though living alone remains a small subgroup (in terms of percentage) of the population. However, typical of census data, relatively few other variables are available, particularly for the years 1982 and 1990, to be used as control variables in the multivariate analysis. For example, it would have been useful to have more precise measures of housing affordability, the culture of individualism and urban conditions that favour living alone arrangements.
The interpretation of the relationship between the independent and dependent variables, while informative, remains at an aggregate level. To avoid committing an ecological fallacy, individual and multi-level analyses are required to further investigate the associated factors of living alone at the individual and contextual levels. Despite these limitations, the temporal-spatial patterns of one-person households found in this study advance our understanding of the living-alone phenomenon in China and provide a useful basis for international comparison.
7. Acknowledgements
References
Bengtson, V.L. and Putney, N.M. (2000). Who will care for tomorrow’s elderly? Consequences of population aging East and West. In: Bengtson, V.L., Kim, K.D., Myers, G.C., and Eun, K.S. (Eds.). Aging in East and West: Families, States, and the Elderly. New York: Springer: 263–285.
Bongaarts, J. and Zimmer, Z. (2002). Living arrangements of older adults in the developing world: An analysis of Demographic and Health Survey Household Surveys. The Journals of Gerontology Series B: Psychological Sciences and Social Sciences 57(3): 145–157. doi:10.1093/geronb/57.3.S145.
Burch, T.K. and Matthews, B.J. (1987). Household formation in developed societies.
Population and Development Review 13(3): 495–511. doi:10.2307/1973136. Cai, Y. (2010). China's below‐replacement fertility: Government policy or
socioeconomic development? Population and Development Review 36(3): 419– 440. doi:10.1111/j.1728-4457.2010.00341.x.
Cherlin, A.J. (2012). Goode's World Revolution and Family Patterns: A reconsideration at fifty years. Population and Development Review 38(4): 577–607. doi:10.1111/ j.1728-4457.2012.00528.x.
Chevan, A. and Korson, J.H. (1972). The widowed who live alone: An examination of social and demographic factors. Social Forces 51(1): 45–53. doi:10.1093/sf/51.1. 45.
Démurger, S., Sachs, J.D., Woo, W.T., Bao, S., Chang, G., and Mellinger, A. (2002). Geography, economic policy, and regional development in China. Asian Economic Papers 1(1): 146–197. doi:10.3386/w8897.
Fu, X. and Heaton, T.B. (1995). A cross-national analysis of family and household structure. International Journal of Sociology of the Family 25(2): 1–32.
Goldstein, A., Guo, Z. and Goldstein, S. (1997). The relation of migration to changing household headship patterns in China, 1982–1987. Population Studies 51(1): 75– 84. doi:10.1080/0032472031000149746.
Goode, W.J. (1963). World Revolution and Family Patterns. New York: The Free Press of Glencoe.
Gratton, B. and Gutmann, M.P. (2010). Emptying the nest: Older men in the United States, 1880–2000. Population and Development Review 36(2): 331–356. doi:10.1111/j.1728-4457.2010.00332.x.
Guo, Z. (2000). Family patterns. In: Peng, X. and Guo, Z. (Eds.). The changing population of China. Oxford: Blackwell: 101–114.
Guo, Z. (2008). Study on changes of China family households in recent years. Chinese Journal of Population Science (3): 2–10.
Guo, Z. (2012). Modernization and development trend of family. In: Zhai, Z. (Ed.).
Population change and people's livelihood. Beijing: China Population Publishing House: 416–446.
Hall, R., Ogden, P.E. and Hill, C. (1997). The pattern and structure of one‐person households in England and Wales and France. International Journal of Population Geography 3(2): 161–181. doi:10.1002/(SICI)1099-1220(199706)3:2 <161::AID-IJPG64>3.0.CO;2-2.
Jamieson, L. and Simpson, R. (2013). Living alone: Globalization, identity and belonging. Basingstoke: Palgrave Macmillan. doi:10.1057/9781137318527. Kanbur, R. and Zhang, X. (2005). Fifty years of regional inequality in China: a journey
through central planning, reform, and openness. Review of Development Economics 9(1): 87–106. doi:10.1111/j.1467-9361.2005.00265.x.
Klinenberg, E. (2012). Going solo: The extraordinary rise and surprising appeal of living alone. New York: Penguin Press.
Kobrin, F.E. (1976). The fall in household size and the rise of the primary individual in the United States. Demography 13(1): 127–138. doi:10.2307/2060425.
Kramarow, E.A. (1995). The elderly who live alone in the United States: Historical perspectives on household change. Demography 32(3): 335–352. doi:10.2307/ 2061684.
Levin, I. (2004). Living apart together: A new family form. Current Sociology 52(2): 223–240. doi:10.1177/0011392104041809.
Liang, Z. and White, M.J. (1997). Market transition, government policies, and interprovincial migration in China: 1983–1988. Economic Development and Cultural Change 45(2): 321–339. doi:10.1086/452276.
Lopreato, J. and Yu, M.Y. (1988). Human fertility and fitness optimization. Ethology and Sociobiology 9(5): 269–289. doi:10.1016/0162-3095(88)90009-X.
McGarry, K. and Schoeni, R.F. (2000). Social security, economic growth, and the rise in elderly widows’ independence in the twentieth century. Demography 37(2): 221– 236. doi:10.2307/2648124.
Michael, R.T., Fuchs, V.R., and Scott, S.R. (1980). Changes in the propensity to live alone: 1950–1976. Demography 17(1): 39–56. doi:10.2307/2060962.
National Bureau of Statistics of China (2013). China Statistics: National Statistics. Beijing. http://www.stats.gov.cn/enGliSH/
Ogden, P.E. and Hall, R. (2004). The second demographic transition, new household forms and the urban population of France during the 1990s. Transactions of the Institute of British Geographers 29(1): 88–105. doi:10.1111/j.0020-2754.2004. 00116.x.
Ogden, P.E. and Schnoebelen, F. (2005). The rise of the small household: demographic change and household structure in Paris. Population, Space and Place 11(4): 251– 268. doi:10.1002/psp.370.
Office for National Statistics (2014). Households and household composition in England and Wales, 2001–2011. UK, London: Office for National Statistics.
Ping, T. (2000). Trends and regional differentials in fertility transition. In: Peng, X., and Guo, Z. (Eds.). The changing population of China. Oxford: Blackwell: 22–23. Stone, J., Berrington, A., and Falkingham, J. (2011). The changing determinants of UK
young adults' living arrangements. Demographic Research 25(20): 629–666. doi:10.4054/DemRes.2011.25.20.
Vitali, A. (2010). Regional differences in young Spaniards’ living arrangement decisions: A multilevel approach. Advances in Life Course Research 15(2–3): 97– 108. doi:10.1016/j.alcr.2010.04.003.
Wang, Y. (2008). A study of single-person households of contemporary rural areas.
Appendix 1: Descriptive Statistics: Prefecture-level characteristics and % of the
population living in one-person households in China, 1982−2005
N1 Mean Min. Max.
% living in OPH
1982 347 1.74% 0.24% 4.88% 1990 342 1.54% 0.26% 5.53% 2005 345 3.37% 0.38% 10.55%
% of single-OPH
1982 347 0.54% 0.00% 1.93% 1990 342 0.51% 0.00% 2.46% 2005 345 1.09% 0.07% 6.18%
% of married-OPH
1982 347 0.43% 0.00% 1.58% 1990 342 0.33% 0.00% 2.56% 2005 345 1.05% 0.00% 4.26%
% of divorced-OPH
1982 347 0.12% 0.00% 1.44% 1990 342 0.11% 0.00% 0.86% 2005 345 0.23% 0.00% 1.68%
% of widowed-OPH
1982 347 0.65% 0.00% 3.06% 1990 342 0.59% 0.00% 3.27% 2005 345 1.01% 0.04% 4.29%
% of children (aged below 15)
1982 347 35.60% 17.35% 47.59% 1990 342 26.05% 16.94% 39.12% 2005 345 21.03% 9.98% 34.40%
% of elderly (aged above 64)
1982 347 4.72% 1.09% 7.79% 1990 342 6.11% 1.63% 11.03% 2005 345 8.43% 3.21% 18.08%
% of singlehood in the population between age 25 and 35
1982 347 8.75% 1.83% 29.01% 1990 342 10.90% 2.80% 43.52% 2005 345 10.71% 2.68% 47.50%
% of high school graduates
1982 347 7.19% 1.13% 28.04% 1990 342 9.75% 0.00% 47.72% 2005 345 16.92% 0.35% 51.14%
% of manual labourers
1982 347 12.11% 1.19% 45.30% 1990 342 11.51% 0.16% 48.65% 2005 345 11.64% 0.86% 48.70%
% of cadres/managerial/administrative/ professional/service workers
1982 347 8.90% 2.26% 29.52% 1990 342 11.24% 0.74% 55.99% 2005 345 17.95% 1.23% 53.91%
% of floating population
1982 347 1.45% 0.14% 13.52% 1990 342 2.76% 0.00% 46.73% 2005 345 11.08% 1.02% 74.22%
1