of peer-reviewed research and commentary in the population sciences published by the Max Planck Institute for Demographic Research
Doberaner Strasse 114 · D-18057 Rostock · GERMANY www.demographic-research.org
DEMOGRAPHIC RESEARCH
VOLUME 2, ARTICLE 5
PUBLISHED 5 MAY 2000
www.demographic-research.org/Volumes/Vol2/5/
DOI: 10.4054/DemRes.2000.2.5
Family Dynamics of 63 Million (in 1990)
to more than 330 Million (in 2050) Elders
in China
Zeng Yi
Linda George
Family Dynamics of 63 Million (in 1990)
to more than 330 Million (in 2050) Elders
in China
Zeng Yi1
Linda George2
Abstract
This paper confirms very rapid increase in proportion of elderly, huge numbers of elders, an
extraordinarily rapid increase of oldest old, and more serious aging problems in rural than urban areas in China. Comparative data analysis on family dynamics of elderly, males vs. females,
younger elders vs. oldest old, rural vs. urban, and 1982 vs. 1990 are presented. Family household projection reveals that the family and living arrangements of the Chinese elderly would change dramatically during the first half of 21th century. Drawing upon our empirical findings, we presented policy recommendations on strengthening family support system, establishing an old age insurance program in rural areas, favourable policy for elderly women in consideration of their disadvantaged status, and smoothly transiting to a two-child plus spacing policy.
1 Senior Research Scientist at the Center for Demographic Studies and the Department of Sociology of Duke University,
Professor at the Institute of Population Research of Peking University, and a Distinguished Research Scholar at the Max Planck Institute for Demographic Research.
2 Professor at the Department of Sociology and Associate Director of the Center for the Studies of Aging and Human
Development at Duke University.
Please send correspondence to:
Prof. Zeng Yi, Center for Demographic Studies, Duke University 2117 Campus Drive, Durham, NC 27708
1 Introduction
Populations are aging with changes in family structure and living arrangements of the elderly
2 Extremely Rapid Process of Population Aging
2.1 Fastest Increase in Proportion of Elderly Persons
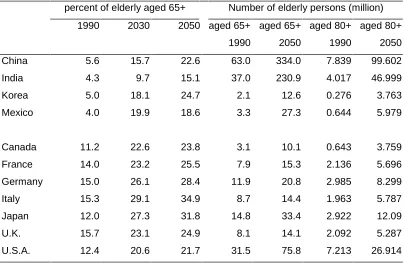
Previous studies [e.g.2, 7, 17, 25, 41, 47, 50] show that, although the proportion of elderly age 65 and above of the Chinese population is not very high now (5.6% in 1990), the speed of population aging will be extremely fast in the first half of the next century. Under medium fertility [Note 1] and medium mortality [Note 2] assumptions, the Chinese elderly age 65 and older will
account for 15.8 and 23.1 percent of the total population by 2030 and 2050, respectively [47,50]. The 1998 projections by the United Nations under medium fertility and medium mortality
assumptions show that the Chinese elderly age 65 and older would comprise for 15.7 and 22.6 percent of the total population in 2030 and 2050, respectively [29, p273]. The medium variant of the U.N 1998 projection is almost the same as our medium projection 10 years ago, performed independently and based on substantially different methodologies and base populations in different years [Note 3]. Such consistency confirms that extremely rapid population aging in China in the first half of next century is definite – the proportion of elderly population age 65+ in 2050 will be more than four times as high as in 1990. The annual rate of increase in the proportion of the elderly population between 1990 and 2050 is 2.3 percent.
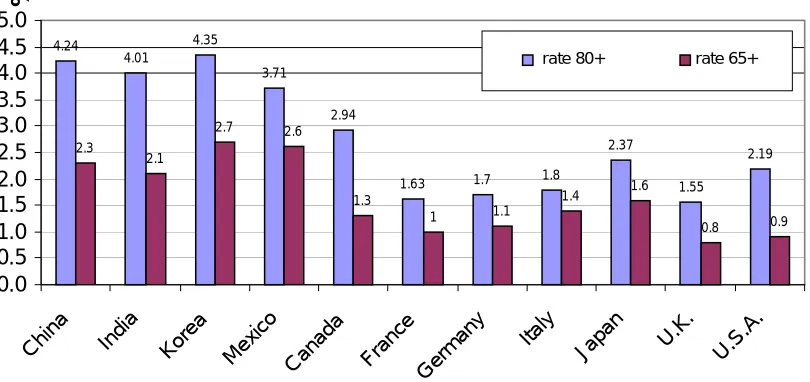
annual growth rates of the proportions of elderly between 1990 and 2050 in China and selected developing and developed countries with large population sizes. By the middle of the next century,
the proportion of elderly persons in China will be higher than in the U.S. by 0.9 percentage points, and the average annual increase between 1970 and 2050 in China is 2.6 times as high as in the
United States. The anticipated proportion of elderly population in China in 2050 is somewhat lower than in Canada, France, and U.K., and substantially lower than in Germany, Italy and Japan. But the annual increase of the percent of elderly population between 1990 and 2050 in China will be much higher than in those European countries, and 44 percent higher than in Japan.
FIGURE 1 TABLE 1
It is interesting to note that China is not alone with respect to extremely rapid population aging among developing countries. The proportion of elderly in Korea will climb to a higher level with a larger annual increase rate than in China. Mexico and India, two developing countries with large population sizes, also will undergo very rapid population aging at annual increase rates of 2.6 and 2.1 percent, although their proportions of elderly in 2050 will be substantially lower than in China. The annual increases in the proportion of the elderly between 1990 and 2050 in China, India, Korea and Mexico are all much higher than in European and North American countries. This fact deserves
serious attention, not only in those developing countries, but also from international organisations and developed countries as well [13,14,22].
2.2 Huge Numbers of Elderly Persons
The very large size of the elderly population is another unique characteristic of population
elders in China in 2030 and 2050, respectively, under their medium mortality assumption [29, p273]. Again, the surprising consistency of the projected total numbers of elderly in China in the
next century, produced independently by different scholars at different times, 10 years apart, following substantially different approaches, confirms the anticipated huge quantity of elderly
persons in China in the next century.
Table 1 also presents the numbers of elderly persons in other selected countries projected by the Population Division of the United Nations [28,29] under the medium variant. Under the medium mortality assumption, China’s elderly population will be fairly close to the total population size of the United States, and 4.4 times as large as the U.S. elderly population by the middle of the next century. China’s elderly population will outnumber India’s by 103 million, while the Chinese total population size will be smaller than India by 51 million in 2050.
2.3 Even More Extremely Rapid Increase of “Oldest Old” Persons after 2020
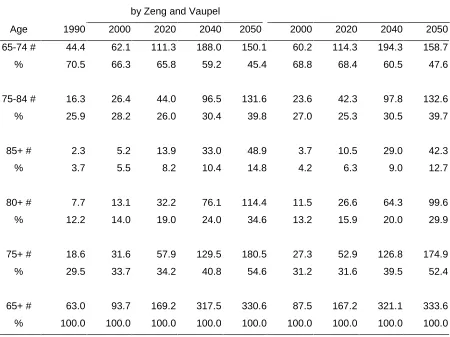
Table 2 provides the projected numbers and percentage distributions by various age groups for
the elderly population in China. There were about 8 million "oldest old" (age 80 and over) in 1990. As compared with the increase of all elderly persons age 65 and above, the number of the oldest old
will climb much faster to about 13, 32, 76, and 114 millions in the years 2000, 2020, 2040 and 2050, respectively, under the medium mortality assumption. The average annual increase rate of the oldest old between 1990 and 2050 will be 4.2 percent! The percent share of the oldest old among the elderly population will be nearly tripled from 1990 to 2050. From 1990 to 2040, the share increases by approximately 2.5 percentage points per 10 years. But in the 10 years from 2040 to 2050, the share increases by 10.6 percentage points! The main reason why the number of "oldest old" will climb so quickly after year 2040 is that China's baby booms in the 1950’s and the 1960's will fall into the category of "oldest old" at that time.
TABLE 2
2.4 Extraordinarily Rapid Population Aging under the Low Mortality Scenario
The extremely rapid population aging discussed above are all based on the medium mortality assumed by the U.N. Population Division [28] and by us. The underlying assumption of the medium mortality variant is that there will be slow progress in reducing mortality in China during the next century – from a life expectancy of 68.4 years for both sexes combined in 1990 to 78.8 in 2050. This is quite conservative, given the fact that life expectancy in Japan in 1995 was already 80 years. Some recent research indicates that there might be a significant improvement in mortality in the next century, because of biomedical advances and breakthroughs, and better personal health practices, such as healthy diets, not-smoking and exercise etc. We, therefore, made another optimistic scenario, namely, life expectancy for both sexes combined was assumed to approach 84.9 years by 2050 [25], a level that is about 4.5 years higher than in Japan today. This low mortality scenario is
subject to uncertainty, but we believe that it is not impossible. For example, male and female life expectancies in Japan in 1950 were 7.7 and 10 years lower than in the United States, respectively, but the difference disappeared in 1960s [25, p32]. Rapid socio-economic development plus the Eastern Asian style of healthy diets and habits in China may narrow the gap between Chinese and Japanese mortality levels in the next century. Some scholars thought that a life expectancy of 85 years represented the limit of human life expectancy [e.g. 6,26]. However, most scholars now think that human beings can, on average, live much longer than 85 years [e.g. 8,21,40]. Despite uncertainty, the medium and the low mortality scenarios bracket an informative range of possibilities in China during the first half of the next century.
improved health practices make the low mortality scenario become reality, population aging problems in China will be much more serious in the next century.
2.5 More Serious Aging Problems in Rural Areas than in Urban Areas [Note 5]
Although fertility in rural areas in China is much higher than in urban areas, aging problems will be more serious in rural areas because of the continuing massive rural to urban migration of which the large majority is young people. Under the medium fertility and medium mortality assumptions, the proportion of the elderly will be 26 and 22 percent in rural and urban areas respectively by the middle of the next century. The proportions will be 31 percent in rural area in contrast to 26 percent in urban areas under the medium fertility but low mortality assumptions [47].
While the percent of elderly in rural areas in the next century will be substantially higher than in urban areas, the rural elderly are much less able to obtain necessary social support and services. According to a survey of the elderly conducted in 1992 in 12 provinces (Beijing, Tianjing, Shanghai, Zhejiang, Jiangsu, Heilongjiang, Shanxi, Shananxi, Shichun, Guangxi, Guizhou, and Hubei), only 5.9 percent of the rural elderly age 60 and over were pension recipients, in contrast to 73.7 percent in the urban areas. 66.6 percent of the urban elderly had their medical expenses paid
entirely or partially by the government or collective enterprises in 1991. However, this figure was only 9.5 percent for the rural elderly. In another survey conducted in 1987, a relatively small proportion (32.5 percent) of the elderly in urban areas reported that they had difficulties in obtaining medical care, while a big majority (94.8 percent) of the rural elderly had medical difficulties. About 21.3 percent of the urban elderly reported that their nutrition status was bad, and this percent was as high as 53.3 for rural elderly (PRI of CASS 1988).
3 Family Dynamics and Living Arrangement of Elderly Persons
It is very clear that Chinese population aging will be extremely rapid and the size of the
elderly population will be exceptionally large in the first half of the next century. Population aging is accompanied by changes in family household structure (see e.g., Wolf 1994, for a review). Elderly persons depend upon spouses and children for emotional and physical support, and financial aid as well, especially in rural areas in China. Past research has established that family care is an important part of long-term care, and has substantial impact on caregiving arrangements for the elderly (e.g. Soldo et al. 1990). In particular, the use of institutional long-term care has been shown to vary by family status [5]. Cohorts who will become the elderly of the 21st century have been on the leading edge of the family changes, with rapid decreases in fertility and quick rises in divorce, and changes in attitudes about co-residence between parents and married children [48]. Long-term care costs in the U.S. have doubled during each decade since 1970, reaching an annual level of $106.5 billion in 1995. Home health care costs grew 90.7% from 1990 to 1995, in contrast to 33.4% for institutional care costs [37]. Thus, the mix of home based and institutional care has been rapidly shifting towards home health care, especially for the oldest elderly [9]. Clearly, changes in family structure strongly affect caregiving needs, the long term care health service system, and health-related policy-making [4,10].
How may demographic and socio-economic changes alter the family households and living arrangements of the Chinese elderly population? How many elderly persons live alone, or with a spouse only, or with children or grandchildren or other relatives, or in institution? How many elderly live with a son or daughter and his or her spouse? What are the gender and rural-urban differences? What are changes of family structure and living arrangements in the recent past, and what are the
3.1 Family structure and living arrangement of Elderly Persons in 1990
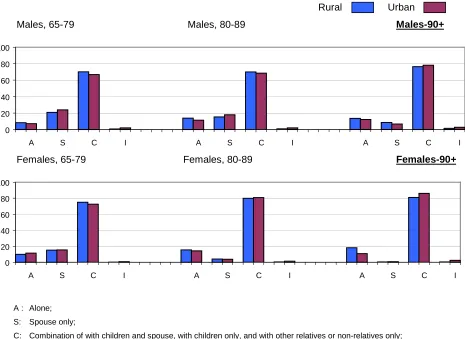
Table 3 and Figure 2 present detailed and simplified percentage distributions of family structure and living arrangements of elderly persons in Mainland China, comparing rural and urban areas, based on the 1990 census data. We classify the elderly into three age groups: the moderately old (persons age 65-79), very old (persons age 80-89), and extremely old (persons age 90+). The broader age category “oldest old” is a combination of the very old (age 80-89) and extremely old (age 90+). We will employ this terminology in the following discussions.
TABLE 3 FIGURE 2
3.1.1 Co-Residence with Children
A large majority of the moderately old women (73.9%) and men (68.7%) live with their children (children include grandchildren hereafter, unless otherwise specified). A higher proportion (79.9% of females and 69.1% of males) of the very old live with their children. The corresponding figures for the extremely old are the highest: 82.4% for women and 76.7% for men (see Table 3). It is very clear that a large majority of the Chinese elderly live with their children, and the higher the age, the higher the proportion living with their children. Female elderly persons of all age groups are more likely to live with their children, because elderly women are more likely to be economically dependent and widowed.
corresponding figures for women age 80-89, 90-99, and 100+ are 15.4, 18.8, and 18.1, respectively. These figures show that, on one hand, most of the oldest old live with adult sons, and on the other
hand, a considerable portion of them live with adult daughters.
Based on 1990 census data, among the moderately old who live with offspring, a majority (66.8 and 79.6 percent of men and women) lives with both children and grandchildren. A larger majority (82.6% for men and 83.2% for women) of the very old who live with offspring lives with both children and grandchildren. The corresponding figures for the extremely old men and women are 79.5% and 77.1%, respectively (see Table 3). In the cultural context of Chinese society, multi-generation family households are one of the main living arrangements for the elderly, especially for the oldest old.
Slightly more than 2 percent of the moderately old men and women live with grandchildren without son or daughter present. The corresponding figures are 2.1 and 1.5 percent for very old males and females, and 2.7 and 1.3 percent for extremely old men and women (see Table 3). This kind of two-generation household, consisting of grandparents and grandchildren, indicates that in Chinese society grandchildren may care for their grandparents when the middle generation is not available (perhaps due to reasons of job location or death), or another way around – not very old grandparents take care of young grandchildren.
3.1.2 Living with a Spouse
not living with a spouse increases tremendously with age, due to high rates of widowhood at old ages (divorce rate in China is extremely low). Many more elderly women are widowed than men
because of the gender differential in mortality at advanced ages.
3.1.3 Living Alone or with Other Relatives or Non-Relatives
The proportion of moderately old men and women living alone is 8.0 and 10.2 percent, in contrast to 13.2 and 15.2 for the oldest old males and females, respectively (differences in the proportions living alone between ages groups 80-89 and 90+ are very small, see Table 3). Note that elderly women are much more likely to be widowed and thus live alone. On the other hand, elderly women are economically more dependent. Therefore, the disadvantages of women in marital life
and living arrangements are substantially more serious than those of men at advanced ages.
A very small proportion (0.6 and 0.3 percent for moderately old men and women; 0.4 and 0.2 percent for oldest old men and women, respectively) of the Chinese elderly lives with other relatives or non-relatives, without children present (see Table 3). This fact demonstrates that Chinese elderly rarely live with other people than offspring and spouse.
3.1.4 Living in Institutional Household
into an institution is disability. Note that the Chinese elderly women’s lower social and economic status made them less likely be able to access long-term care facilities. This is another social
disadvantage faced by elderly women in Chinese society, which merits attention from the society and government.
3.2 Rural-urban Differentials in 1990
Table 3 and Figure 2 present detailed and simplified percentage distributions of family structure and living arrangements of elderly persons in 1990, with a comparison between rural and urban areas. The proportion of the moderately old men who live with children in rural and urban areas in 1990 was 69.7 and 65.9, respectively, and the corresponding figures for women were 74.7
and 71.8, respectively (see Table 3). Thus, the rural moderately old persons are more likely to live with their children than their urban counterparts. However, the proportions of very old and extremely old persons who live with their children in the rural areas is slightly lower than in the urban areas, except for men age 80-89. More studies are needed to explain this phenomenon.
The proportions of those moderately old, very old, and extremely old men and women who
live with both children and grandchildren are all higher in rural than in urban areas (see Table 3). This confirms that multi-generation family household is more popular in rural areas than in urban
areas in contemporary China.
The proportion of the moderately old, very old, and extremely old who live with grandchildren without son or daughter present is about 2-5 times higher in urban areas than rural areas (see Table 3). This suggests that job location (rather than death) of the middle generation is the main reason for these special two-generation households consisting of grandparents and grandchildren in China.
Slightly more moderately old men and women live with only a spouse in urban areas than rural areas. However, there are no clear pattern of rural-urban differences in living with spouse only among the very old and extremely old (see Figure 2 and Table 3).
There is no clear pattern of rural-urban differences of proportions of the moderately old who live alone, but it is evident that the proportions of the very old and extremely old who live alone are higher in rural areas than urban areas (see Figure 2 and Table 3). People generally speculate that the urban elderly are more likely to prefer privacy and independent family structure and living arrangement, and thus are more likely to live alone than their rural counterparts. But the Chinese census data do not support this hypothesis. Perhaps some other factors such as higher widowhood rates, lower remarriage rates, and fewer long-term care facilities in rural areas than urban areas offset the effects of rural-urban attitudes differences. One may also speculate that the preference for privacy and independent family structure and living arrangements, even among Chinese elderly in the urban areas are still not strong. More in-depth studies are needed.
rural oldest old living in the institutional households are there because of childlessness, rather than disability. Chinese policies in rural areas allow only those elderly who have no close relatives to stay
in the government subsided institutional households. In urban areas, the facility limitation and institutional policy are relatively less restrictive, permitting more elderly to live in institutional
households.
3.3 Changes between 1982 and 1990
Table 4 and Figure 3 present detailed and simplified percentage distributions of family structure and living arrangements of elderly persons (rural and urban areas combined [Note 8]), with a comparison between 1990 and 1982, based on the censuses data collected in these two years. The
and the household register booklet was used as ID. This led some young or old people, who actually lived with their family members, to register as a separate household. The number of one-person
households including elderly persons living alone, was over-enumerated, and the elderly living with children was under-enumerated. Such biases resulted in that the State Statistical Bureau adjusted the
urban average family household size enumerated in the 1982 census from 3.84 to 3.95 through a post-census sample check. The rural household size was not adjusted, but a similar bias (that might be smaller) existed in the rural areas in the 1982 census. Such biases were much less serious in 1990 because the food ration system was basically eliminated and the incentives for having more household register booklets were greatly reduced. Second, increases in remarriage rates and decreases in death rates at old ages may also partly explain why the proportion of the elderly who lived alone declined between 1982 and 1990. The increase in remarriage rates among elderly persons was a result of the social reform and the progress of mate-made services in the late 1980s. The reform aimed at protecting elders’ rights, including the right to remarry that were often violated by the intervention of children and other family members in traditional Chinese society. Rapid economic development, accompanied by the substantial improvements in the standard of living might decrease death rates at old ages. Although these explanations are speculative due to the lack of empirical data, we believe that the family structure and living arrangements of the Chinese elderly in the 1980s were not a return to tradition. We also believe that the traditional norm that Chinese elderly should live with their children changed little, if at all, between 1982 and 1990.
TABLE 4 FIGURE 3
explanatory factors for this interesting phenomenon are increases in remarriage rates among the elderly age 65-89 and decreased death rates in the 1980s, as discussed above. Another possible
candidate of the explanations is decreases in divorce rates among the moderately old persons. But this factor can be ruled out, since divorce rates among elderly persons are extremely low in China,
and there is no evidence of further decline. In fact, the general divorce rates for the whole population have substantially increased in China since 1980 [57].
As compared to 1982, the proportion of the elderly living in institutional households increased by 1990 among women age 80-89 and men and women age 90+, remained unchanged among men age 80-89 and women age 65-79, but decreased among men age 65-79 (see Figure 3 and Table 4). Socioeconomic development in the 1980s may have contributed to improvement of long-term care facilities, which facilitated the increases in the proportion of those living in institutional households, although it is still very low. Commercial nursing home facilities for the elderly have been growing quickly since 1990 due to rapid economic development, and the percents of the institutionalized oldest old in 1998 are 6.1 for men and 6.7 for women age 80+, based on the 1998 survey data conducted in the 22 provinces. These figures are still low, as compared with the Western countries, but have tremendously increased since1990. Modernization in China may further increase the proportion of the elderly living in long-term care institutions in the future.
3.4 Future Perspectives
According to an application to the multidimensional family household projection model developed by Zeng, Vaupel and Wang [55,56], the family household structure and living
arrangements of the Chinese elderly will change dramatically during the first half of the 21th century. Base population and other required data for the Chinese family household projection are
derived from the 1% data file of the 1990 census, the 1988 two-per-thousand Fertility and Contraceptive Survey, and the 1985 In-Depth Fertility Survey (see [51], for more detailed resources, estimates and discussions). We present two major scenarios with the same medium fertility, but different (medium and low) mortality assumptions, which are described in the endnotes 1 and 2 of this paper. The assumptions about first marriage, divorce, remarriage, and leaving the parental home for the two scenarios are the same. The rural and urban propensities of divorce are assumed to increase from 6 and 10 percent in 1990 to 15 and 25 percent in 2050, respectively [Note 9]. By the middle of next century, the propensities of remarriage after divorce and widowhood are assumed to decline by 20 to 50 percent in rural and urban areas. The rural and urban proportions of parents who have at least one married child but do not live with any of them are assumed to increase by 30 to 45 percent. The proportion of population residing in urban areas is assumed to increase from 26.5 percent in 1990 to 70 percent in 2050. It should be emphasised that the nature of the above assumptions in our scenarios is purely for policy analysis to answer “what if” questions, and we do not intend for precise predictions.
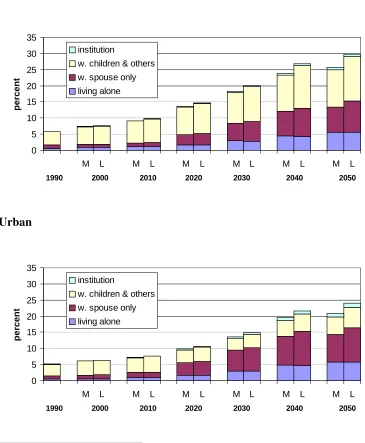
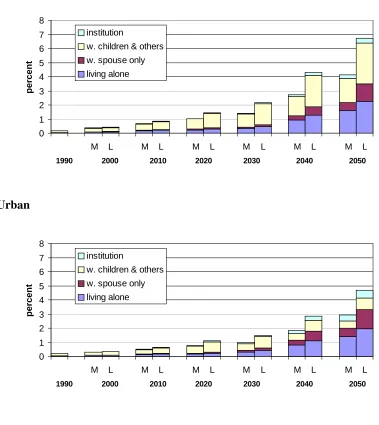
Figure 4 and 5 present the projected percent of total population that are elderly by types of living arrangement in the rural and urban China from 1990 to 2050. Percent of elderly age 65+ living alone among the total population in 2030 would be 5 and 6 times as large as that in 1990 in the rural areas and urban areas, respectively. In 2050, the percent of the elders age 65+ living alone would be 11 and 12 times as large as that in 1990 in the rural and urban areas, respectively. The increase of the percent of the oldest old age 85+ living alone in 2030 and 2050 would be even much
of elderly living with children, and in the institution will also increase due to very large increase in the total percent of the elderly population, but to a much less extent (see Figures 4 and 5). Moreover,
there would be a total of 89 million or 96 million elderly age 65+ living alone in the year 2050, under the medium and low mortality assumption, respectively. Some 22 or 38 million of this group
would be aged 85 and older.
Note that such dramatic increases of percent of the elderly, especially the oldest old, living alone or living with spouse only among the total population are largely due to dramatic increase of the total percentage share of the elderly. For example, the total percent of the oldest old age 85+ in 2050 would be 21-34 times as large as in 1990 in the rural areas, 14-22 times as large as in 1990 in the urban areas, which is a result of low fertility (average number of children of elderly who reach age 65 after 2010 would be less than one third of that of those elderly in 1990), and increasing longevity. It is also due to decrease in co-residence between parents and married children, and migration away of children, while increase in divorce rates may have very small effects on percent of elderly living alone [56, p77].
Although future developments in technologies of communication, transportation, housing and social services will change what it means to “living alone” today by the year 2050, 89-96 million elderly living alone and 22-38 million among them are over age 85 are large burdens for the society. Clearly, the middle of the next century will be a difficult time for the country due to serious problems of population ageing.
4 Discussion and Policy Considerations
A combination of rapid fertility decline since 1970, continued decrease in mortality, and the
large baby-boom cohorts born in the 1950s, 1960s and early 1970s is the demographic base for the extremely rapid population aging in China. Total fertility rates in China tremendously declined from about 6 children per woman before 1970 to about 2.6 children by the end of the 1970s, cut by more than a half in a decade. Chinese fertility continued to steadily fall (with some fluctuation around 1987) to slightly below replacement level today. While the tremendously declined fertility since 1970 has resulted in smaller cohorts of young persons, the large cohorts born during the first and second baby booms in the 1950s, 1960s and early 1970s will become elderly in the first half of next century. There were 172 million persons age 35-44 (born in 1950-1959) in 1995, and they will become elders age 65+ after 2015-2024. There were 355 million persons age 20-34 (born in 1960-1974) in 1995, and they will be age 65+ after 2025-2039. Continued mortality decline will enable more members of those huge baby boom cohorts to survive to old ages. As indicated by Grigsby and Olshansky [7, p328], at least 50 percent of the projected increase in population aging between 1980 and 2050 in China is a product of the momentum for aging that is already built into the present age structure and vital rates.
Obviously, the trend of Chinese population aging is not avoidable, and further declines in mortality and fertility will accelerate this trend. What can we do in responding to such extremely rapid aging in China? Analyses presented in this paper suggest that strengthening family support for the elderly is one policy strategy that needs to be investigated and adopted. As discussed above, large majorities of Chinese elderly, especially the oldest old persons, live with their children including grandchildren. The strong cultural preference of the Chinese elderly for living with
the elderly and satisfy the increasing needs of privacy and independence in daily life, the so-called parent-child proximity apartment units need to be promoted through governmental subsidies. The
basic idea is to have two kitchens, two living rooms and at least two bathrooms in one apartment unit. The unit is structured such that old parents and one of their adult children and his or her family
live in the same housing unit, while both generations can also enjoy their own privacy and independence. Elderly can easily receive assistance from children and they may conveniently provide help to care for grandchildren, and at the same time, generation differences with respect to preferences for eating, watching TV, and time schedules of daily activities etc. can be preserved.
Population aging in China in the next century will lead to a heavy burden of support for a mass of elderly people, and aging problems will be more serious in rural areas than in urban areas. How to respond to the problems of population aging in rural areas is an urgent issue on China’s agenda for the 1990’s and the next century. Given the strong cultural preference of the Chinese elderly for living with children and the possibility of maintaining or even strengthening family support in China, should government give all or major responsibilities of old age care to families? Because there is so far very little social insurance program in the Chinese rural areas and limits on government resources, some people including some policymakers proposed an official statement that old age support in rural areas should mainly rely on family. We think that this policy idea is inappropriate for several reasons. First, mainly relying on family for old age support in rural areas may not be feasible in the next century, because the aging problems will be more serious in rural areas than in urban areas. The future rural elderly will have on average 2 or a little bit more children, and many of their children may migrate to urban areas (in contrast to the rural elderly in the past and today who had about 6 children staying in rural areas). The joint survival of parents and children will substantially increase [39] in the future, so that the future burden of caring for old parents per child will be much larger than today. Second, mainly relying on family support without social
expressed in the old Chinese saying "having sons for old age care" (yang er fang lao). When fertility is greatly reduced, the practical needs of "having sons for old age care" have led people to try to
conduct prenatal sex determination by ultrasound diagnostic and other techniques, and sex-selective abortions [49]. The reported sex ratio at birth reached 117.0 boys per 100 girls in 1997 [36], in
contrast to the normal value of about 106. If the government officially states that “old age supports mainly rely on family in rural areas”, peasants may say: “if we do not have more children and at least one son, how could the elderly be supported?” Obviously, such a policy will not good for family planning and reversing the dangerous trend of a rising sex ratio at birth. Establishment of an old age insurance system in rural areas is therefore an extremely important response to population aging, family planning and reversing the sex ratio at birth in China. However, is it practical and how can peasants who were just lifted out of poverty be mobilised to make contributions of premium for old age insurance? Is it feasible and how can an old age insurance program be implemented in the less developed rural areas? With such questions in mind, the first author went to Shandong and Shichuan provinces, which are the experimental areas for the old age insurance program in rural areas, to conduct field studies in 1993 and 1996. The evidence gathered in this and other studies show a promising trend in the direction of establishing the old age insurance programs in rural areas. However, this great engine has just started and it is facing and will continue to face many problems and difficulties. The Chinese government and the society at all levels should pay more attention and make more efforts in this area [52].
The old pension system that was implemented in the state-owned enterprises in the urban areas in China was established in the 1950s and based on the former Soviet Union's model at that time. Many Chinese reformers have recognised the urgent needs for reforming the old pension system in urban areas. Moreover, the new system should also cover all other citizens who are not working in state-owned enterprises. Chinese policymakers should continue to act effectively to establish and
In addition to an old age insurance program that is critical to respond to aging challenges and reduce son preference, another important policy recommendation is to encourage elders to live with
their daughters. This study has shown that this policy option is highly feasible, given the fact that nearly 30 percent of the elderly in urban areas lived with their daughters in 1990, and this figure was
nearly 18 percent for rural and urban areas combined. If the government provides economic or moral rewards and the public media give more publicity to families with old parents and their daughters living together, the traditional preference for sons may gradually lose its market. Since daughters and their spouses are usually more willing and able to provide better physical and psychological care to their old parents, a policy for promoting living with daughters may be beneficial for the elderly as well.
Data analyses presented in this paper have shown that elderly women are much more likely to be widowed, and more likely live alone. Elderly women are economically more dependent and less likely to use long-term care facilities. The disadvantages of older women in marital status and living arrangements are substantially more serious at advanced ages and in rural areas. This is another important issue, which needs serious attention from society and government. Any kind of long-term care services sponsored by the government should take into account the disadvantaged status of elderly women, and give them favorable policy. Very careful attention should be given to make sure that any old age insurance programs to be developed or reformed must benefit older women and men equally.
Numerous studies have shown that the elderly are not only consumers and care receivers, but also producers and care providers, especially when they are still healthy. Based on a elderly survey conducted in the Wuhan area in China, Liang, et al. [18, p58] found that Chinese elderly usually provide a substantial amount of help to others while they receive care, and they are satisfied with
fostering community programs, which mobilize younger and healthier elderly to provide accessible services for the dependent elderly [19, p145]. It was estimated that one-fourth to one-third of
China’s elderly continue to be employed in paid or volunteer work. Many retired professionals, for example, provide technical consulting services to small firms located in towns or villages [24, p19].
Properly mobilizing and organizing the elderly to participate in community services and interpersonal exchange programs also will improve elderly persons’ spiritual wellbeing, particularly continuing to feel needed and productive. This is one of the important policy actions to be considered to resolve the serious aging problems in the next century.
Facing the extremely rapid population aging, we believe that China needs to start from now on to smoothly transit to a "two-child plus spacing" policy. This policy would promote later marriage, later first birth, and appropriate spacing (4-5 years) between the first and second child. Couples who voluntarily chose to have only one child should be continuously rewarded. As shown in some limited experimental areas discussed elsewhere [54], the two-child plus spacing policy can help to reduce the still high fertility in many rural areas, because it meets better the practical needs of peasants and is thus more acceptable by rural couples. Couples who obey the current one-child policy in urban areas, and the 1.5-child policy (e.g. if the first child is a girl, the couple is allowed to have the second birth) in rural areas will have much less family support when they become old, as compared to those who have more children by violating the policy. This is unfair, but very difficult to change because the one-child and the 1.5-child policy do not meet peasants’ practical needs. The universal two-child plus spacing policy will better realise the principles of equality among citizens. Later birth and longer spacing will enable future elderly to enjoy a longer period with support from their young and middle age children, as compared to the usual practice of early childbearing under the current policy. The current 1.5-child policy in the rural areas implicitly gives more value to a boy than a girl. The two-child plus spacing policy can help to eliminate such bias and to equalise the familial position of sons and daughter and
areas may cause a new baby boom. China does need carefully designed scientific research to convince policymakers to move towards the two-child plus spacing policy. China also needs solid operational
5 Acknowledgement
An earlier version of this paper was presented at the U.N. Technical Meeting on Population
Appendix: A
Technical Note on Discrepancy in Projected Number of Oldest Old Persons Age
80+
As discussed in the text, the U.N. projected number of oldest old persons (age 80+) in 2050 (99.6 million) is considerably smaller than our projected (114.4 million), and the projected age distributions among elderly population notably differ from each other (see Table 2). This discrepancy is partly due to differences in model specification and slightly different assumptions about future life expectancy. We classify the population into rural and urban sectors, but the U.N. did not. Starting years of our and the U.N.’s projections differ from each other. The U.N. used a constant –0.1 per thousand net international migration rate, but we did not. In our current research for preparing this paper, we performed a new exercise in which we combine rural and urban sectors, start our projection from 1995, and use the same life expectancy assumption and constant net international migration rate as the one used by the U.N.. In this new exercise, the only difference is the ways for interpolating age-specific death rates. The U.N. Population Division used model life tables to interpolate the 5-year age-specific death rates in the future years. We followed an iterative procedure to alter the death rates proportionally at the same rate at all ages of single-year specific, and the iterative procedure stops when the projected life expectancy at birth in the particular year is achieved [1,44]. The discrepancy between results from our new exercise and the U.N. projection
the projected life tables with the same assumptions of life expectancies at birth but following the U.N. model life table approach and the approach of proportionally reducing death rates by us,
respectively. The shapes of the curves of the two sets of life table survival probabilities look plausible, but the U.N. model life table survival probabilities are slightly higher before age 75, but
significantly lower after age 80.
References
1. Ahlburg, Dennis A. and James W. Vaupel (1990). Alternative Projections of the U.S.
Population, Demography 27: 639-652.
2. Banister, J. (1990). Implications of aging of China’s population, in: Zeng Yi, Zhang Chunyuan and Peng Shongjian (eds.), Changing Family Structure and Population Aging in China: A
Comparative Approach. Beijing: Peking University Press, 1990. And in Dudley L. Poston, Jr.
and David Yaukey (eds.), The Population of Modern China. New York: Plenum Press, 1992.
3. Buttner, Thomas (1999). Approaches and Experiences in Projecting Mortality Patterns for the Oldest Old in Low Mortality Countries. Working Paper No. 31. Statistical Commission and Economic Commission for Europe. Conference of European Statisticians. Joint ECE-Eurostat Work Session on Demographic Projections.
4. Doty, Pamela (1986). Family care of the elderly: the role of public policy, Milbank Memorial
Fund Quarterly 64:34-75.
5. Freedman, Vicki A. (1996). Family structure and the risk of nursing home admission, Journal of
Gerontology B Psychological Science and Social Science 51:S61-9.
6. Fries, J.F., Green, L.W., and Levine, S. (1989). Health promotion and the compression of morbidity, The Lancet I: 481-483.
7. Grigsby J.S., and Olshansky S.J. (1989). The Demographic Components of Population Aging in China, Journal of Cross-Cultural Gerontology 4: 307-34.
8. Guralnik, J.M., Yanagishita, M., and Schneider, E.L. (1988). Projecting the older population of the United States: Lessons from the past and prospects for the future, Milbank Memorial Fund
Quarterly 66:283-308.
9. Cutler, David M. and Ellen Meara (1999). The Concentration of Medical Spending: An Update.
10.Himes, Christine L. (1992). Future Caregivers: Projected Family Structures of Older Persons,
Journal of Gerontology: Social Sciences 47: S17-26.
11.James W. Vaupel and Zeng Yi, (1991). Population Tradeoffs in China, Policy Sciences 24: 389-406.
12.Kannisto, V., J. Lauritsen, A. R. Thatcher, J. W. Vaupel (1994). Reductions in mortality at advanced ages: several decades of evidence from 27 countries, Population and Development
Review 20: 793-810.
13.Kinsella, Kevin G. (1988). Aging in the third world. CIR Staff Paper, No. 35, Feb 1988. ix, 80 pp. U.S. Bureau of the Census, Center for International Research, Africa and Latin America Branch: Washington, D.C.
14.Kinsella, Kevin and Suzman, Richard (1992). Demographic dimensions of population aging in developing countries, American Journal of Human Biology 4: 3-8.
15.Land, K.C. and A. Rogers, eds. (1982). Multidimensional Mathematical Demography. New York: Academic Press.
16.Lee, R.D. and L. Carter (1992). Modeling and forecasting the time series of U.S. mortality.
Journal of the American Statistical Association, 76.
17.Liang, Jersey, Edward Jow-Ching, Tu and Xiangming Chen (1986). Population aging in the People’s Republic of China, Social Science and Medicine 23: 1353-1362.
18.Liang, Jersey, Shengzu, Gu, and Neal, Krause (1992). Social Support Among the Aged in Wuhan, China, Asia-Pacific Population Journal 7: 33-62.
19.Lin, Jiang (1995). Changing Kinship Structure and Its Implications for Old-age Support in Urban and Rural China, Population Studies 49: 127-45.
20.Ma Xia (1988). Criterion for urban-rural classification and the level of urban development,
21.Manton, K.G., Stallard, E., and Tolley, H.D. (1991). Limits to human life expectancy: Evidence, prospects, and implications, Population and Development Review 17: 603-637.
22.Martin, Linda G. and Kinsella, Kevin (1994). Research on the demography of aging in developing countries, pp. 356-403, in: Linda G. Martin and Samuel H. Preston (eds.),
Demography of aging. Washington, D.C.: National Academy Press.
23.Mayer, George C., Barbara Boyle Torrey, and Kevin G. Kineslla (1992). The paradox of the oldest old in the United States: an international comparison, pp. 58-85, In: Suzman, Richard M., David P. Willis and Kenneth G. Manton (eds.), The Oldest Old. Oxford: Oxford University Press.
24.Nusberg, C. (1987). Aging China – Policies in Transition, Aging International. Winter 19.
25.Ogawa, Naohiro (1988). Aging in China: Demographic Alternatives, Asia-Pacific Population
Journal 3: 21-64.
26.Olshansky, S.J., Carnes, B.A., and Cassel, C. (1990). In search of Methuselah: Estimating the upper limits of human longevity, Science 250: 634-640.
27.Population Division, United Nations (1998). Extending population projections to age 100. Statement prepared by the Population Division, U.N., ACC Subcommittee on Demographic Estimates and Projections (ACC/SCDEP), Twentieth session, 23-25 June 1998. New York: United Nations.
28.Population Division, United Nations (1999a). World Population Prospects. The 1998 Revision
Volume I: Comprehensive Tables. New York: United Nations.
29.Population Division, United Nations (1999b). World Population Prospects. The 1998 Revision
Volume II: Sex and Age. New York: United Nations.
31.Rogers, A. (1975). Introduction to Multi-regional Mathematical Demography. New York: John Wiley & Sons.
32.Rogers, Andrei, and Frans Willekens, eds. (1986). Migration and Settlement: A Multiregional
Comparative Study. Dordrecht, Netherlands: D. Reidel.
33.Schneekloth, U./ Potthoff, P./ Piekara, R./Rosenbladt, B.v., Schriftenreihe des Bundesministerium für Familie, Senioren, Frauen und Jugend. (1996). Hilfe- und Pflegebedürftige in privaten Haushalten, Endbericht; Bericht zur Repräsentativerhebung im Forschungsprojekt "Möglichkeiten und Grenzen selbständiger Lebensführung". Editor: Bundesministerium für Familie, Senioren, Frauen und Jugend by: Volume 111.2. Verlag W. Kohlhammer. Stuttgart/Berlin/Köln.
34.Schoen, R. (1988). Modelling Multi-group Population. New York: Plenum Press.
35.Soldo, B. J., D.A. Wolf, and E.M. Agree (1990). Family, households, and care arrangements of the frail elderly: A structural analysis, Journal of Gerontology: Social Sciences 45:S238-S249.
36.SSB (State Statistical Bureau of China) (1998). 1997 National Population Sampling Survey
Data. Beijing: Statistical Press of China.
37.Stallard, Eric (1999). Retirement and health: estimates and projections of acute and long-term care needs and expenditures of the U.S. elderly population. Paper presented at the Society of Actuaries’ Retirement Needs Framework Conference, Dec. 10-11, 1998, Orlando, Florida.
38.Suzman, R.M., K. G. Manton, and D.P. Willis (1992). Introducing the oldest old in: R.M. Suzman, D. P. Willis, and K. G. Manton (eds.), The Oldest Old. New York: Oxford University Press.
39.Tu, Edward Jow-Ching, Jersey Liang and Shaomin Li (1989). Mortality decline and Chinese family structure: Implications for old age support, Journal of Gerontology 44: 157-168.
40.Vaupel, J.W., and Gowan, A.E. (1986). Passage to Methuselah: Some demographic consequences of continued progress against mortality, American Journal of Public Health
41.Vaupel, J. W. and Zeng Yi. (1991) Population Tradeoffs in China. Policy Sciences, 24: 389-406.
42.Vaupel, James W. and Hans Lundstrom (1994). The future of mortality at older ages in
developed countries, pp. 295- 315, in: Wolfgang Lutz (ed.). The Future Population of the World:
What Can We Assume Today? London: Earthscan Publications.
43.Vaupel, J. W., J.R. Carey, K. Christensen, T.E. Johnson, A.I. Yashin, N.V. Holm, I.A. Iachine, V. Kannisto, A.A. Khazaeli, P. Liedo, V.D.Longo, Y. Zeng, K.G. Manton, and James W. Curtsinger (1998). Biodemographic trajectories of longevity, Science 280: 855-860.
44.Wade, A. (1989), Social Security Area Population Projections: 1989, Actuarial Study No. 105, Washington DC: Office of the Actuary, Social Security Administration.
45.Wolf, D. A. (1994). The elderly and their kin: patterns of availability and access. In: Linda G. Martin and Samuel H. Preston (eds.). Demography of Aging. Washington D.C.: National Academy Press. pp. 146-194.
46.Zeng Yi (1989). Aging of the Chinese population and the policy issues: lessons learned from a rural-urban dynamic projection model. Selected paper for publication in the IUSSP (International Union for Scientific Studies of Population) 21nd General Conference Volumes, pp. 81-101, Liege: IUSSP.
47.Zeng Yi and J. Vaupel (1989). Impact of urbanization and delayed childbearing on population growth and aging in China, Population and Development Review 15: 425-445.
48.Zeng Yi, Li Wei, and Liang Zhiwu (1992). The status, Regional Differences, and trend of Chinese family structure, Chinese Journal of Population Science 4: 263-284, published in U.S.A. by Allerton Press, Inc..
49.Zeng Yi, Tu Ping, Gu Baochang, Xu Yi, Li Bohua and Li Youngping (1993). An analysis on causes and implications of recent increase in sex ratio at births in China, Population and
Development Review 19: 283-302.
51.Zeng Yi, James W. Vaupel and Wang Zhenglian (1995). A Multidimensional model for projecting family households -- with an illustrative numerical application. Population Studies of
Aging # 17, Center for Health and Social Policy, Odense University.
52.Zeng Yi (1995). China’s agenda for an old-age insurance program in rural areas, Journal of
Aging & Social Policy 6: 101 - 114.
53.Zeng Yi (1996). Is fertility in China at beginning of 1990s far below the replacement level?
Population Studies 50: 27-34.
54.Zeng Yi (1997). Dilemmas of family size norms in China. Proceedings of International Population Conference. Selected paper for publication in the IUSSP (International Union for Scientific Studies of Population) 23nd General Conference Volumes, pp. 1405-1418, Liege: IUSSP.
55.Zeng Yi, James W. Vaupel and Wang Zhenglian (1997). “A Multidimensional model for projecting family households -- with an illustrative numerical application.” Mathematical
Population Studies 6: 187-216.
56.Zeng Yi, James W. Vaupel and Wang Zhenglian (1998). “Household projection using conventional demographic data.” Population and Development Review, Supplementary issue of Vol. 24 “Frontiers of Population Forecasting”.
57.Zeng Yi and Wu Deqing (2000). Regional Analysis of Divorce in China since 1980.
Demography 37(2).
Notes
1. The medium fertility assumes that the rural total fertility rate would gradually decrease from 2.65 observed in late 1980s to 2.23 in 2000, and reach the replacement level of 2.15 by the middle of the next century. The urban sector would have a total fertility rate of 1.64 in year 2000 and become 1.70 in 2050 [47]. These assumptions made by us 10 years ago seem quite plausible based on today’s information. The latest official figure of Chinese TFR in 1998 is 1.84 (People’s Daily, Oct. 12, 1999). But we believe that it contains substantial underestimation. Our estimates are that current TFR in rural areas is about 2.2, and the urban TFR is about 1.6 (see [53], for a detailed discussion). We estimated that the weighted average of TFR for whole China is about 2.0 today (with an estimated 60% and 40% rural and urban population respectively). As stated above, we assumed that TFR in rural and urban areas of China in 2050 would be 2.15 and 1.7 respectively. The weighted average for the whole country would be 1.8 in 2050 (with assumed weights of 20% and 80% of rural and urban sectors respectively).
2. These projected figures are all under the medium fertility assumption, which assumes that rural fertility will gradually reach the level of replacement by the middle of next century, and the urban sector will have a total fertility rate of 1.7 in year 2000 and remain constant afterwards.
Life expectancies at birth under the medium and low mortality assumptions are listed below:
Medium mortality Low mortality
Year
Male female Both sexes Male female Both sexes
2000 Rural 69.0 72.0 70.5 71.0 74.0 72.5
Urban 72.0 76.0 74.0 74.0 78.0 76.0
Total 70.5 74.0 72.3 72.5 76.0 74.3
2050 Rural 75.0 77.5 76.3 79.4 85.6 82.5
Urban 78.0 81.0 79.5 81.9 89.1 85.5
3. Given the evidence that urbanization is underway and the likelihood that substantial rural-urban fertility differences will persist, the model developed by Zeng and Vaupel [47] incorporates the
dis-aggregation of the population according to the rural-urban dichotomy and a net migration flow from rural to urban areas by single year of age. The dynamics of the model are based on the
calculation procedures of multiregional population projection [31; 32; 34; 15). The U.N. 1998 revision follows a classical approach of population projection with 5-year age classification without consideration of rural-urban differentials and dynamics [28; 29].
4. The United Nations 1998 projections do not include low mortality variant for China and any other countries, so that no comparisons under the low mortality assumption between our and UN’s projections for China and between China and other countries are available.
5. The U.N. Population Division did not make population projections classified by rural and urban sectors. We, therefore, are not able to make comparison to the U.N. projection for the rural-urban differentials of population aging.
6. The 1998 healthy longevity survey was conducted in 22 provinces: Liaoning, Jilin, Heilongjiang, Hebei, Beijing, Tianjing, Shanxi, Shaanxi, Shanghai, Jiangsu, Zhejiang, Anhui, Fujian, Jiangxi, Shangdong, Henan, Hubei, Hunan, Guangdong, Guangxi, Sichuan, Chongqing, covering 985 million people, 85.3 percent of the total population in China. The survey interviewed 9,073 oldest old individuals age 80 and above (see, [58], for a more detailed description of the survey and the data quality evaluation).
8. It is almost impossible to compare the rural and urban differentials between 1990 and 1982, due to large changes in the rural-urban administrative boundaries in 1990, which included substantial
portion of rural people into the urban boundary and did not reflect the truth of urbanization [20].
9. Crude divorce rates were more than doubled between 1982 and 1995, and there is no doubt that
Table 1:
International comparison of indicators of population aging
percent of elderly aged 65+ Number of elderly persons (million)
1990 2030 2050 aged 65+
1990
aged 65+
2050
aged 80+
1990
aged 80+
2050
China 5.6 15.7 22.6 63.0 334.0 7.839 99.602
India 4.3 9.7 15.1 37.0 230.9 4.017 46.999
Korea 5.0 18.1 24.7 2.1 12.6 0.276 3.763
Mexico 4.0 19.9 18.6 3.3 27.3 0.644 5.979
Canada 11.2 22.6 23.8 3.1 10.1 0.643 3.759
France 14.0 23.2 25.5 7.9 15.3 2.136 5.696
Germany 15.0 26.1 28.4 11.9 20.8 2.985 8.299
Italy 15.3 29.1 34.9 8.7 14.4 1.963 5.787
Japan 12.0 27.3 31.8 14.8 33.4 2.922 12.09
U.K. 15.7 23.1 24.9 8.1 14.1 2.092 5.287
U.S.A. 12.4 20.6 21.7 31.5 75.8 7.213 26.914
Table 2:
Age distribution among elderly persons aged 65+ in China
Projection using the model developed
by Zeng and Vaupel
Projection by U.N. population Division
Age 1990 2000 2020 2040 2050 2000 2020 2040 2050
65-74 # 44.4 62.1 111.3 188.0 150.1 60.2 114.3 194.3 158.7
% 70.5 66.3 65.8 59.2 45.4 68.8 68.4 60.5 47.6
75-84 # 16.3 26.4 44.0 96.5 131.6 23.6 42.3 97.8 132.6
% 25.9 28.2 26.0 30.4 39.8 27.0 25.3 30.5 39.7
85+ # 2.3 5.2 13.9 33.0 48.9 3.7 10.5 29.0 42.3
% 3.7 5.5 8.2 10.4 14.8 4.2 6.3 9.0 12.7
80+ # 7.7 13.1 32.2 76.1 114.4 11.5 26.6 64.3 99.6
% 12.2 14.0 19.0 24.0 34.6 13.2 15.9 20.0 29.9
75+ # 18.6 31.6 57.9 129.5 180.5 27.3 52.9 126.8 174.9
% 29.5 33.7 34.2 40.8 54.6 31.2 31.6 39.5 52.4
65+ # 63.0 93.7 169.2 317.5 330.6 87.5 167.2 321.1 333.6
% 100.0 100.0 100.0 100.0 100.0 100.0 100.0 100.0 100.0
Sources:
(1) Projections using the model developed by Zeng and Vaupel (1989) are quoted from Zeng (1994:77)
Table 3:
Percentage Distribution of Living Arrangements of Elderly in China (All 30 provinces), 1990,
Comparison between Rural and Urban Areas
Alone Spouse Living with spouse and child/grandchild or others No spouse, living with child/grandchild or others Institution Total Child Grandchild child &
grandchild
others only subtotal Child grandchild child & grandchild
others only Subtotal % # Ages 65-79
Males Rural 8.3 20.8 16.6 1.2 24.9 0.2 42.9 4.2 0.4 22.4 0.2 27.2 0.8 100 205269 Urban 7.1 23.9 15.8 3.6 26.1 0.5 46.0 3.7 0.9 15.8 0.4 20.8 2.1 100 69595 Total 8.0 21.6 16.4 1.8 25.2 0.3 43.7 4.1 0.5 20.7 0.3 25.6 1.1 100 274864 Females Rural 9.9 15.1 5.4 0.8 16.2 0.1 22.6 7.8 0.6 43.9 0.1 52.3 0.2 100 237923 Urban 11.4 15.5 5.1 2.5 15.0 0.3 22.8 6.6 2.5 40.1 0.4 49.7 0.7 100 75686 Total 10.2 15.2 5.3 1.2 15.9 0.2 22.6 7.5 1.0 42.9 0.1 51.6 0.3 100 313609 Ages 80-89
Males Rural 13.8 15.3 4.0 0.5 15.7 0.1 20.3 5.8 0.6 43.1 0.2 49.7 0.9 100 20227 Urban 11.4 18.0 4.4 2.9 16.7 0.3 24.3 6.2 2.0 35.4 0.6 44.2 2.0 100 6966 Total 13.2 16.0 4.1 1.1 16.0 0.2 21.3 5.9 1.0 41.1 0.3 48.3 1.2 100 27193 Females Rural 15.5 4.1 0.7 0.1 3.5 0.0 4.4 11.1 0.6 63.8 0.1 75.6 0.4 100 36334 Urban 14.2 3.8 0.6 0.6 3.0 0.0 4.2 11.6 3.4 61.1 0.5 76.6 1.3 100 12543 Total 15.2 4.0 0.7 0.2 3.4 0.0 4.3 11.3 1.3 63.1 0.2 75.8 0.7 100 48877 Ages 90+
Males Rural 13.5 8.6 4.4 0.9 9.8 0.0 15.1 8.6 1.2 51.4 0.1 61.3 1.5 100 777 Urban 12.3 6.7 2.5 1.7 10.1 0.0 14.3 10.4 2.5 50.7 0.3 63.9 2.8 100 357 Total 13.1 8.0 3.8 1.1 9.9 0.0 14.8 9.2 1.6 51.1 0.2 62.1 1.9 100 1134 Females Rural 18.2 0.4 0.2 0.0 0.7 0.0 0.8 16.1 0.5 63.4 0.1 80.1 0.5 100 2261 Urban 10.8 0.8 0.0 0.0 0.9 0.0 0.9 20.0 3.3 61.6 0.3 85.2 2.4 100 1011 Total 15.9 0.5 0.1 0.0 0.7 0.0 0.9 17.3 1.3 62.8 0.2 81.7 1.1 100 3272 Ages 80+
Males Rural 13.8 15.0 4.0 0.5 15.5 0.1 20.1 5.9 0.6 43.4 0.2 50.1 0.9 100 21004 Urban 11.5 17.5 4.3 2.8 16.4 0.3 23.8 6.4 2.0 36.1 0.6 45.2 2.0 100 7323 Total 13.2 15.7 4.1 1.1 15.7 0.1 21.1 6.0 1.0 41.5 0.3 48.9 1.2 100 28327 Females Rural 15.7 3.9 0.7 0.1 3.4 0.0 4.2 11.4 0.6 63.8 0.1 75.8 0.5 100 38595 Urban 13.9 3.6 0.6 0.5 2.8 0.0 3.9 12.2 3.4 61.2 0.5 77.2 1.4 100 13554 Total 15.2 3.8 0.6 0.2 3.2 0.0 4.1 11.6 1.3 63.1 0.2 76.2 0.7 100 52149 Ages 65+
Table 4:
Percentage Distribution of Living Arrangements of Elderly in China (All 30 provinces), Rural and Urban Areas Combined,
Comparison between 1990 and 1982
Alone spouse Living with spouse and child/grandchild or others No spouse, living with child/grandchild or others Institution Total Child Grandchild child &
grandchild others
only
subtotal Child grandchild child & grandchild
others only
Subtotal % #
Ages 65-79
Males 1990 8.0 21.6 16.4 1.8 25.2 0.3 43.7 4.1 0.5 20.7 0.3 25.6 1.1 100 274864 1982 10.5 17.5 19.2 1.7 21.7 0.4 43.0 5.2 0.6 21.2 0.5 27.5 1.5 100 186530 Females 1990 10.2 15.2 5.3 1.2 15.9 0.2 22.6 7.5 1.0 42.9 0.1 51.6 0.3 100 313609 1982 13.1 11.9 5.0 1.1 12.2 0.3 18.5 9.2 1.3 45.5 0.3 56.2 0.3 100 226812 Ages 80-89
Males 1990 13.2 16.0 4.1 1.1 16.0 0.2 21.3 5.9 1.0 41.1 0.3 48.3 1.2 100 27193 1982 16.5 14.2 4.7 1.4 14.1 0.4 20.4 4.7 1.2 41.2 0.5 47.6 1.2 100 15584 Females 1990 15.2 4.0 0.7 0.2 3.4 0.0 4.3 11.3 1.3 63.1 0.2 75.8 0.7 100 48877 1982 18.5 3.0 0.4 0.2 2.5 0.1 3.2 8.5 1.6 64.5 0.4 75.0 0.3 100 29653 Ages 90+
Males 1990 13.1 8.0 3.8 1.1 9.9 0.0 14.8 9.2 1.6 51.1 0.2 62.1 1.9 100 1134 1982 16.5 8.7 6.3 3.3 7.1 0.5 17.1 6.9 0.8 47.8 0.6 56.1 1.5 100 665 Females 1990 15.9 0.5 0.1 0.0 0.7 0.0 0.9 17.3 1.3 62.8 0.2 81.7 1.1 100 3272 1982 20.2 0.7 0.1 0.1 0.6 0.0 0.8 13.0 1.9 62.6 0.2 77.7 0.5 100 1767 Ages 80+
Males 1990 13.2 15.7 4.1 1.1 15.7 0.1 21.1 6.0 1.0 41.5 0.3 48.9 1.2 100 28327 1982 16.5 14.0 4.7 1.4 13.8 0.4 20.3 4.8 1.2 41.4 0.5 48.0 1.2 100 16249 Females 1990 15.2 3.8 0.6 0.2 3.2 0.0 4.1 11.6 1.3 63.1 0.2 76.2 0.7 100 52149 1982 18.6 2.9 0.4 0.2 2.4 0.0 3.1 8.8 1.6 64.3 0.3 75.1 0.3 100 31420 Ages 65+
Figure 1:
International comparison of average annual increase rates (%) of elderly populations
4.24
4.01
4.35
3.71
2.94
1.63 1.7 1.8
2.37 1.55 2.19 2.1 2.7 2.6 1.3 1 1.1 1.4 1.6 0.8 0.9 2.3 0.0 0.5 1.0 1.5 2.0 2.5 3.0 3.5 4.0 4.5 5.0 Chin a Indi a Kore a Mexi co Cana da Fra nce Germa
ny Italy Jap an U.K . U.S .A. %
Figure 2:
Living arrangements of elderly persons in 1990, comparison between rural and urban areas
Rural Urban
Males, 65-79 Males, 80-89 Males-90+
Females, 65-79 Females, 80-89 Females-90+
A : Alone;
S: Spouse only;
C: Combination of with children and spouse, with children only, and with other relatives or non-relatives only;
I: Institution; 0
20 40 60 80 100
A S C I A S C I A S C I
0 20 40 60 80 100
Figure 3:
Living arrangements of elderly persons, rural and urban areas combined, comparison between 1990
and 1982
1990 1982
Males, 65-79 Males, 80-89 Males, 90+
Females, 65-79 Females, 80-89 Females, 90+
A : Alone;
S: Spouse only;
C: Combination of with children and spouse, with children only, and with other relatives or non-relatives only;
I: Institution; 0
20 40 60 80 100
A S C I A S C I A S C I
0 20 40 60 80 100
Figure 4:
Percent of elderly aged 65+among total population by types of living arrangement, under the same
assumption of fertility, marriage, divorce, and propensity of co-residence between parents and married children, but different mortality 1
Rural
Urban
1 Notes: M: Medium mortality scenario; L: Low mortality scenario; w. children & others: living with children and
others; w. spouse only: living with spouse only; institution: living in collective household or nursing house etc.
0 5 10 15 20 25 30 35
M L M L M L M L M L M L
1990 2000 2010 2020 2030 2040 2050
per
cent
institution
w. children & others w. spouse only living alone 0 5 10 15 20 25 30 35
M L M L M L M L M L M L
1990 2000 2010 2020 2030 2040 2050
per
cent
institution
Figure 5:
Percent of elderly aged 85+among total population by types of living arrangement, under the same
assumption of fertility, marriage, divorce, and propensity of co-residence between parents and married children, but different mortality 2
Rural
Urban
2
Same as the note in Figure 4
0 1 2 3 4 5 6 7 8
M L M L M L M L M L M L
1990 2000 2010 2020 2030 2040 2050
per
cent
institution
w. children & others w. spouse only living alone 0 1 2 3 4 5 6 7 8
M L M L M L M L M L M L
1990 2000 2010 2020 2030 2040 2050
per
cent
institution