FE-Modeling of Cold Rolling by In-Feed Method
of Circular Grooves
Niţu, E. – Iordache, M. – Marincei, L. – Charpentier, I. – Le Coz, G. – Ferron, G. – Ungureanu, I. Eduard Niţu1,* – Monica Iordache1 – Luminiţa Marincei1 – Isabelle Charpentier2 –
Gaël Le Coz3 – Gérard Ferron2– Ion Ungureanu1 1 University of Piteşti, Romania
2 LEM3, University Paul Verlaine-Metz, France 3 LEM3, ParisTech-Metz, France
The methods of cold rolling of rods are widely used in manufacturing industries to obtain pieces with complex profiles. In this study, complex profiles with grooves have been formed by in-feed methods using two rolls. An experimental system was constructed to record the process parameters. The micro-hardness has been measured by the Vickers method in an axial section of the rolled piece. The process has also been simulated by means of finite element calculations using the Abaqus/Explicit code. The material behavior is described by using a 5-parameter strain-hardening law and by accounting for thermal effects at high strain-rates. Finally, a comparison is made between experimental and simulated results.
©2011 Journal of Mechanical Engineering. All rights reserved.
Keywords: groove profile, cold rolling, micro-hardness, finite element modeling
0 INTRODUCTION
The advantages of cold rolling, including
high productivity, substantial improvement in
mechanical properties and low roughness [1] and [2], are clearly apparent in the case of profiled surfaces, such as: threads, grooves, teeth, parts
that can be found in various products of the
automotive industry, aeronautics, appliances, etc.
An important objective of the deformation
processing of metals and alloys is the production of defect-free parts, with the desired microstructure
and properties. This goal can be achieved by
improving the design, calculation methods and control of process parameters.
In recent years, finite elements (FE) models have been widely used to analyze a number of metal-forming processes [3] to [5]. The accumulated knowledge enabled the forming
industry to improve product performance, service life and process competitiveness [6].
The FE modeling of cold rolling uses
numerical models of the elements involved in the
working process (blank material and tools), with
the aim of computing the evolution of different quantities during the process: stresses and strains, material flow paths, and the final profile of the
product. The FE modeling of the cold rolling process started in 1990 [1] and [7], but the
high volume of calculations and the computers incapacity to simulate the process within a
reasonable time, restricted these studies to the
understanding of the deformation process [6] to
[8], by analyzing the state of stresses and strains of
circular profiles at different levels of deformation. The research intensified in 2000, together with the
development of efficient FE software and with
the growing computational capacity of computers [8] to [10]. The main elements of interest in these research works are the material of the work-piece, piece profile and rolling process, with particular
attention to the plastic behavior of the material,
the meshing elements and the software used for
simulations (MARC, ABAQUS, DEFORM, MSC Super Form ...).
The strain-hardening laws most frequently used for the analysis and simulation of large plastic deformations at room temperature are Hollomon,
Ludwik, Ludwik-Hartley and Voce [11]. However, cold rolling processes are affected by the effects of
high-speed processing and associated temperature
rise, because heat generated by plastic deformation does not have enough time to be evacuated by convection through the surface and by conduction
to the connecting parts. These strain-rate and
temperature effects are often described using the
In this study, a complex profile with five
grooves has been formed by in-feed method using
two rolls. This paper focuses on the development
of three-dimensional FE models using the stress-strain law characterized in compression tests and
an optimal mesh of the work-piece in order to
obtain accurate results with a reasonable number of elements and an acceptable computation time.
The validation results are based on forces
and micro-hardness measurements. The measured force is the radial force. The experimental micro-hardness is measured on the axial section of
the tooth by Vickers method and the process is simulated using the Abaqus/Explicit FE code.
1 EXPERIMENTAL PROCEDURE
Threads are formed by the progressive
penetration of a set of parallel wedge-shaped
indentors into the blank surface during a fixed number of blank revolutions. The predominant
loading modes are plane-strain compression and shear in the external part of the work-piece. The
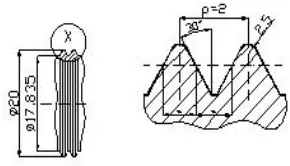
profile generated by radial cold rolling using
two rolls and in-feed method was a concentric channels surface (five grooves similar in axial
section to metric thread M20×2, Fig. 1).
Fig. 1. Form of the cold rolling profile
The material used in this investigation was AISI 1015 steel. Its chemical composition and
initial micro-hardness are given in Table 1. The blank was obtained from a hot extruded bar by
turning and grinding.
Micro-hardness measurements were made
by Vickers method, which allows the use small
loads and a comparison of the results with other mechanical quantities. The load was taken equal to 300 g, in order to take account of estimated
micro-hardness and of grain size.
The piece was cut by electric discharge
machining and then finely polished for the measurement of the micro-hardness in the axial section of the tooth. The micro-hardness indentations were performed on several lines
along the axial and radial directions, Fig. 2. For each direction the distance between indentations
was 0.125 mm and the minimum distance from the surface of the piece was 0.1 mm.
Fig. 2. Schema of micro-hardness indentations
An experimental system, Fig. 3, was used
to record the process parameters: in-feed of the rolls, force along the radial direction and tools rotation.
2 STRESS-STRAIN BEHAVIOR
The compression test was adopted to
characterize the stress-strain behavior of the
material, since (1) it allows us to reach high strain levels (up to an effective strain ε ≈0 9. in our tests) and (2) the stress state generated during the cold rolling process is mostly compressive.
Considering the high speed of the rolling
process, it is interesting to characterize material behavior at high strain-rates. The compression
tests were performed at the speeds of 1.8 mm/
min (low speed test, LST) and 180 mm/min (high
speed test, HST). They correspond to nominal strain-rates of 10-3 and 10-1 s-1, respectively.
The stress-strain curve for the HST is at first slightly higher, and then it progressively
becomes lower than in the LST. This can be interpreted by considering that (1) the effect
becomes significantly higher in the HST, which is contributed to a decrease in the flow stress.
The LST is assumed to be isothermal,
while strain-rate and temperature sensitivity
effects should be taken into account for the HST.
Strain-hardening laws involving only three
parameters are not able to give a good account of the stress-strain curve in the LST over the whole
range up to ε ≈0 9.
.
A five-parameter law which combines Hollomon and Voce’s laws was chosenand the hardening law in the form was expressed:
σLS =Kεn+S −A −Bε
(1 exp( )) , (1)
where K, n, S, A and B are material parameters.
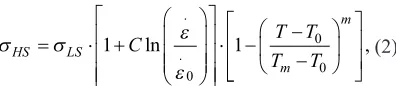
The stress-strain curve in the HST is described by
introducing strain-rate and temperature sensitivity terms in agreement with the Johnson-Cook’s law, i.e.: σ σ ε ε HS LS m m
C T T
T T = ⋅ + ⋅ − − − 1 1 0 0 0 ln . . , (2)
where C and m are strain-rate and temperature sensitivity coefficients, respectively, ε0 = 10-3 s-1 is the reference strain-rate of the LST, ε = 10-1
s-1 is the strain-rate of the HST, T0 = 300 K is
the reference (room) temperature, Tm= 1810 K is the melting temperature and T is the current temperature.
Under adiabatic conditions, the increase in
temperature corresponds to a fraction β of the
plastic work that converts into heat. Under these conditions, the rate of temperature rise T is
obtained with the Eq.:
βσε=c Tρ, (3)
where β is the Taylor-Quinney coefficient,
generally taken equal to 0.9; C = 0.460 J/gK is the specific heat capacity and ρ = 7.8 × 10⁶ g/m3 is the
specific mass.
The identification of the five strain-hardening parameters, Eq. (1), is first performed by fitting the LST data with a gradient method implemented in a FORTRAN program. The following is obtained: K = 542.5 MPa; n = 0.135; S = 217.6 MPa; A = 0.99 and B = 9.91. Then, the
HST data are analyzed by considering that the
actual temperature rise (T – T0) is a fraction η of the value calculated under adiabatic conditions with Eq. (3). Again, the FORTRAN program is
used to determine the remaining parameters. The
following has been found: η = 0.7; C = 0.0125 and m = 0.78.
The experimental stress-strain curves in
compression for the LST and HST are shown in Fig. 4, together with the fit obtained with Eqs. (1) and (2), respectively. The fitted curves are extrapolated
up to the value ε ≈4
,
which corresponds to the strain levels attained in the cold rolling process. As a result of the assumed continuous increase intemperature, the extrapolated HST curve exhibits a
marked decrease at high strains.
Table 1. Chemical composition and initial micro-hardness of the steel AISI 1015
Chemical composition [wt %] Micro-hardness (average) Vickers 300 g
C Mn Cr Si Ni Mo P, S
0.15 0.65 0.11 0.27 0.08 0.01 < 0.035 1360 MPa
Fig. 4. Experimental and extrapolated real stress-strain curves in compression
3 METALLOGRAPHIC CHARACTERIZATION
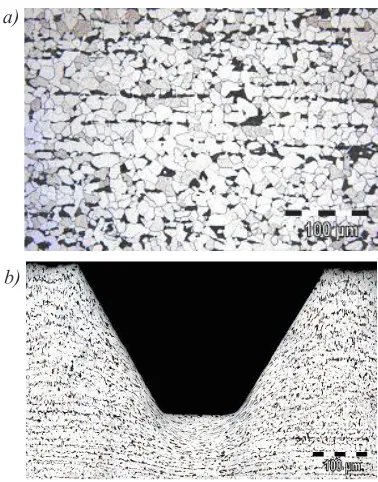
A metallographic examination was
performed on a sample piece from the bar stock (undeformed material, Fig. 5a) and on a cold rolled piece, Fig. 5b. The pieces were cut along the axial direction by electric discharge machining,
finely polished and 2% Nital etched. The micro-harness in the centre of cut specimens was found
to be very close to that measured on the surface of
the undeformed material (mean value 1360 MPa). Micrographs show that deformation is concentrated in the superficial layers, especially on the root and on the flanks of the tooth, with
somewhat less stretching in the tooth interior (Fig. 5b).
4 NUMERICAL PROCEDURE
The numerical calculations were performed
with the dynamic explicit FE code Abaqus/
Explicit.
The elastic behavior of the work-piece is modeled by assuming isotropic elasticity, with
the values of Young’s modulus, E = 200,000 MPa and Poisson’s ratio, ν = 0.3. Strain-hardening is
described using the von Mises criterion with the
assumption of isotropic hardening. Accordingly,
the yield function is given by:
f = 32s sij ij −σ, (4)
where sij are the deviatoric stress components, 3 2/
(
)
s sij ij is the von Mises equivalent stress and σ is the current yield stress.a)
b)
Fig. 5. Microstructure; a) of the undeformed material, and b) of the cold-rolled profile
The laws obtained in the LST and HST, section 2, are used as two possibilities to describe
the effective stress-strain law in numerical simulations, assuming that their extrapolation to the entire strain range that develops during the rolling process is valid.
Based on the microstructural observations, section 3, a dense mesh must be used in the deformation zone near the blank surface and a much coarser mesh can be applied in the blank interior. The best compromise that could be found between the number of elements and accuracy of results is presented in Fig. 6:
• along the axial direction, three areas are
defined, Fig. 6a:
• area A, with very small deformations,
where the size of elements can be very
large;
• area B1, corresponding to the root of the profile with the largest deformations is very finely meshed;
• area B2, corresponding to the flank of the profile with large deformations is finely meshed;
• area C, corresponding to the crest of the profile, has moderate deformations and
• along the radial direction, two areas are
defined, Fig. 6b:
• area D, associated to the superficially
deformed layer, where the size of elements has to be small;
• area E, corresponding to the core, has
small deformations and the size of elements can be very large.
In areas A, B, C and D we used C3D8R,
8-nodes solid hexahedral elements with reduced
integration, while area E was meshed with C3D4R,
4-nodes solid tetrahedral elements with reduced integration. The dimensions of the elements in
the five above-defined areas were established in
relation with the main characteristic of the profile, step p between adjacent grooves. The dimensions
of elements in the different areas are indicated in
Table 2.
The tools are modeled by analytical rigid
surfaces. The strain-rate dependency is not handled in the simulations.
5 RESULTS AND DISCUSSION
A comparison between experiments and calculations has been made by considering the
evolution of radial force during cold rolling and
the distributions of micro-hardness HV in an axial
section of the piece.
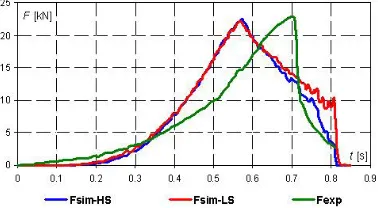
The experimental and simulated evolutions
of the radial force are presented in Fig. 7.
Fig. 7. Experimental and simulated radial forces
The two simulated radial forces have very similar evolutions and the value of the maximum force is very close to the experimental one. However, the evolution of the simulated radial force is somewhat different from the experimental evolution: the increase in radial force is more rapid, and the maximum is predicted earlier in the simulations.
The similarity between radial forces calculated with the LST and HST stress-strain
curves is fairly surprising. In fact, these two curves intercept at ε ≈0 3. , and the difference between Table 2. Dimensions of the finite elements
Dimension of the element (length × width), [mm]
Area A B1 Area B B2 Area C Area D
2 × 0.4
p × p/5 p/5 × p/1000.4 × 0.02 p/5 × p/500.4 × 0.04 0.4 × 0.08p/5 × p/25 p/5 × p/100.4 × 0.2
a)
b)
the two curves is less than 2% up to ε ≈0 7. (Fig.
4). Actually, only 10% of the volume of the work piece is deformed up to strain values larger than
ε ≈0 7. at the end of the rolling process. In other
words, only a thin superficial layer is concerned by very high strains, and most of the internal
energy expended during rolling corresponds to regions where the strain levels remain moderate. As a result, the evolution of the force is mainly
controlled by the stress-strain law at low and moderate strains. This analysis is corroborated by
similar experiments and calculations performed on other materials, where the radial forces are
observed to be dependent on the stress level obtained in compression, but independent of the
extrapolation adopted in the simulations.
Micro-hardness measurements were also
compared with yield stress values obtained by numerical simulations. For blank materials,
the Vickers micro-hardness HV is found to be
proportional to the initial yield stress σy, i.e. [13]: HV = α × σy , (5) where the proportionality factor α is close to 3.
For plastically deformed materials, σy in Eq. (5)
should be replaced by the current yield stress σ
in order to take account of strain-hardening.
The distributions of micro-hardness
HV measured in an axial section of the piece
are presented in Fig. 8a. The equivalent strains
(PEEQ) obtained in numerical simulations are presented on Figs. 8b and 8c with the hardening laws obtained in the LST and HST, respectively.
The values of micro-hardness HV are also indicated
in Fig. 8b, using the calculated σ - values and α
= 3 in Eq. (5). Indeed, this conversion would be unrealistic using the stress-values obtained in the
HST since these stresses correspond to the high temperatures attained during the rolling process, while micro-hardness measurements are made at room temperature.
In spite of a fairly large scatter in micro-hardness measurements, the comparison tends to shown a very good correlation, with the higher levels of HV and ε at the root of the profile, and
lower values in the central part of the tooth. The proportionality factor α between HV and σ is very close to 3 when σ is estimated at room temperature with the isothermal stress-strain
Fig. 8. Experimental micro-hardness in [MPa]; a) and equivalent strain distribution for the two numerical models, using the stress-strain laws; b) σLST , and c) σHST
a)
b)
law σLST. This α-value is in agreement with the usually reported in the literature.
6 CONCLUSIONS
FE simulations of the cold rolling process have been performed using an optimized FE
mesh and an extrapolation of the stress-strain law identified in compression tests. The results
demonstrate that valuable information can be obtained from FE simulations:
• the calculated radial force is in very good agreement with its experimental value,
• the calculated distribution of yield stress σ in the superficial layers of the piece is in good correspondence with measurements of Vickers micro-hardness HV, considering the usually-accepted value of the proportionality factor (α = 3) between these two quantities.
7 ACKNOWLEDGEMENTS
This work was supported by CNCSIS – UEFISCDI, project number PN II - IDEI 711/2008, ANCS project number PN II – CAPACITATI - Bilateral project “Brâncuşi” 211/2009 and the project “Supporting young PhD students with frequency by providing doctoral fellowships”, co-financed from the EUROPEAN SOCIAL FUND through the Sectoral Operational Program Development of Human Resources.
8 REFERENCES
[1] Neagu, C., Vlase, A., Marinescu, N.I. (1994). Volume cold pressing of the parts with thread and teeth. Technical Publishing House, Bucharest. (In Romanian)
[2] Ungureanu, I., Iacomi, D., Nitu, E.L. (2004).
Processing technologies of the profiles by cold forming, Design guide. University
of Piteşti Publishing House, Piteşti. (In Romanian)
[3] Leon, J., Luis, C.J., Luri, R., Reyero, J.
(2007). Determination of the neutral point in flat rolling processes. Strojniški vestnik -
Journal of Mechanical Engineering, vol. 53, no. 11, p. 747-754.
[4] Kamouneh, A.A., Ni, J., Stephenson. D.,
Vriesen. R. (2007). Investigation of work
hardening of flat-rolled helical-involute
gears through grain-flow analysis,
FE-modelling, and strain signature. International
Journal of Machine Tools & Manufacture, vol. 47, p. 1285-1291.
[5] Gantar, G., Sterzing, A. (2008). Robust design
of forming processes. Strojniški vestnik -
Journal of Mechanical Engineering, vol. 53, no. 4, p. 249-257.
[6] Domblesky, J.P., Feng, F. (2002).
Two-dimensional and three-Two-dimensional finite element models of external thread rolling.
Proceedings of the Institution of Mechanical
Engineers, Part B: Journal of Engineering
Manufacture, vol. 216, no. 4, p. 507-517. [7] Martin, J.A. (1998). Fundamental finite
element evaluation of a three dimensional rolled thread form: modeling and experimental results. Fatigue, Fracture and
Residual Stresses ASME, vol. 373, p. 457-467.
[8] Domblesky, J.P., Feng, F. (2002). A
parametric study of process parameters in external thread rolling. Journal of Materials
Processing Technology, vol. 121, p. 341-349.
[9] Kamouneh, A.A., Ni, J., Stephenson. D.,
Vriesen, R., DeGrace, G. (2007). Diagnosis
of involumetric issues in flat rolling of external helical gears through the use of finite-elements models. International
Journal of Machine Tools & Manufacture, vol. 47, p. 1257-1262.
[10] McCormack, C., Monaghan, L. (2001).
A finite element analysis of cold forging dies using 2D and 3D models. Journal of
Materials Processing Technology, vol. 118, p. 286-292.
[11] Hartley, C.S., Srinivasan, R. (1983).
Constitutive equations for large plastic deformation of metals. Journal Enginering
Materials Technology, vol. 105, p. 162-167. [12] Johnson, G.R., Cook, W.H. (1983). A
constitutive model and data for metals
subjected to large strains, high strain rates
and high temperature. Proceedings of the 7th International Symposium on Ballistics, La
Haye, p. 541-547.
[13] Tabor, D. (1951). The hardness and strength
![Fig. 8. Experimental micro-hardness in [MPa]; a) and equivalent strain distribution for the two numerical models, using the stress-strain laws; b) σLST , and c) σHST](https://thumb-us.123doks.com/thumbv2/123dok_us/8952037.1861405/6.586.76.507.424.673/experimental-hardness-equivalent-strain-distribution-numerical-models-stress.webp)
