165
Application of Taguchi Method for Surface Roughness and
Roundness Error in Drilling of AISI 316 Stainless Steel
Çiçek, A. - Kıvak, T. - Samtaş, G.Adem Çiçek1-Turgay Kıvak2,*- Gürcan Samtaş2
1 Düzce University, Faculty of Technology, Department of Manufacturing Engineering, Düzce, Turkey 2 Düzce University, Cumayeri Vocational School of Higher Education, Düzce, Turkey
In this study, the effects of deep cryogenic treatment and drilling parameters on surface roughness and roundness error were investigated in drilling of AISI 316 austenitic stainless steel with M35 HSS twist drills. In addition, optimal control factors for the hole quality were determined by using Taguchi technique. Two cutting tools, cutting speeds and feed rates were considered as control factors, and L8(23) orthogonal array was determined for experimental trials. Multiple regression analysis was employed to derive the predictive equations of the surface roughness and roundness error achieved via experimental design. Minimum surface roughness and roundness error were obtained with treated drills at 14 m/min cutting speed and 0.08 mm/rev feed rate. Confirmation experiments showed that Taguchi method precisely optimized the drilling parameters in drilling of stainless steel.
Keywords: cryogenic treatment, drilling, surface roughness, roundness error, Taguchi method
0 INTRODUCTION
To provide cost effectiveness in manufacturing and especially machining operations, there is a continuous need to reduce tooling costs. The most well-known methods used to reduce tooling costs are various applications of more resistant tool materials, heat treatments, cutting fluids, speed and feed rates, and the development of coated cutting tool [1]. One of these methods is the application of cryogenic treatment used in recent years. Over the past few years, there has been an increasing interest in the application of cryogenic treatment [2]. Cryogenic treatment has been an effective method in improving the tool life of different cutting tools (in particular HSS and cemented carbide) used in machining processes. There are many studies, which have proven significant increases in tool life after deep cryogenic treatment (from –125 to –196°C) in the literature. It was reported that deep cryogenic treatment increased tool life by 90 to 400% [3]. In addition, lower cutting forces and surface roughness were obtained with treated cutting tools. Cryogenic treatment not only improves the tool life, but also provides significant benefits for machining conditions [4].
The surface quality is an important parameter to evaluate the productivity of machine tools as well as machined components. Hence, achieving the desired surface quality is of great importance for the functional behavior of the mechanical parts [5]. A reasonably good surface finish is desired for improving the tribological properties, fatigue strength, corrosion resistance and aesthetic appeal of the product. Excessively better surface finish may involve more cost of manufacturing. The surface
roughness and roundness error are affected by several factors including cutting tool geometry, cutting speed, feed rate, the microstructure of the workpiece and the rigidity of the machine tool [6] and [7]. These parameters affecting the surface roughness and drilled hole qualities (roundness, cylindricality and hole diameter) can be optimized in various ways such as Taguchi method and multiple regression models. Therefore, a number of researchers have been focused on an appropriate prediction of surface roughness and roundness error [8] and [9].
of cutting parameters. Their works revealed that the Taguchi method was a powerful approach used in design of experiment. Davim and Reis [16] presented an approach using the Taguchi method and ANOVA to establish a correlation between cutting speed and feed rate with the delamination in a composite laminate. A statistical analysis of hole quality was performed by Furness et al. They found that feed rate and cutting speed have a relatively small effect on the measured hole quality features. With the expectation of hole location error, the hole quality was not predictably or significantly affected by the cutting conditions [17]. Tsao and Hocheng [18] performed the prediction and evaluation of thrust force and surface roughness in drilling of composite material. The approach used Taguchi and the artificial neural network methods. The experimental results show that the feed rate and the drill diameter are the most significant factors affecting the thrust force, while the feed rate and spindle speed contribute the most to the surface roughness. Zhang et al. [19] performed a study of the Taguchi design application to optimize surface quality in a CNC face milling operation. Taguchi design was successful in optimizing milling parameters for surface roughness. Nalbant et al. [20] utilized the Taguchi technique to determine the optimal cutting parameters for surface roughness in turning of AISI 1030 steel with TiN coated inserts. Three cutting parameters such as insert radius, feed rate, and depth of cut, are optimized for minimum surface roughness. Kurt et al. [21] employed the Taguchi method in the optimization of cutting parameters for surface finish and hole diameter accuracy in dry drilling processes. The validity of the Taguchi approach to process optimization was well established.
The objective of this study is to investigate the effects of different heat treatments applied to M35 HSS drills and the drilling parameters on surface roughness and roundness error, and is to determine the optimal drilling parameters using the Taguchi technique and multiple regression analysis in drilling of AISI 316 stainless steel.
1 EXPERIMENTAL METHODS
1.1 Drilling Experiments
In the present study, AISI 316 austenitic stainless steel blocks were used as workpiece material. The dimensions of a work piece were 100×170×15 mm. Chemical composition of AISI 316 stainless steel is shown in Table 1. Blind holes were drilled on stainless steel blocks. Before the drilling experiments,
the stainless steel blocks were ground to eliminate the adverse effects of any surface defect on the work piece. Three holes were drilled to compare the surface roughness (Ra) and roundness error (Re) measurements in each machining condition. The average of these measurements was used for evaluation. To provide the initial conditions of each experiment, a new drill was used. The drilling tests were performed using Johnford VMC 850 model three axes CNC vertical machine center equipped with a maximum spindle speed of 6.000 rpm and a 7.5 kW drive motor. They were performed at two different cutting speeds (12 and 14 m/min) and feed rates (0.08 and 0.1 mm/rev) while hole depth was kept constant at 13 mm.
Table 1. Chemical composition of AISI 316 austenitic stainless steel
C Si Mn P S Cr Ni Mo Cu
0.05 0.380 0.971 0.039 0.006 16.58 9.94 2.156 0.321
Distance to drill tip from the tool holder was determined as 30 mm for eliminating of the twisting effect. The surface roughness of the machined holes was measured using a Mitutoyo Surftest SJ-301 portable surface roughness tester, and the average roughness values (Ra) were evaluated. In order to measure the surface roughness, austenitic stainless steel blocks were sliced with wire EDM as parallel to hole axes. The roundness error measurements were performed using a Mitutoyo CRT-A C544 three dimensional coordinate measuring machine (CMM) device. Minimum 10 points were measured to obtain the ideal roundness error at a certain depth of the hole.
1.2 Cryogenic Treatment
A number of uncoated M35 HSS twist drills (Guhring) with a diameter of 6 mm were cryogenically treated in order to observe the effects of deep cryogenic treatment on surface roughness and roundness error. Chemical composition and properties of M35 HSS twist drills used in the experiments are given in Tables 2 and 3, respectively.
Table 2. Chemical composition of M35 drills
C Cr Co Mo W V
0.9 4.2 4.8 5.0 6.5 2.0
temperature for 24 h, then raising the temperature back to room temperature at the heating rate of 1.5 °C/ min to avoid thermal cracks.
Table 3. Properties of M35 drills
Tool material M35
Tool reference DIN 1897
Coating Uncoated
Diameter 6 mm
Point angle 118°
Helix angle 35°
2 EVALUATIONS OF EXPERIMENTAL RESULTS
During cryogenic treatment, the secondary carbides precipitate in the austenite matrix, promote the transformation of the retained austenite to martensite and consequently enhance hardness and wear resistance of the alloy [22]. In addition, it is reported in the literature that the cryogenic treatment relieves the residual stresses [23]. The main reasons affecting hole quality (surface roughness and roundness) in drilling process are the tool wear and cutting forces. With increasing tool wear and cutting forces, product quality is negatively affected. In this study, the hole quality significantly improved due to tool wear and cutting forces decreased after cryogenic treatment.
Surface roughness decreased with increasing cutting speed [24] and [25]. This event can be explained with the decreased built up edge (BUE) formation due to higher temperatures generated in the cutting zone depending on increasing cutting speed [26]. BUE which has unstable structure significantly influences the surface roughness. When BUE is large and unstable, the surface roughness increases and the surface quality of workpiece is deteriorated. In addition, with increasing cutting speed, the surface quality improves due to the decreasing tool-chip contact area [27]. In this study, hole quality decreased with increasing cutting speed due to decreasing BUE and tool-chip contact area. In addition, the hole quality significatnly deteriorated with feed rate due to the increasing cutting forces [28].
3 TAGUCHI EXPERIMENTAL DESIGN APPROACH
The Taguchi method developed by Genuchi Taguchi is a statistical method used to improve the product quality. It is commonly used in improving industrial product quality due to the proven success [29] and [30]. With the Taguchi method, it is possible to significantly reduce the number of experiments. The
Taguchi method is not only an experimental design technique, but also a beneficial technique for high-quality system design [31] and [32].
The Taguchi technique includes the following steps:
• determine the control factors,
• determine the levels belonging to each control factor and select the appropriate orthogonal array, • assign the control factors to the selected
orthogonal matrix and conduct the experiments, • analyze data and determine the optimal levels of
control factors,
• perform the confirmation experiments and obtain the confidence interval,
• improve the quality characteristics.
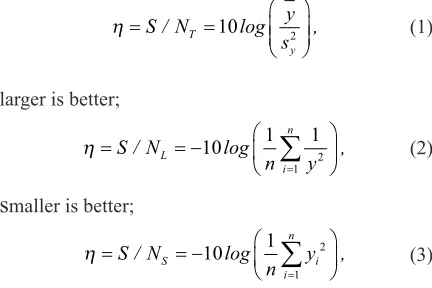
The Taguchi method uses a loss function to determine the quality characteristics. Loss function values are also converted to a signal-to-noise (S/N) ratio (η). In general, there are three different quality characteristics (Eqs. (1) to (3)) in S/N ratio analysis, namely “Nominal is the best”, “Larger is the better” and “Smaller is the better”. For each level of process parameters, signal-to-noise ratio is calculated based on S/N analysis.
Nominal is the best;
η = =
S N y
s
T
y
/ 10log 2 , (1)
larger is better;
η = = −
=
∑
S Nn y
L
i n
/ 10log 1 12 ,
1 (2)
s
maller is better;η = = −
=
∑
S Nn y
S i
i n
/ 10log 1 2 ,
1 (3)
where y is the mean of observed data, sy2 is the
variance of y, n is the number of observations and y is the observed data [20].
3.1 Selection of Control Factors and Orthogonal Array
In this study, cutting tools (CHT – Conventionally Heat Treated, CT – Cryogenically Treated), cutting speed (V) and feed rate (f) were selected as control factors and their levels were determined as shown in Table 4.
the optimal drilling parameters and to analyze the effects of these parameters. The drilling parameters were assigned to each column and eight combinations of drilling parameters were formed as shown in Table 5.
Table 4. Cutting parameters and their levels
Symbol Cutting Parameter Levels
1 2
A Cutting Tools (Ct) CHT CT
B Cutting Speed (V) [m/min] 12 14
C Feed Rate (f) [mm/rev] 0.08 0.1
Table 5. Orthogonal array of Taguchi L8(23)
Trial no. L8 A B C
1 1 1 1
2 1 1 2
3 1 2 1
4 1 2 2
5 2 1 1
6 2 1 2
7 2 2 1
8 2 2 2
In the Taguchi method, orthogonal array can provide an effective experimental performance with a minimum number of experimental trials. The
configuration of orthogonal arrays is determined with respect to total degrees of freedom of the targeted function. The degree of freedom (degree of freedom 8–1 = 7) for L8 orthogonal array can be more than or at least equal to the determined process parameters. The surface roughness and roundness error values were measured via the experimental design for the each combination of the control factors. The determination of the quality characteristics of the measured control factors was provided by signal-to-noise (S/N) ratios.
3.2 Analysis of the Signal-to-Noise (S/N) Ratio
The Taguchi method uses S/N ratio to measure the variations of the experimental design. The equation of “smaller is the better” (Eq. (3)) was selected for the calculation of S/N ratio since the lowest values of surface roughness and roundness error were the desired results in terms of good product quality. S/N ratios of surface roughness and roundness error are shown in Table 6. As shown in Table 6, the drilling parameters were discriminated by considering different levels and possible effects according to the selected orthogonal array. As results from the eight experimental trials, the mean value of surface roughness was calculated as 2.08 µm and mean S/N ratio for surface roughness value were –6.29 dB. The
Table 6. S/N ratios of experimental results for surface roughness and roundness error
Trial no.
Cutting parameter level Measured surface roughness (η S/N
i i = 1−8)
Measured roundness error
S/N (ηi i = 1−8)
A Cutting tool (Ct)
B Cutting speed (V)
C Feed rate
(f) Ra [µm] [dB] Re [µm] [dB]
1 CHT 12 0.08 2.35 -7.42 6.3 -15.99
2 CHT 12 0.1 2.47 -7.85 7.5 -17.50
3 CHT 14 0.08 1.9 -5.57 6.1 -15.71
4 CHT 14 0.1 1.95 -5.80 6.4 -16.12
5 CT 12 0.08 2.1 -6.44 6.1 -15.71
6 CT 12 0.1 2.22 -6.92 7.1 -17.03
7 CT 14 0.08 1.82 -5.20 5.4 -14.65
8 CT 14 0.1 1.81 -5.15 6 -15.56
TRa (Surface roughness total mean value)= 2.08 µm
TRa–S/N (Surface roughness S/N ratio total mean value)= –6.29 dB
TRe (Roundness error total mean value)= 6.36 µm
TRe-S/N (Roundness error S/N ratio total mean value)= –16.03
Table 7. Mean S/N ratios [dB] of control factors
Control Factors Surface Roughness (Ra) Roundness Error (Re)
Level 1 Level 2 Max–Min Level 1 Level 2 Max–Min
A -6.66 -5.93 0.73 -16.33 -15.74 0.59
B -7.16 -5.43 1.73 -16.55 -15.51 1.04
mean value of roundness error and mean S/N ratio for roundness error value were also calculated as 6.36 µm and -16.03 dB respectively. Mean S/N ratios for each level of drilling parameters and level differences of parameters are shown in Table 7.
The effects of the level of each factor on the quality characteristics can be analyzed using S/N ratios. These effects are defined and evaluated according to total mean values of experimental trial results or S/N ratios. The optimum surface roughness and roundness error values can be calculated by means of total mean values of experimental trial results. Another requirement in the calculation of optimum values is to determine the optimum levels. The optimum levels can be determined by evaluating two different levels of the control factors according to the results from the combinations generated by the orthogonal array. The levels of control factors were determined for both surface roughness and roundness error represented in Table 7, and S/N graphics of these levels were used for the evaluation (Fig. 1).
Distribution of the means of S/N ratios for surface roughness and roundness error are shown in Fig. 1. Since “smaller is the better” was selected for surface roughness and roundness error, the lowest values at first level and second level were eliminated to determine the optimal combination of cutting tool, cutting speed and feed rate. Therefore, the optimum combination of surface roughness and roundness error were determined as A2B2C1 (A2 = CT, B2 = 14 m/min, C1 = 0.08 mm/rev) and A2B2C1 (A2 = CT, B2 = 14 m/ min, C1 = 0.08 mm/rev), respectively. The calculated optimal values were proposed for eight trials and their eight possible combinations (8 from 23 = 8).
3.3 ANOVA and the Equations of Surface Roughness and Roundness Error
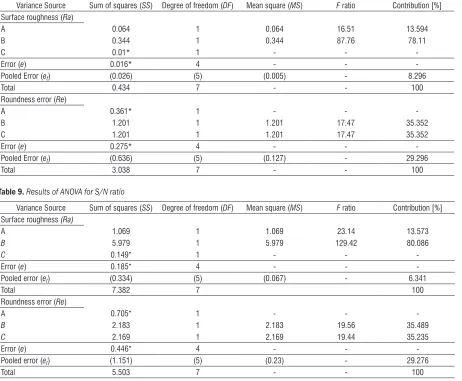
In this study, ANOVA was used to analyze the effects of cutting tools, cutting speed and feed rate on surface roughness and roundness error. In addition, multiple regression analysis was used to derive the mathematical models of the control factors and their interactions. ANOVA is a statistical method used for determining individual interactions of all control factors. In the analysis, the percentage distributions of each control factor were used to measure the corresponding effects on the quality characteristics. The performed experimental plan was evaluated at a confidence level of 95%. ANOVA values belonging to experimental results for the surface roughness and roundness error and S/N ratios are shown in Tables 8 and 9, respectively. The significance of control factors in ANOVA is determined by comparing F value of each control factor and F0.05 value from table.
In consequence of the conducted assessments, the factor C (feed rate) and error value for surface roughness were removed from Table 8. The error term (e) and total error variance (et)which includes
this error were combined by the pooling method. These terms removed from the table were marked with sign “*”. According to pooling results, factor B (cutting speed) had a dominant effect (78.11%) on the surface roughness. This factor was followed by factor A (cutting tool) with a ratio of 13.594%. Combined error ratio (8.296%) was found small according to the other ratios. The terms removed from table were marked with sign “*” by considering the results of ANOVA performed for S/N ratio in Table 9. When the remaining factors were evaluated according to
the pooling results, it was observed that factor B was found to be the major factor (80.086%). This factor is followed by factor A with a ratio of 13.573%. The combined error ratio (6.341%) obtained according to S/N ratios is smaller than other ratios. ANOVA analyses of the experimental trials and the S/N ratios of surface roughness were parallel.
As a result of the evaluations, factor A (cutting tool) and error value for roundness error were removed from Table 8. It was found that factors B and C had significant effects (35.352%) on the roundness error, when the remaining factors were evaluated according to the pooling the results. Combined error (pooled error) was calculated as 29.296%. As shown from S/N ratios of the roundness error in Table 9, factor B has the most significant effect (35.489%). Factor C has also as more important effect (35.235%) as factor
Table 8. Results of ANOVA for surface roughness and roundness error
Variance Source Sum of squares (SS) Degree of freedom (DF) Mean square (MS) F ratio Contribution [%] Surface roughness (Ra)
A 0.064 1 0.064 16.51 13.594
B 0.344 1 0.344 87.76 78.11
C 0.01* 1 - -
-Error (e) 0.016* 4 - -
-Pooled Error (et) (0.026) (5) (0.005) - 8.296
Total 0.434 7 - - 100
Roundness error (Re)
A 0.361* 1 - -
-B 1.201 1 1.201 17.47 35.352
C 1.201 1 1.201 17.47 35.352
Error (e) 0.275* 4 - -
-Pooled Error (et) (0.636) (5) (0.127) - 29.296
Total 3.038 7 - - 100
Table 9. Results of ANOVA for S/N ratio
Variance Source Sum of squares (SS) Degree of freedom (DF) Mean square (MS) F ratio Contribution [%] Surface roughness (Ra)
A 1.069 1 1.069 23.14 13.573
B 5.979 1 5.979 129.42 80.086
C 0.149* 1 - -
-Error (e) 0.185* 4 - -
-Pooled error (et) (0.334) (5) (0.067) - 6.341
Total 7.382 7 100
Roundness error (Re)
A 0.705* 1 - -
-B 2.183 1 2.183 19.56 35.489
C 2.169 1 2.169 19.44 35.235
Error (e) 0.446* 4 - -
-Pooled error (et) (1.151) (5) (0.23) - 29.276
Total 5.503 7 - - 100
B. Combined error ratio became 29.276%. ANOVA analyses of the experimental trials and the S/N ratios of roundness error were parallel.
Multiple regression analysis was employed to derive the predictive equations of the surface roughness and roundness error. The equations of surface roughness and roundness error were generated based on the control factors and their interactions. The predictive equations generated for surface roughness (Ra1) and roundness error (Re1) are given in Eqs. (4) and (5), respectively.
predictive equations which contain the control factors and their interactions for surface roughness (Ra2) and roundness error (Re2) are shown in Eqs. (6) and (7), respectively.
Ra2 = 2.968 – 0.955 Ct + 0.0875 V +
+ 38.25 f + 0.07 CtV + 1.5 Ctf – 2.5 Vf , (6) Re2 = 12.563 – 0.975 Ct + 1.263 V + + 246.25 f – 0.125 CtV + 2.5 Ctf – 16.25 Vf . (7) In interactive model, R2 values of the equations were calculated as 0.998 and 0.990, respectively. The coefficient of determination of surface roughness became 99.8% in interactive factor model, while it was calculated as 96% in factor model. Similarly, the coefficient of determination of roundness error became 99% in interactive factor model, while it was calculated as 91% in factor model. Thus, the interactive regression models for both surface roughness and roundness error (Ra2 and Re2) are suggested.
3.4 Confirmation Experiments
The final step of the Taguchi method is the confirmation experiments conducted for examining the quality characteristics. The model used in the confirmation tests is defined with the total effect generated by the control factors. The factors are equals to the sum of each individual effect. The optimum levels are evaluated by considering the pooled error losses. The optimal surface roughness and roundness error were obtained by taking into account the influential factors within the evaluated optimum combination. Therefore, the predicted optimum surface roughness (Eq. (8)) was calculated by considering individual effects of the factors A2, B2
and C1, and their levels.
RaP = TRa + ( A2 – TRa ) + ( B2 – TRa ), (8)
where TRa is the surface roughness total mean
value. A2 and B2 are the means (1.98 µm, 1.87 µm) of experimental trials at the second level of both factors. According to these values, the optimal surface roughness (RaP) was computed as 1.77 µm.
The factors B2and C1 and their levels were used in the calculation of the predicted optimal roundness error (Eq. (9)) by considering individual effects of the factors A2,B2and C1and their levels.
ReP = TRe + ( B2 – TRe ) + ( C1 – TRe ), (9)
where TReis the roundness error total mean value.
B2 is the mean (5.98 µm) of experimental trials
at the second level of factor B2, and C1 is the mean (5.98 µm) of experimental trials at the first level of factor C1. According to these values, the optimal roundness error (ReP) was calculated as 5.60 µm. The
confidence interval was employed to verify the quality characteristics of the confirmation experiments. The confidence interval for the predicted optimal values is calculated as follows [34];
CI F xV x
n r
V e eff
= +
α: ,1 2 ,
1 1 (10)
where, Fα:1,v2, F-ratio of significant level α, α: significant level, 1-α: confidence level, V2: degree-of-freedom of pooled error variance, Ve: pooled error
variance, r: number of repeated trials, neff: number of
effective measured results defined as;
n total erimental trials
total ree of freedom of factor
eff =
+
exp deg 1
ss used for prediction
. (11)
In this study, three confirmation experiments (r = 3) were carried out to evaluate the performance of experimental trials for surface roughness under optimal conditions (A = CT, B = 14 m/min and C = 0.08 mm/rev). The value of Fα:1,v2 = 6.61 which
has a 95% confidence level was found with respect to α = 0.05 and V2 = 5 by considering the look-up table. The confidence interval was calculated as 0.209 µm using Eqs. (10) and (11). With a 95% confidence level, the confirmation test results for the surface roughness was expected to be in the confidence interval of 1.77±0.153 µm or 1.617 to 1.923 µm. The measurements in three confirmation tests conducted with regard to the optimal levels (A2B2C1) were 1.82, 1.71 and 1.83 µm. As depicted in Table 10, the mean of the measurements was 1.79 µm. This mean falls within the determined confidence interval (1.617<1.79<1.923). Therefore, the system optimization for surface roughness was achieved using the Taguchi method at a significance level of 0.05.
On the other hand, three confirmation experiments for roundness error were performed under optimal conditions (A = CT, B = 14 m/min and C = 0.08 mm/ rev). The value of Fα:1,V2 = 6.61 which has a 95%
tests conducted for the roundness error were expected to be in the confidence interval of 5.60±0.771 µm or 4.829 to 6.371 µm. The measurements in three confirmation tests conducted with regard to the optimal levels (A2B2C1) were 5.40, 5.44 and 5.38 µm. As shown in Table 10, the mean of the measurements was calculated as 5.40 µm. This mean falls within the determined confidence interval (4.829<5.40<6.371). Hence, the system optimization for roundness error was successfully carried out by using the Taguchi method at a significance level of 0.05.
The comparisons of the surface roughness and roundness error values according to optimal test and the predicted combination A2B2C1, and the combination A1B1C2 selected from eight initial trials are given in Table 10. According to these comparisons, the surface roughness and roundness error values were reduced from 2.47 µm to 1.79 µm and from 7.5 µm to 5.40 µm, respectively. The improved accuracy efficiency because of the optimal combination was increased up to 27.53% ((2.47–1.79)/2.47) for surface roughness and to 28% ((7.5-5.40)/7.5) for roundness error. To compare the quality characteristics of the initial and optimal conditions, S/N ratios in Table 10 were used. The quality losses are given in Table 11.
Table 11. Comparisons of experimental trials
Initial combination
Optimal combination Prediction Confirmation Level A1B1C2 A2B2C1 A2B2C1
Ra (µ) 2.47 1.77±0.153 1.79
Quality loss [%] - - 52.36
Level A1B1C2 A2B2C1 A2B2C1
Re (µ) 7.5 5.60±0.771 5.40
Quality loss [%] - - 51.76%
In practice, the quality losses between initial and optimal combinations for both surface roughness and roundness error are calculated as follows [34]:
L y
L y
opt
ini
( )
( ) ,
/ ≈
1 2
3
∆η
(12)
where, Lopt(y) and Lini(y) are optimal and initial
combinations respectively. ∆η is the difference
between S/N ratios of optimal and initial combinations. The differences of S/N ratios that can be used to evaluate the quality loss (Eq. (12)) of the optimal combination for surface roughness and roundness error were found as 2.80 (∆η = 2.80 (= 7.85 – 5.05)) and 2.85 (∆η = 2.85 (= 17.50 – 14.65)), respectively.
The quality loss of surface roughness was calculated as 0.5236 using Eq. (11). Thereby, the quality loss at the optimal combination became only 52.36% of the initial combination. When these results were evaluated, the quality losses for the surface roughness were reduced to 47.64% by using the Taguchi method. The quality loss for roundness error was calculated as 0.5176. Thereby, the quality loss in the optimal combination was only 51.76% of the initial combination. The quality losses for the roundness error were reduced to 48.24% by using these results. Based on the confirmation experiment results, the surface roughness and roundness error decreased 1.38 times and 1.39 times, respectively.
4 CONCLUSIONS
In this study, the optimization of drilling parameters were carried out by the Taguchi method to obtain optimum surface roughness and roundness error values in the drilling of AISI 316 austenitic stainless steel with untreated and treated drills. In the performed experimental trials using Taguchi orthogonal arrays, it was found that the cutting speed (78.11%) had a significant effect on the surface roughness and that the cutting speed (35.352%) and feed rate (35.352%) had significant effects on the roundness error. The quality losses (52.36%) of the surface roughness obtained at optimal combinations (Ct = CT, V = 14 m/min, f = 0.08 mm/rev) were nearly equal to half of the ones obtained from experimental combinations. Similarly, the quality losses of the roundness error obtained at optimal combinations became 51.76%. Optimal surface roughness and roundness error values were calculated as 1.77 µm and 5.60 µm using optimal parameters, respectively.
The Taguchi method was successfully applied to determine the optimal combinations of drilling parameters and to minimize machining costs and
Table 10. Comparisons of surface roughness and roundness error
Level Surface Roughness Roundness Error
Ra [µm] S/N [dB] Re [µm] S/N [dB]
Initial combination A1B1C2 2.47 –7.85 7.5 –17.50
Optimal combination (Experiment) A2B2C1 1.79 –5.05 5.40 –14.65
time in drilling of AISI 316 stainless steel. Further research works could consider more factors such as drilling depth, lubricant, tip and helix angle and cryogenic treatments at different soaking time (i.e. 4, 8, 12, 36, 48 h, and so on) and at different cryogenic temperatures (–70, –125, –150 °C and so on) affecting surface roughness and roundness error.
5 REFERENCES
[1] Da Silva, F.J., Franco, S.D., Machado, A.R., Ezugwu, E.O., Souza Jr. A.M. (2006). Performance of cryogenically treated HSS tools. Wear, vol. 261, no. 5-6, p. 674-685, DOI:10.1016/j.wear.2006.01.017. [2] Young, A.Y.L., Seah, K.H.W., Rahman, M. (2006).
Performance evaluation of cryogenically treated tungsten carbide tools in turning. International Journal of Machine Tools & Manufacture, vol. 46, no. 15, p. 2051-2056, DOI:10.1016/j.ijmachtools.2006.01.002. [3] Paulin, P. (1993). Frozen Gears. Gear Technology, vol.
10, p. 26-29.
[4] Sreerama Reddy, T.V., Sornakumar, T., Venkatarama Reddy, M., Venkatram, R. (2009). Machinability of C45 steel with deep cryogenic treated tungsten carbide cutting tool inserts. International Journal of Refractory Metals & Hard Materials, vol. 27, no. 1, p. 181-185. [5] Benardos, P.G., Vosniakos, G.C. (2003). Predicting
surface roughness in machining: a review. International Journal of Machine Tools & Manufacture, vol. 43, no. 8, p. 833-844, DOI:10.1016/S0890-6955(03)00059-2. [6] Danilevsky, V. (1987). Manufacturing Engineering.
TMMOB Publishing, Ankara.
[7] Boothroyd, G. (1981). Fundamentals of Metal Machining and Machine Tools. McGraw-Hill, New York.
[8] Risbood, K.A., Dixit, U.S., Sahasrabudhe, A.D. (2003). Prediction of surface roughness and dimensional deviation by measuring cutting forces and vibrations in turning process. Journal of Materials Processing Technology, vol. 132, no. 1-3, p. 203-214, DOI:10.1016/ S0924-0136(02)00920-2.
[9] Korkut, I., Kucuk, Y. (2010). Experimental Analysis of the Deviation from Circularity of Bored Hole Based on the Taguchi Method. Strojniški vestnik - Journal of Mechanical Engineering, vol. 56, no. 5, p. 340-346. [10] Lin, Y.C., Chen, Y.F., Wang, D.A., Lee, H.S. (2009).
Optimization of machining parameters in magnetic force assisted EDM based on Taguchi method. Journal of Materials Processing Technology, vol. 209, no. 7, p. 3374-3383, DOI:10.1016/j.jmatprotec.2008.07.052. [11] Šibalija, T., Majstorović, V., Soković, M. (2011).
Taguchi-Based and Intelligent Optimisation of a Multi-Response Process Using Historical Data. Strojniški vestnik - Journal of Mechanical Engineering, vol. 57, no. 4, p. 357-365, DOI:10.5545/sv-jme.2010.061. [12] Unal, R., Dean, E.B. (1991). Taguchi approach to
design optimization for quality and cost. An Overview
Proceedings of the International Society of Parametric Analyst 13th Annual, p. 21-24.
[13] Phadke, M.S. (1989). Quality Engineering Using Robust Design. Prentice-Hall, New Jersey.
[14] Yang, J.L., Chen, J.C. (2001). A systematic approach for identifying optimum surface roughness performance in end-milling operations. Journal of Industrial Technology, vol. 17, no. 2, p. 1-8.
[15] Bagci, E., Özcelik, B. (2006). Analysis of temperature changes on the twist drill under different drilling condition based on Taguchi method during dry drilling of Al 7075-T651. International Journal of Advanced Manufacturing Technology, vol. 29, no. 7-8, p. 629-636, DOI:10.1007/s00170-005-2569-1.
[16] Davim, J.P., Reis, P. (2003). Drilling carbon fiber reinforced plastic manufactured by autoclave-experimental and statistical study. Materials and Design, vol. 24, no. 5, p. 315-324, DOI:10.1016/ S0261-3069(03)00062-1.
[17] Furness, R.J., Wu, C.L., Ulsoy, A.G. (1996). Statistical analysis of the effects of feed, speed, and wear of hole quality in drilling. Journal of Manufacturing Science and Engineering, vol. 118, no. 3, p. 367-375, DOI:10.1115/1.2831038.
[18] Tsao, C.C., Hocheng, H. (2008). Evaluation of thrust force and surface roughness in drilling composite material using Taguchi analysis and neural network. Journal of Materials Processing Technology,
vol. 203, no. 1-3, p. 342-348, DOI:10.1016/j. jmatprotec.2006.04.126.
[19] Zhang, J.Z., Chen, J.C., Kirby, E.D. (2007). Surface roughness optimization in an end-milling operation using the Taguchi design method. Journal of Materials Processing Technology, vol. 184, no. 1-3, p. 233-239, DOI:10.1016/j.jmatprotec.2006.11.029.
[20] Nalbant, M., Gokkaya, H., Sur, G. (2007). Application of Taguchi method in the optimization of cutting parameters for surface roughness in turning. Materials and Design, vol. 28, no. 4, p. 1379-1385, DOI:10.1016/j.matdes.2006.01.008.
[21] Kurt, M., Bagci, E., Kaynak, Y. (2009). Application of Taguchi methods in the optimization of cutting parameters for surface finish and hole diameter accuracy in dry drilling processes. International Journal of Advanced Manufacturing Technology, vol. 40, no. 5-6, p. 458-469, DOI:10.1007/s00170-007-1368-2.
[22] Firouzdor, V., Nejati, E., Khomamizadeh, F. (2008). Effect of deep cryogenic treatment on wear resistance and tool life of M2 HSS drill. Journal of Materials Processing Technology, vol. 206, no. 1-3, p. 467-472, DOI:10.1016/j.jmatprotec.2007.12.072.
[23] Huang, J.Y., Zhu, Y.T., Liao, X.Z., Beyerlein, I.J., Bourke, M.A., Mitchell, T.E. (2003). Microstructure of Cryogenic Treated M2 Tool Steel. Materials Science
[24] Dhar, N.R., Kamruzzaman, M., Ahmed, M. (2006). Effect of minimum quantity lubrication (MQL) on tool wear and surface roughness in turning AISI-4340 steel. Journal of Materials Processing Technology, vol. 172, no. 2, p. 299-304, DOI:10.1016/j. jmatprotec.2005.09.022.
[25] Xavior, M.A., Adithan, M. (2009). Determining the influence of cutting fluids on tool wear and surface roughness during turning of AISI 304 austenitic stainless steel. Journal of Materials Processing Technology, vol. 209, no. 2, p. 900-909, DOI:10.1016/j. jmatprotec.2008.02.068.
[26] Mohan Lal, D., Renganarayanan, S., Kalanidhi, A. (2001). Cryogenic treatment to augment wear resistance of tool and die steels. Cryogenics, vol. 41, no. 3, p. 149-155, DOI:10.1016/S0011-2275(01)00065-0.
[27] Mohammed, T.H. (2001). Hole quality in deep hole drilling. Materials and Manufacturing Processes, vol. 16, no. 2, p. 147-164, DOI:10.1081/AMP-100104297. [28] Trent, E.M. (1989). Metal cutting.
Butterworth-Heinemann, United Kingdom.
[29] Pınar, A.M., Güllü, A. (2010). Optimization of numerical controlled hydraulic driven positioning system via Taguchi method. Journal of Faculty
Engineering Architectural Gazi University, vol. 25, no. 1, p. 93-100.
[30] Taguchi, G., Elsayed, E.A., Hsiang, T. (1989). Quality engineering in production systems. McGraw-Hill, New York.
[31] Savaşkan, M., Taptık, Y., Ürgen, M. (2004). Performance optimization of drill bits using design of experiments. Journal of ITU, vol. 3, no. 6, p. 117-128. [32] Motorcu, A.R. (2010). The Optimization of Machining
Parameters Using the Taguchi Method for Surface Roughness of AISI 8660 Hardened Alloy Steel. Strojniški vestnik - Journal of Mechanical Engineering,
vol. 56, no. 6, p. 391-401.
[33] Ranjit, K.R. (1990). A primer on the Taguchi method, competitive manufacturing series. Van Nostrand Reinhold, New York.
![Table 7. Mean S/N ratios [dB] of control factors](https://thumb-us.123doks.com/thumbv2/123dok_us/8951785.1861153/4.586.57.520.651.714/table-mean-s-n-ratios-db-control-factors.webp)
![Fig. 1. Effects of control factors on surface roughness and roundness error; A: Cutting tool, B: Cutting speed [m/min], C: Feed rate [mm/rev], TRa-S/N: Surface roughness S/N ratio total mean value line, TRe-S/N : Roundness error S/N ratio total mean value line](https://thumb-us.123doks.com/thumbv2/123dok_us/8951785.1861153/5.586.88.508.78.239/effects-roughness-roundness-cutting-cutting-surface-roughness-roundness.webp)