DEMOGRAPHIC RESEARCH
A peer-reviewed, open-access journal of population sciences
DEMOGRAPHIC RESEARCH
VOLUME 37, ARTICLE 45, PAGES 1445–1476
PUBLISHED 16 NOVEMBER 2017
http://www.demographic-research.org/Volumes/Vol37/45/ DOI: 10.4054/DemRes.2017.37.45
Research Article
Summertime, and the livin’ is easy: Winter
and summer pseudoseasonal life expectancy in
the United States
Tina Ho
Andrew Noymer
c
2017 Tina Ho & Andrew Noymer.
This open-access work is published under the terms of the Creative Commons Attribution 3.0 Germany (CC BY 3.0 DE), which permits use, reproduction, and distribution in any medium, provided the original author(s) and source are given credit.
1 Introduction 1446
2 Data and methods 1449
3 Results 1451
4 Discussion 1456
5 Conclusion 1459
6 Acknowledgments 1460
References 1461
Summertime, and the livin’ is easy: Winter and summer
pseudoseasonal life expectancy in the United States
Tina Ho1
Andrew Noymer2
Abstract
BACKGROUND
In temperate climates, mortality is seasonal with a winter-dominant pattern, due in part to specific causes of death, including pneumonia, influenza, and cold-induced thrombosis. Cardiac causes, which are the leading cause of death in the United States, are winter-seasonal, although the pathways are incompletely understood. Interactions between cir-culating respiratory viruses (e.g., influenza) and cardiac conditions have been suggested as a cause of winter-dominant mortality patterns.
OBJECTIVE
In this paper we aim to quantify the total mortality burden of winter in the United States.
METHODS
We calculate ‘pseudoseasonal’ life expectancy, dividing the year into two six-month spans, one encompassing winter, the other summer.
RESULTS
During the summer when cold weather is absent and the circulation of respiratory viruses is significantly reduced, life expectancy is about one year longer. We also quantify the seasonal mortality difference in terms of seasonal ‘equivalent ages’ (defined herein) and proportional hazards.
CONTRIBUTION
We quantify the effects of winter mortality. The population-level mortality reduction of a perfect influenza vaccine (which can only reduce a portion of winter-attributable mortality) would be much more modest than is often recognized.
1Program in Public Health, University of California, Irvine, USA.
2Department of Population Health and Disease Prevention, University of California, Irvine, USA.
Summertime, And the livin’ is easy Fish are jumpin’ And the cotton is high
– George Gershwin “Summertime”
1. Introduction
The primary goal of this paper is to quantify the mortality impact of winter in the United States, in terms of life expectancy. To accomplish this, we analyze life expectancy in the United States from a seasonal perspective. We calculate two life expectancies per 12-month period (‘pseudowinter’ and ‘pseudosummer’), using methods described below. The point is to estimate life expectancy in the absence of respiratory viruses (most no-tably, influenza) and the effects of cold, using pseudosummer as an approximation. Pseu-dowinter, on the other hand, estimates life expectancy in the presence of these viruses and cold-induced conditions. The difference between life expectancy in pseudowinter and pseudosummer gives the total mortality impact of winter. The pseudoseasonal ap-proach also illuminates within-year mortality fluctuations.
Mortality in temperate climates is highly seasonal, with winter peaks and summer troughs (Rosenberg 1966; Land and Cantor 1983; Kalkstein and Davis 1989; Macken-bach, Kunst, and Looman 1992; Rau 2006; Deschˆenes and Moretti 2009; Deschˆenes and Greenstone 2011). Respiratory and cardiovascular causes, including stroke (Sheth et al. 1999; Yang et al. 2016), dominate the seasonal effects, with cancer being negligibly cycli-cal (Crombie et al. 1995). Heat wave mortality peaks are ephemeral interruptions of this overall pattern (e.g., Basu and Samet 2002; Klinenberg 2002; Valleron and Boumendil 2004; Kaiser et al. 2007; Toulemon and Barbieri 2008; Rockl¨ov, Ebi, and Forsberg 2011; Robine, Michel, and Herrmann 2012; ˚Astr¨om et al. 2013). Heat-wave-associated deaths have a different composition by cause compared to summer mortality (Huynen et al. 2001; Basaga˜na et al. 2011), although Rey et al. (2007) report increases in most causes at older ages. Heat wave mortality interacts with air pollution (Rooney et al. 1998; Bhaskaran et al. 2009). Both severity and duration of heat waves are important for mortality (Ander-son and Bell 2009).
suggested as a possibly overlooked factor in the long-term decline of heart disease (Sere-takis et al. 1997). Congruently, Kunst, Looman, and Mackenbach (1991) report declines in winter excess mortality in the Netherlands between the 1950s and the 1980s. On the other hand, van Rossum et al. (2001) do not find changes in seasonal mortality over 25 years in English civil servants. Insufficient winter heating among the poor may not play a significant role in mortality in Britain (Wilkinson et al. 2004) or Denmark (Rau 2004). Healy (2003) demonstrates that the coefficient of seasonal variation in mortality (CSVM) is correlated with mean winter temperature (warmer temperature, higher CVSM) at the country level in Europe; see also Keatinge et al. (1997, 2000), D´ıaz et al. (2005), Gaspar-rini et al. (2015), and Carmona et al. (2016). Analitis et al. (2008) also find an association between cold weather and mortality in European cities, and similarly note greater cold effect in warmer climates. Yang et al. (2012) and Zhao, Zhu, and Tu (2015) find similar results in subtropical Asia. Kysely et al. (2009) find increased cardiovascular mortality in all ages above 25 during cold spells in the Czech Republic. Mortality in nursing homes appears to be sensitive to both hot and cold temperature extremes (Stafoggia et al. 2006; Hajat, Kovats, and Lachowycz 2007).
Mortality seasonality at temperate latitudes is influenced by more than just viral cir-culation. Cold can affect thrombosis, with consequences for stroke and myocardial infarc-tion (Keatinge et al. 1984, 1986). Pan, Li, and Tsai (1995) write: “Poor thermoregulainfarc-tion in older people may precipitate cardiovascular disease events.” Z¨oller et al. (2013) note winter peaks in venous thromboembolism in Sweden. The causal connection between winter cold and thromboembolism may be coagulation factors (Dentali, Manfredini, and Ageno 2009). On the other hand, there is some evidence that extreme cold (below –30°C) may reduce mortality (Otrachshenko, Popova, and Solomin 2017), although the mechanism may be as prosaic as people staying indoors when it is that cold outside.
Air pollution is another contributor to mortality seasonality in temperate climates. All else equal, air pollution is positively associated with increased mortality (Schwartz and Dockery 1992; Chay, Dobkin, and Greenstone 2003; Chay and Greenstone 2003, 2005; Currie, Neidell, and Schmieder 2009). This relationship can affect mortality in winter and summer. In the summertime, daytime UV radiation plays a role in air pollution (Cleveland and Graedel 1979). In the wintertime, solar UV incidence is lower, but some air pollution, including particulates, is often higher due to home heating emissions (Currie and Neidell 2005; Janh¨all et al. 2006; Olofson et al. 2009; Johnston et al. 2013; Tang et al. 2017). Pollution is another example of multidimensionality of the seasonality of mortality.
Figure 1: Percentage of respiratory specimens testing positive for influenza virus, 2009–2015
2009 2011 2013 2015
Year 0
10 20 30 40
Positive percent of tested samples
Note: Weekly data from CDC (2015). Pseudowinters are shaded dark.
2. Data and methods
Regarding the influenza component of winter mortality, the noncirculation of flu viruses in the summertime is not absolute, as Figure 1 shows. This is a time series plot of respiratory specimens (e.g., nasal swabs) that are positive for any strain of the influenza virus (as a percentage, so peaks are not reflective of more samples during the winter). Note that even in the peaks, most samples test negative; there are many causes of upper respiratory illness other than influenza virus. Most peaks of influenza occur in the shaded pseudowinters, but the 2009 swine-origin influenza pandemic is a major exception. Dur-ing influenza pandemics, which involve emergence of new strains, viral circulation in the summer is more likely (Webster et al. 1992).
From the mortality detail files of the National Center for Health Statistics (NCHS 2015), we extracted monthly data on every death in the United States, January 1959 to December 2014.3 The data was then aggregated by sex and 22 age groups (0, 1–4, 5–9, . . . , 95–99,≥100), and binned into six-month pseudoseasons. Pseudowinter is November through April, and pseudosummer is May through October; pseudoseasons do not nest into calendar years. In long-run averages, these six-month periods best capture influenza virus circulation or lack thereof.4 The data begins with pseudosummer 1959 and ends with pseudosummer 2014 (56 pseudosummers). There are 55 pseudowinters (1960–1961 to 2013–2014). Data for January through April 1959 was discarded since using this data for pseudowinter 1958–1959 would be biased due to the omission of November and De-cember 1958. Similarly, November and DeDe-cember 2014 were discarded. We constructed denominators using age- and sex-specific calendar-year exposure data from the Human Mortality Database. We graduated this person-years-at-risk data to months, adjusting for days per month and leap years, and then reaggregated to make pseudoseasonal exposures. The specifics of the denominator construction are described in the appendix. We then cal-culated sex- and age-specific death rates (deaths divided by person-years lived) for each pseudoseason, from which we calculated sex-specific period life tables in the standard way (Keyfitz 1970; Preston, Heuveline, and Guillot 2001).
Using pseudoseasons, as defined, is the closest approximation to respiratory virus transmission patterns. Some early flu seasons start in November, and some late flu sea-sons can persist into April. An alternative would be to omit shoulder periods, by using
3Prior to 1959, digitized mortality data is not available for the United States that are simultaneously
disaggre-gatable by age, sex, and month.
4The exact onset and cessation of the flu season – by which we mean epidemiologically significant influenza
December–March for pseudowinter and June–September for pseudosummer. This would provide greater winter–summer contrast but has the disadvantage of leaving some data unused. More importantly, enhancing contrast is not our goal. We are trying to account for the overall influence of winter on mortality, whether there is contrast or not. What is more, cold weather occurs well before and after the winter astronomical season (i.e., between the winter solstice and vernal equinox), so for cold-related causes of death like thrombosis, a similar logic applies.
3. Results
Figure 2: Life expectancy (e(0)) time series by sex and by pseudoseason
1960 1970 1980 1990 2000 2010
Year 70
75 80
e(0), years
Summer
HMD ± 1 yr
Winter Males
Females
Notes: The band enveloping the series is two years in height, centered on the calendar-yeare(0)estimates from the Human Mortality Database; it is not an uncertainty interval.
the HMDe(0)data as the center of the band also provides an external check of our life expectancy calculations because our pseudoseasonal data should fairly neatly sandwich the calendar-year series.
Figure 3 shows the difference betweene(0)in summers and their preceding winters (from the summer of 1960 minus the winter of 1959–1960, to the summer of 2014 mi-nus the winter of 2013–2014); all comparisons are summer-to-previous-winter, although summer-to-following-winter analyses give similar results. There are three important fea-tures. First, no secular time trend is evident. Second, the data is strongly negatively autocorrelated: Declines are followed by increases, and vice versa. Third, in addition to higher life expectancy, women have a higher summer−winter difference, 0.99±0.22 years, versus 0.64±0.23 years for males (mean±SD).
Figure 3: Summer advantage over winter in pseudoseasonal life expectancy, females (upper series) and males (lower series)
1960 1980 2000
Year 0.0
0.5 1.0 1.5
Summer minus winter e(0), years
Females
Males
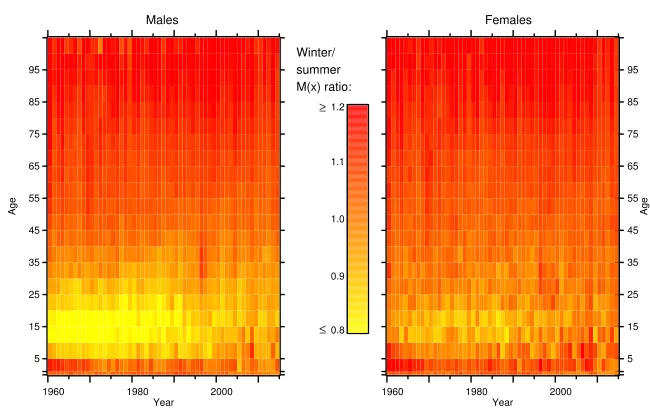
Figure 4 is a heat map of the winter–summer ratio of the mortality rate by age (Mx),
2002). Winter overtakes summer above age 45, where death rates are (much) higher in absolute terms.
Figure 4: Heat map of winter–summer ratio ofMx, 1960–2014
1960 1980 2000 Year 5 15 25 35 45 55 65 75 85 95 Age
1960 1980 2000 Year 5 15 25 35 45 55 65 75 85 95 Age Males Females 0.8 0.9 1.0 1.1 1.2 ≤ ≥ Winter/ summer M(x) ratio:
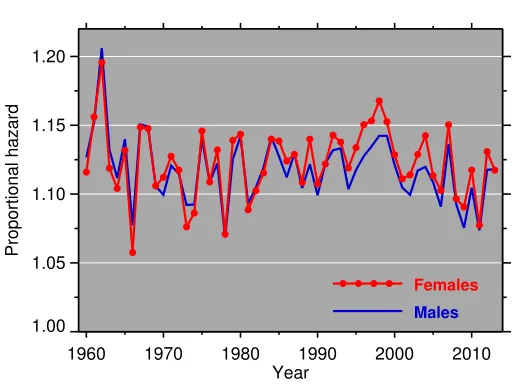
Figure 5 helps quantify the pseudoseasonal differences seen in Figure 4. Here we present, on a year-by-year basis, the proportional hazard (PY) of pseudoseasonal
mor-tality for age≥45, separately by sex. Thus, we model W = PYS, whereWis the
N-element (agewise) vector of winter death rates for a given year,PY is the year-specific
proportional hazard (scalar), andSis the vector of summer death rates. The proportional hazard is estimated as:
PY = exp
ω
X
x=45
log MxW−log MxS ,
N !
, (1)
where the superscripts (W,S) refer to winter and summer, and Mx is the age-specific
death rate. The proportional hazard is the same as the winter-to-summer ratio of the geometric mean death rate (see Schoen 1970).5 Figure 6 gives an example of howPY
works, showing winter and summer pseudoseasonalMx as well as ‘simulated’ winter:
MW
x,simu=M
S x,dataP
Y.
5Note that this is not a Cox proportional hazard model, nor is there any statistical modeling in the calculation
Figure 5: Proportional hazard analysis
1960 1970 1980 1990 2000 2010 Year
1.00 1.05 1.10 1.15 1.20
Proportional hazard
Females
Males
Note: The proportional hazard is winter death rates above age 45 as a multiple of summer death rates.
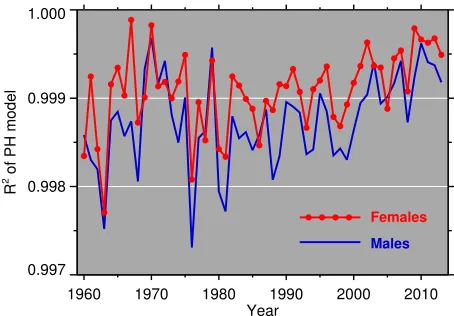
Figure 6 shows good agreement between simulated and true winter, especially be-tween ages 60 and 90. These are the ages (amongx≥50) at which most deaths occur. (Below age 60 there are fewer deaths because rates are lower, and above age 90 because exposures are lower.) Figure 5 shows that most winters have a mortality pattern that is between 110% and 115% of the previous summer’s mortality. The proportional hazard model is an excellent fit, with all the year-specificR2>0.99, which is not especially
surprising since it is based on pairwise comparisons of adjacent pseudoseasons. The year-by-year goodness of fit (R2) statistics are given in Figure 7. This shows that the
proportional hazard approach is an excellent fit for both sexes and over time. Females are a better fit in almost every year. There are no meaningful sex differences in the propor-tional hazard.6 If we drop theY superscript and model a single proportional hazard for the entire data set, thenWandSbecome year×age matrices, andPis 1.119 for males and 1.124 for females. Naturally, when modeling the whole time span with a singleP, the goodness of fit declines, but it is still not poor: R2=0.89 for males andR2=0.88 for females.
6This is in contrast to Denmark, where Rau and Doblhammer (2003) find greater seasonal fluctuations for
Figure 6: Proportional hazard analysis
50 60 70 80 90 100
Age 1,000
10,000
Mortality rate (/100,000)
Summer (data) Summer (data)
Winter (simulated) Winter (simulated)
Winter (data) Winter (data)
Note: Example graph showingMxby age (males,≥45), for summer 1962 and winter 1962–1963, as well as
‘simulated’ winter data, which is the summer data multiplied by the constant proportional hazard,PY. This year was
chosen because it has the largestPY value (cf. Figure 5).
Figure 7: Proportional hazard analysis, goodness of fit
1960 1970 1980 1990 2000 2010
Year 0.997
0.998 0.999 1.000
R
2 of PH model
Females
Males
4. Discussion
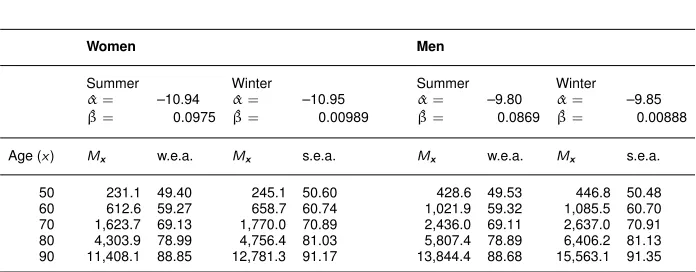
Taking only mortality into account, how much happier should an adult be during the sum-mer? Death rates will be, typically, 10% to 15% higher in the winter (Figure 5). However, by the time summer arrives, up to half a year will have passed, and death rates will be higher due to aging, even half a year’s worth. How does the winter–summer mortality difference compare to age-related changes? We propose calculating ‘equivalent ages,’ as follows. In Table 1, theMxcolumns give death rates by age, sex, and pseudoseason. The
‘w.e.a.’ columns give the winter equivalent age, or the age at which one would have to be in the winter to experience the same (summer) death rate. Similarly, the ‘s.e.a.’ columns give the summer equivalent age, or the summer age that experiences the same (winter) death rate. TheMx, w.e.a. and s.e.a. are calculated from a Gompertz mortality model
es-timated by Poisson regression, the coefficients of which are given at the top of the table.7 Symbolically:
MxS = exp ˆαS+ ˆβS·xS
(2)
MxW = exp ˆαW + ˆβW ·xW
(3) w.e.a.(xS) = αˆS−αˆW + ˆβS·xS)/βˆW, (4) whereS,W superscripts are for summer and winter,xis age, andαˆ, ˆβ, are estimated coefficients. The solution for w.e.a.(xS)in (4) comes from setting mortality rates (i.e.,
[2] and [3]) equal, and solving for xW in terms of xS and the estimated coefficients.
Thus, if w.e.a.(xS)is plugged into 3 forxW, it will produce a death rate equivalent to the desiredMxS. The same formula holds, mutatis mutandis, for s.e.a. (xW). The (winter–
summer) equivalent age is a function of the estimated Gompertz coefficients for both pseudoseasons and of the age for which an equivalency is being calculated.
Table 1 gives specific examples, using 2010 data. An 80-year-old woman in the winter experiences death rates of an 81-year-old woman in the summer. Death rates are higher in the winter, so the equivalent age in the summer is older. The difference is one year of age. On the other hand, a 70-year-old man living in the summer has death rates equivalent to a 69.1-year-old man in the winter. Summer mortality is more lenient, and therefore it’s as if he is a younger man, compared to winter. The absolute value of the difference between biological age and w.e.a. or s.e.a. becomes larger as biological age increases, sinceMxincreases exponentially with age.
There is a micro–macro disconnect here: For populations, mortality is clearly lower in the summer, holding age constant, and holding the pair of pseudoseasonal life tables 7That is to say, we estimated a Poisson regression like:log(Dx) =α+βx+log(Kx)whereDxare deaths in
constant. From the point of view of an individual, holding age constant is meaningless; one cannot go from winter to summer without aging approximately half a year. Thus, the winter-into-summer mortality changes experienced by an individual in the above thought experiment are less than the ceteris paribus analysis represented by the proportional haz-ards (and the summer-into-winter changes, more). Moreover, this ignores long-term trends; it only considers seasonal and age-related changes.
Table 1: Equivalent age analysis for 2010, as explained in the main text
Women Men
Summer Winter Summer Winter
^
α= –10.94 ^α= –10.95 ^α= –9.80 ^α= –9.85
^
β= 0.0975 ^β= 0.00989 ^β= 0.0869 ^β= 0.00888
Age (x) Mx w.e.a. Mx s.e.a. Mx w.e.a. Mx s.e.a.
50 231.1 49.40 245.1 50.60 428.6 49.53 446.8 50.48 60 612.6 59.27 658.7 60.74 1,021.9 59.32 1,085.5 60.70 70 1,623.7 69.13 1,770.0 70.89 2,436.0 69.11 2,637.0 70.91 80 4,303.9 78.99 4,756.4 81.03 5,807.4 78.89 6,406.2 81.13 90 11,408.1 88.85 12,781.3 91.17 13,844.4 88.68 15,563.1 91.35
Notes:Mxis modeled death rate per 100,000; w.e.a. is ‘winter equivalent age,’ or the age at which an individual would experience the same death rate, living in the winter, and s.e.a. is the same, mutatis mutandis, for living in the summer. Coefficients from a Poisson regression; the prediction equation isMx = exp(α+βx).
In terms of life expectancy, the effect of the winter increase in mortality is similarly modest: on average, just over one year of life expectancy for women and just under one year for men. If we could wave a magic wand, making the winter pattern of mortality look like the summer pattern, this would be equivalent to about seven years’ worth (in terms of time) of recent mortality progress (i.e., based on the slopes of Figure 2).
The reason for this modest difference is easy to see, at least in retrospect. If we could eradicate winter-related mortality, then it would be like living in the summer. To put it another way, people would experience their ‘summer equivalent age,’ as in the example above. Although reducing death rates by about 12% seems like a great thing, it only makes a small difference in equivalent age and, therefore, has a modest effect one(0). Mindel Sheps’s (1958) observation that changes in death rates usually are smaller when viewed through the lens of concomitant changes in survival rates, is highly relevant. The appreciable pseudoseasonal difference inMxresults in a rather modest difference ine(0)
because life expectancy is the integral of the life table`x, or survivor, column, not theMx
The insight from our approach lies not in the idea that elimination of seemingly major causes (in this case, approximated by pseudosummer) will have a small impact on
e(0). This is well understood; for example, Keyfitz (1985: 62–72) considers it in relation to the Shannon entropy,H, of the life table`xcolumn. Because of competing risks of,
say, heart disease, even eradicating cancer does not cause huge changes ine(0)(ibid.), so it is clear that removing winter deaths also won’t have a big effect. Vaupel’s study (1986) of the relation betweene(0)andMxis also relevant (see also Pollard 1982). The greater
mortality seasonality of women as measured by life expectancy differences (Figure 3) than as measured by the winter:summer proportional hazard (Figure 5), is consistent with this; the effect of a constant multiple ofMxaffectse(0)differently at different levels of
Mx. What the present study shows, however, is that the total mortality impact of winter
(viz., including knock-on effects on heart disease) is not very large in the grand scheme of things.
Another approach to estimating the role of viruses in all-cause mortality would be to use direct measures of viral circulation (as in Figure 1) instead of summer and winter as instrumental indicators. This would have the disadvantage of not being applicable to historical data. (Viral surveillance like that shown in Figure 1 begins in the late 1990s.) On the other hand, an advantage is that it could be applied to the tropics, where influenza circulation is more haphazard (see, e.g., Aungkulanon et al. 2015), and therefore the colinearity of flu season and ‘winter’ is neither an appropriate identification strategy nor a lurking problem. Using nominal influenza mortality as an instrument instead of the seasons is another possibility, but it is not without its problems (Noymer and Nguyen 2013). Our results are broadly consistent with other seasonal analyses of mortality in the United States, going back to Rosenwaike (1966), as well as more recent work (Feinstein 2002).
thus that the roots of seasonal mortality are misunderstood, although this seems unlikely given Figure 1 and other work (Hayward et al. 2014).
Using data from the entire United States is both a strength and limitation. If the intent is to draw conclusions regarding the whole United States, then using data from the entire country is clearly appropriate. Given the size and climatic diversity of the United States, idiosyncratic factors such as summer heat waves tend to get averaged out, which can be regarded as a positive given our focus on winter. However, the national approach also averages out the potentially interesting relation between winter temperature and the coefficient of seasonal variation in mortality that is seen in Europe (cf. the literature re-view).
5. Conclusion
It is reasonably well established that at least part of the reduction in cardiovascular mor-tality during the summer is due to the absence of influenza virus (Warren-Gash, Smeeth, and Hayward 2009; Warren-Gash et al. 2011). The connection between influenza vaccine use and reduction of wintertime heart mortality is less clear but has been studied (Seo et al. 2014). Influenza vaccine use is correlated with general health-seeking behavior, and so confounding is a problem in direct empirical approaches to this question. In this study, we took an indirect approach, using whole-population data, and summers as a sort of natural experiment. This quantifies the mortality impact of winter, not of influenza per se, which is smaller.
Progress is being made toward a much better flu vaccine (Keitel et al. 1997; Treanor 2004; Pica and Palese 2013). A universal flu vaccine (as such shots are called) is a clearly expressed public health desideratum (Fineberg 2014) but remains on the drawing board. Realistic expectations for mortality changes should be part of the policy analysis in this area. The mortality burden of winter, quantified herein, includes a number of factors of which influenza is only one; universal flu vaccines, even if successful, will have a modest impact on life expectancy.
6. Acknowledgments
References
˚
Astr¨om, D.O., Edvinsson, S., Hondula, D., Rockl¨ov, J., and Schumann, B. (2016). On the association between weather variability and total and cause-specific mortality before and during industrialization in Sweden. Demographic Research 35(33): 991–1010. doi:10.4054/DemRes.2016.35.33.
˚
Astr¨om, D.O., Forsberg, B., Edvinsson, S., and Rockl¨ov, J. (2013). Acute fatal effects of short-lasting extreme temperatures in Stockholm, Sweden: Evidence across a century of change. Epidemiology24(6): 820–829. doi:10.1097/01.ede.0000434530.62353.0b. Abdullatif, V.N. and Noymer, A. (2016). Clostridium difficile infection: An emerging cause of death in the twenty-first century. Biodemography and Social Biology62(2): 198–207.doi:10.1080/19485565.2016.1172957.
Agresti, A. (2002). Categorical data analysis. Hoboken: Wiley.
doi:10.1002/0471249688.
Analitis, A., Katsouyanni, K., Biggeri, A., Baccini, M., Forsberg, B., Bisanti, L., Kirch-mayer, U., Ballester, F., Cadum, E., Goodman, P.G., Hojs, A., Sunyer, J., Tiittanen, P., and Michelozzi, P. (2008). Effects of cold weather on mortality: Results from 15 Eu-ropean cities within the PHEWE project. American Journal of Epidemiology168(12): 1397–1408.doi:10.1093/aje/kwn266.
Anderson, B.G. and Bell, M.L. (2009). Weather-related mortality: How heat, cold, and heat waves affect mortality in the United States. Epidemiology20(2): 205–213. doi:10.1097/EDE.0b013e318190ee08.
Aungkulanon, S., Cheng, P.Y., Kusreesakul, K., Bundhamcharoen, K., Chittagan-pitch, M., Margaret, M., and Olsen, S. (2015). Influenza-associated mortality in Thailand, 2006–2011. Influenza and Other Respiratory Viruses 9(6): 298–304. doi:10.1111/irv.12344.
Bainton, D., Jones, G.R., and Hole, D. (1978). Influenza and ischaemic heart disease: A possible trigger for acute myocardial infarction? International Journal of Epidemiol-ogy7(3): 231–239.doi:10.1093/ije/7.3.231.
Basaga˜na, X., Sartini, C., Barrera-G´omez, J., Dadvand, P., Cunillera, J., Ostro, B., Sun-yer, J., and Medina-Ramon, M. (2011). Heat waves and cause-specific mortality at all ages. Epidemiology22(6): 765–772. doi:10.1097/EDE.0b013e31823031c5.
Basu, R. and Samet, J.M. (2002). Relation between elevated ambient temperature and mortality: A review of the epidemiologic evidence. Epidemiologic Reviews 24(2): 190–202.doi:10.1093/epirev/mxf007.
cold, and other weather events in the United States, 2006–2010. Hyatsville: Centers for Disease Control and Prevention. (National Health Statistics Reports 76).
Bhaskaran, K., Hajat, S., Haines, A., Herrett, E., Wilkinson, P., and Smeeth, L. (2009). Effects of ambient temperature on the incidence of myocardial infarction. Heart
95(21): 1760–1769.doi:10.1136/hrt.2009.175000.
Braga, A.L.F., Zanobetti, A., and Schwartz, J. (2001). The time course of weather-related deaths.Epidemiology12(6): 662–667.
Braga, A.L.F., Zanobetti, A., and Schwartz, J. (2002). The effect of weather on respiratory and cardiovascular deaths in 12 U.S. cities.Environmental Health Perspectives110(9): 859–863.doi:10.1097/00001648-200111000-00014.
Breschi, M. and Livi-Bacci, M. (1986a). Saison et climat comme contraintes de la survie des enfants: L’exp´erience italienne au XIXe si`ecle. Population41(1): 9–35. doi:10.2307/1532932.
Breschi, M. and Livi-Bacci, M. (1986b). Stagione di nascita e clima come determi-nanti della mortalit`a infantile negli stati sardi di terraferma. Genus42(1/2): 87–101. doi:10.2307/1533178.
Breschi, M. and Livi-Bacci, M. (1986c). Effets du climat sur la mortalit´e infantile: R´esultats pour la Savoie, le Pi´emont et la Ligurie en 1828–1837. Population41(6): 1072–1074.
Carmona, R., D´ıaz, J., Mir´on, I.J., Ortiz, C., Luna, M.Y., and Linares, C. (2016). Mor-tality attributable to extreme temperatures in Spain: A comparative analysis by city.
Environment International91: 22–28.doi:10.1016/j.envint.2016.02.018.
CDC (2015). Weekly U.S. Influenza Surveillance Report. Atlanta: Centers for Disease Control and Prevention.http://www.cdc.gov/flu/weekly/.
Chay, K., Dobkin, C., and Greenstone, M. (2003). The Clean Air Act of 1970 and adult mortality. Journal of Risk and Uncertainty 27(3): 279–300. doi:10.1023/A: 1025897327639.
Chay, K.Y. and Greenstone, M. (2003). The impact of air pollution on infant mortality: Evidence from geographic variation in pollution shocks induced by a recession. Quar-terly Journal of Economics118(3): 1121–1167.doi:10.1162/00335530360698513. Chay, K.Y. and Greenstone, M. (2005). Does air quality matter? Evidence from the
housing market.Journal of Political Economy113(2): 376–424.
Cleveland, W.S. and Graedel, T.E. (1979). Photochemical air pollution in the northeast United States.Science204(4399): 1273–1278.doi:10.1126/science.204.4399.1273. Crombie, D.L., Fleming, D.M., Cross, K.W., and Lancashire, R.J. (1995). Concurrence
of monthly variations of mortality related to underlying cause in Europe. Journal of Epidemiology and Community Health49(4): 373–378.doi:10.1136/jech.49.4.373. Currie, J. and Neidell, M. (2005). Air pollution and infant health: What can we learn from
California’s recent experience? Quarterly Journal of Economics120(3): 1003–1030. doi:10.1093/qje/120.3.1003.
Currie, J., Neidell, M., and Schmieder, J.F. (2009). Air pollution and infant health: Lessons from New Jersey. Journal of Health Economics 28(3): 688–703. doi:10.1016/j.jhealeco.2009.02.001.
Curriero, F.C., Heiner, K.S., Samet, J.M., Zeger, S.L., Strug, L., and Patz, J.A. (2002). Temperature and mortality in 11 cities of the eastern United States. American Journal of Epidemiology155(1): 80–87.doi:10.1093/aje/155.1.80.
Dalla-Zuanna, G. and Rosina, A. (2009). The fatal season: An analysis of extremely high winter neonatal mortality.Transylvanian Review18(1): 245–276.
Dalla-Zuanna, G. and Rosina, A. (2010). A note on: The joint effect of maternal mal-nutrition and cold weather on neonatal mortality in nineteenth-century Venice: An as-sessment of the hypothermia hypothesis,Population Studies63(3): 233–251 by Renzo Derosas.Population Studies64(2): 193–195. doi:10.1080/00324721003770807. Dalla-Zuanna, G. and Rosina, A. (2011). An analysis of extremely high
nineteenth-century winter neonatal mortality in a local context of northeastern Italy. European Journal of Population27(1): 33–55. doi:10.1007/s10680-010-9219-5.
Dentali, F., Manfredini, R., and Ageno, W. (2009). Seasonal variability of ve-nous thromboembolism. Current Opinion in Pulmonary Medicine15(5): 403–407. doi:10.1097/MCP.0b013e32832d867a.
Derosas, R. (2009). The joint effect of maternal malnutrition and cold weather on neona-tal morneona-tality in nineteenth-century Venice: An assessment of the hypothermia hypoth-esis. Population Studies63(3): 233–251. doi:10.1080/00324720903165449.
Derosas, R. (2010). Reply to the note by Dalla-Zuanna and Rosina. Population Studies
64(2): 197–198. doi:10.1080/00324721003770815.
Deschˆenes, O. and Greenstone, M. (2011). Climate change, mortality, and adaptation: Evidence from annual fluctuations in weather in the US.American Economic Journal: Applied Economics3(4): 152–185.doi:10.1257/app.3.4.152.
Review of Economics and Statistics91(4): 659–681. doi:10.1162/rest.91.4.659. D´ıaz, J., Garc´ıa, R., L´opez, C., Linares, C., Tob´ıas, A., and Prieto, L. (2005). Mortality
impact of extreme winter temperatures.International Journal of Biometeorology49(3): 179–183.doi:10.1007/s00484-004-0224-4.
Douglas, Jr., R.G., Lindgren, K.M., and Couch, R.B. (1968). Exposure to cold envi-ronment and rhinovirus common cold. New England Journal of Medicine279(14): 742–747.doi:10.1056/NEJM196810032791404.
Dowell, S.F. (2001). Seasonal variation in host susceptibility and cycles of certain infectious diseases. Emerging Infectious Diseases 7(3): 369–374. doi:10.3201/eid0703.017301.
Dowling, H.F., Jackson, G.G., Spiesman, I.G., and Inouye, T. (1958). Transmission of the common cold to volunteers under controlled conditions: III: The effect of chill-ing of the subjects upon susceptibility. American Journal of Hygiene68(1): 59–65. doi:10.1093/oxfordjournals.aje.a119949.
Dushoff, J., Plotkin, J.B., Levin, S.A., and Earn, D.J.D. (2004). Dynamical reso-nance can account for seasonality of influenza epidemics. Proceedings of the Na-tional Academy of Sciences of the United States of America101(48): 16915–16916. doi:10.1073/pnas.0407293101.
Eccles, R. and Wilkinson, J.E. (2015). Exposure to cold and acute upper respiratory tract infection.Rhinology53(2): 99–106.doi:10.4193/Rhino14.239.
Ekamper, P., van Poppel, F., van Duin, C., and Garssen, J. (2009). 150 years of temperature-related excess mortality in the Netherlands. Demographic Research
21(14): 385–426.doi:10.4054/DemRes.2009.21.14.
Farmer, C.M. and Williams, A.F. (2005). Temporal factors in motor vehicle crash deaths.
Injury Prevention11(1): 18–23.doi:10.1136/ip.2004.005439.
Feinstein, C.A. (2002). Seasonality of deaths in the U.S. by age and cause.Demographic Research6(17): 469–486.doi:10.4054/DemRes.2002.6.17.
Fineberg, H.V. (2014). Pandemic preparedness and response: Lessons from the H1N1 influenza of 2009. New England Journal of Medicine370(14): 1335–1342. doi:10.1056/NEJMra1208802.
Fisman, D. (2012). Seasonality of viral infections: Mechanisms and unknowns. Clinical Microbiology and Infection18(10): 946–954.doi:10.1111/j.1469-0691.2012.03968.x. Footitt, J. and Johnston, S.L. (2009). Cough and viruses in airways disease:
Mechanisms. Pulmonary Pharmacology and Therapeutics 22(2): 108–113.
Foster, E.D., Cavanaugh, J.E., Haynes, W.G., Yang, M., Gerke, A.K., Tang, F., and Polgreen, P.M. (2013). Acute myocardial infarctions, strokes and influenza: Seasonal and pandemic effects. Epidemiology and Infection 141(4): 735–744. doi:10.1017/S0950268812002890.
Foxman, E.F., Storer, J.A., Fitzgerald, M.E., Wasik, B.R., Hou, L., Zhao, H., Turner, P.E., Pyle, A.M., and Iwasaki, A. (2015). Temperature-dependent innate defense against the common cold virus limits viral replication at warm temperature in mouse airway cells.Proceedings of the National Academy of Sciences of the United States of America
112(3): 827–832.doi:10.1073/pnas.1411030112.
Foxman, E.F., Storer, J.A., Vanaja, K., Levchenko, A., and Iwasaki, A. (2016). Two interferon-independent double-stranded RNA-induced host defense strategies suppress the common cold virus at warm temperature. Proceedings of the Na-tional Academy of Sciences of the United States of America 113(30): 8496–8501. doi:10.1073/pnas.1601942113.
Galloway, P.R. (1985). Annual variations in deaths by age, deaths by cause, prices, and weather in London 1670 to 1830. Population Studies 39(3): 487–505. doi:10.1080/0032472031000141646.
Gasparrini, A., Guo, Y., Hashizume, M., Lavigne, E., Zanobetti, A., Schwartz, J., Tobias, A., Tong, S., Rockl¨ov, J., Forsberg, B., Leone, M., Sario, M.D., Bell, M.L., Guo, Y.L.L., Wu, C., Kan, H., Yi, S.M., de Sousa Zanotti Stagliorio Coelho, M., Saldiva, P.H.N., Honda, Y., Kim, H., and Armstrong, B. (2015). Mortality risk attributable to high and low ambient temperature: A multicountry observational study. Lancet
386(9991): 369–375.doi:10.1016/S0140-6736(14)62114-0.
Glezen, W.P., Decker, M., Joseph, S.W., and Mercready, R.G. (1987). Acute respira-tory disease associated with influenza epidemics in Houston, 1981–1983. Journal of Infectious Diseases155(6): 1119–1126.doi:10.1093/infdis/155.6.1119.
Goldstein, E., Viboud, C., Charu, V., and Lipsitch, M. (2012). Improving the estimation of influenza-related mortality over a seasonal baseline.Epidemiology23(6): 829–838. doi:10.1097/EDE.0b013e31826c2dda.
Graham, N.M.H. (1990). The epidemiology of acute respiratory infections in chil-dren and adults: A global perspective. Epidemiologic Reviews 12: 149–178. doi:10.1093/oxfordjournals.epirev.a036050.
Hajat, S., Kovats, R.S., and Lachowycz, K. (2007). Heat-related and cold-related deaths in England and Wales: Who is at risk? Occupational and Environmental Medicine
64(2): 93–100.doi:10.1136/oem.2006.029017.
Hayward, A.C., Fragaszy, E.B., Bermingham, A., Wang, L., Copas, A., Edmunds, W.J., Ferguson, N., Goonetilleke, N., Harvey, G., Kovar, J., Lim, M.S.C., McMichael, A., Millett, E.R.C., Nguyen-Van-Tam, J.S., Nazareth, I., Pebody, R., Tabassum, F., Wat-son, J.M., Wurie, F.B., JohnWat-son, A.M., and Zambon, M. (2014). Comparative com-munity burden and severity of seasonal and pandemic influenza: Results of the Flu Watch cohort study.Lancet Respiratory Medicine2(6): 445–454. doi:10.1016/S2213-2600(14)70034-7.
Healy, J.D. (2003). Excess winter mortality in Europe: A cross country analysis identify-ing key risk factors.Journal of Epidemiology and Community Health57(10): 784–789. doi:10.1136/jech.57.10.784.
Holick, M.F. (2007). Vitamin D deficiency. New England Journal of Medicine357(3): 266–281.doi:10.1056/NEJMra070553.
Human Mortality Database (2016). Berkeley and Rostock: Department of Demography at the University of California and Max Planck Institute for Demographic Research. http://www.mortality.org/.
Huy, C., Kuhn, D., Schneider, S., and Z¨ollner, I. (2012). Seasonal waves of influenza and cause-specific mortality in Germany.Central European Journal of Medicine7(4): 450–456.doi:10.2478/s11536-012-0017-9.
Huynen, M.M.T.E., Martens, P., Schram, D., Weijenberg, M.P., and Kunst, A.E. (2001). The impact of heat waves and cold spells on mortality rates in the Dutch population.
Environmental Health Perspectives109(5): 463–470.doi:10.1289/ehp.01109463. Ik¨aheimo, T.M., Jaakkola, K., Jokelainen, J., Saukkoriipi, A., Roivainen, M., Juvonen,
R., Vainio, O., and Jaakkola, J.J.K. (2016). A decrease in temperature and humid-ity precedes human rhinovirus infections in a cold climate. Viruses8(244): 1–10. doi:10.3390/v8090244.
Janh¨all, S., Olofson, K.F.G., Andersson, P.U., Pettersson, J.B.C., and Hallquist, M. (2006). Evolution of the urban aerosol during winter temperature inversion episodes.
Atmospheric Environment40(28): 5355–5366.doi:10.1016/j.atmosenv.2006.04.051. Johnston, F.H., Hanigan, I.C., Henderson, S.B., and Morgan, G.G. (2013). Evaluation
of interventions to reduce air pollution from biomass smoke on mortality in Launces-ton, Australia: Retrospective analysis of daily mortality, 1994–2007. British Medical Journal346: e8446. doi:10.1136/bmj.e8446.
C.H. (2007). The effect of the 1995 heat wave in Chicago on all-cause and cause-specific mortality. American Journal of Public Health 97(S1): S158–S162. doi:10.2105/AJPH.2006.100081.
Kalkstein, L.S. and Davis, R.E. (1989). Weather and human mortality: An eval-uation of demographic and interregional responses in the United States. Annals of the Association of American Geographers 79(1): 44–64. doi:10.1111/j.1467-8306.1989.tb00249.x.
Kasahara, A.K., Singh, R.J., and Noymer, A. (2013). Vitamin D (25OHD) serum season-ality in the United States.PLoS One8(6): e65785.doi:10.1371/journal.pone.0065785. Keatinge, W.R., Coleshaw, S.R.K., Cotter, F., Mattock, M., Murphy, M., and Chel-liah, R. (1984). Increases in platelet and red cell counts, blood viscosity, and ar-terial pressure during mild surface cooling: Factors in mortality from coronary and cerebral thrombosis in winter. British Medical Journal 289(6456): 1405–1408. doi:10.1136/bmj.289.6456.1405.
Keatinge, W.R., Donaldson, G.C., Bucher, K., Jendritsky, G., Cordioli, E., Martinelli, M., Dardanoni, L., Katsouyanni, K., Kunst, A.E., Mackenbach, J.P., McDonald, C., Nayha, S., and Vuori, I. (1997). Cold exposure and winter mortality from ischaemic heart dis-ease, cerebrovascular disdis-ease, respiratory disdis-ease, and all causes in warm and cold re-gions of Europe.Lancet349(9062): 1341–1346. doi:10.1016/S0140-6736(96)12338-2.
Keatinge, W.R., Donaldson, G.C., Cordioli, E., Martinelli, M., Kunst, A.E., Macken-bach, J.P., Nayha, S., and Vuori, I. (2000). Heat related mortality in warm and cold regions of Europe: Observational study.British Medical Journal321(7262): 670–673. doi:10.1136/bmj.321.7262.670.
Keatinge, W.R., Coleshaw, S.R.K., Easton, J.C., Cotter, F., Mattock, M.B., and Chelliah, R. (1986). Increased platelet and red cell counts, blood viscosity, and plasma choles-terol levels during heat stress, and mortality from coronary and cerebral thrombosis.
American Journal of Medicine81(5): 795–800. doi:10.1016/0002-9343(86)90348-7. Keitel, W.A., Cate, T.R., Couch, R.B., Huggins, L.L., and Hesst, K.R. (1997). Efficacy
of repeated annual immunization with inactivated influenza virus vaccines over a five year period. Vaccine15(10): 1114–1122.doi:10.1016/S0264-410X(97)00003-0. Keyfitz, N. and Littman, G. (1979). Mortality in a heterogeneous population. Population
Studies33(2): 333–342.doi:10.1080/00324728.1979.10410448.
Keyfitz, N. (1970). Finding probabilities from observed rates, or how to make a life table.
American Statistician24(1): 28–33.
doi:10.1007/978-1-4757-1879-9.
Klinenberg, E. (2002). Heat wave: A social autopsy of disaster in Chicago. Chicago: University of Chicago Press. doi:10.7208/chicago/9780226026718.001.0001.
Knight, J., Schilling, C., Barnett, A., Jackson, R., and Clarke, P. (2016). Revisiting the ‘Christmas holiday effect’ in the southern hemisphere. Journal of the American Heart Association5(12): e005098. doi:10.1161/JAHA.116.005098.
Kunst, A.E., Looman, C.W.N., and Mackenbach, J.P. (1991). The decline in winter excess mortality in the Netherlands. International Journal of Epidemiology20(4): 971–977. doi:10.1093/ije/20.4.971.
Kunst, A.E., Looman, C.W.N., and Mackenbach, J.P. (1993). Outdoor air temperature and mortality in the Netherlands: A time-series analysis. American Journal of Epi-demiology137(3): 331–341.doi:10.1093/oxfordjournals.aje.a116680.
Kysely, J., Pokorna, L., Kyncl, J., and Kriz, B. (2009). Excess cardiovascular mortal-ity associated with cold spells in the Czech Republic. BMC Public Health9(1): 19. doi:10.1186/1471-2458-9-19.
Land, K.C. and Cantor, D. (1983). ARIMA models of seasonal variation in U.S. birth and death rates. Demography20(4): 541–568. doi:10.2307/2061119.
Lofgren, E., Fefferman, N.H., Naumov, Y.N., Gorski, J., and Naumova, E.N. (2007). Influenza seasonality: Underlying causes and modeling theories. Journal of Virology
81(11): 5429–5436.doi:10.1128/JVI.01680-06.
Lowen, A.C., Mubareka, S., Steel, J., and Palese, P. (2007). Influenza virus transmis-sion is dependent on relative humidity and temperature. PLoS Pathogens3(10): e151. doi:10.1371/journal.ppat.0030151.
Mackenbach, J.P., Kunst, A.E., and Looman, C.W. (1992). Seasonal variation in mortality in the Netherlands. Journal of Epidemiology and Community Health46(3): 261–265. doi:10.1136/jech.46.3.261.
Mackenbach, J.P., Looman, C.W., and Kunst, A.E. (1993). Air pollution, lagged effects of temperature, and mortality: The Netherlands 1979–87. Journal of Epidemiology and Community Health47(2): 121–126. doi:10.1136/jech.47.2.121.
Madjid, M., Aboshady, I., Awan, I., Litovsky, S., and Casscells, S.W. (2004). Influenza and cardiovascular disease: Is there a causal relationship? Texas Heart Institute Jour-nal31(1): 4–13.
Respiratory Medicine103(3): 456–462.doi:10.1016/j.rmed.2008.09.011.
Manton, K.G., Stallard, E., and Vaupel, J.W. (1986). Alternative models for the het-erogeneity of mortality risks among the aged. Journal of the American Statistical Association81(395): 635–644. doi:10.1080/01621459.1986.10478316.
Mercer, J.B. (2003). Cold: An underrated risk factor for health.Environmental Research
92(1): 8–13.doi:10.1016/S0013-9351(02)00009-9.
Mourtzoukou, E.G. and Falagas, M.E. (2007). Exposure to cold and respiratory tract infections.International Journal of Tuberculosis and Lung Disease11(9): 938–943. National Center for Health Statistics (2015). Mortality multiple
cause-of-death data files. Atlanta: National Center for Health Statistics. http://www.cdc.gov/nchs/nvss/mortality public use data.htm.
Newall, A.T., Viboud, C., and Wood, J.G. (2010). Influenza-attributable mortality in Australians aged more than 50 years: A comparison of different modelling approaches.
Epidemiology and Infection138(6): 836–842.doi:10.1017/S095026880999118X. Noymer, A. and Nguyen, A.M. (2013). Influenza as a proportion of pneumonia
mortal-ity: United States, 1959–2009. Biodemography and Social Biology59(2): 178–190. doi:10.1080/19485565.2013.833816.
Nunes, B., Nat´ario, I., and Carvalho, M.L. (2011). Time series methods for obtaining excess mortality attributable to influenza epidemics. Statistical Methods in Medical Research20(4): 331–345.doi:10.1177/0962280209340201.
Olofson, K.F.G., Andersson, P.U., Hallquist, M., Ljungstr¨om, E., Tang, L., Chen, D., and Pettersson, J.B.C. (2009). Urban aerosol evolution and particle formation dur-ing wintertime temperature inversions. Atmospheric Environment 43(2): 340–346. doi:10.1016/j.atmosenv.2008.09.080.
Otrachshenko, V., Popova, O., and Solomin, P. (2017). Health
conse-quences of the Russian weather. Ecological Economics 132: 290–306.
doi:10.1016/j.ecolecon.2016.10.021.
Pampel, F.C. (2001). Gender equality and the sex differential in mortality from acci-dents in high income nations.Population Research and Policy Review20(5): 397–421. doi:10.1023/A:1013307620643.
Pan, W.H., Li, L.A., and Tsai, M.J. (1995). Temperature extremes and mortality from coronary heart disease and cerebral infarction in elderly Chinese. Lancet345(8946): 353–355.doi:10.1016/S0140-6736(95)90341-0.
doi:10.1016/j.socscimed.2010.07.024.
Phillips, D.P., Jarvinen, J.R., Abramson, I.S., and Phillips, R.R. (2004). Car-diac mortality is higher around Christmas and New Year’s than at any other time: The holidays as a risk factor for death. Circulation 110(25): 3781–3788. doi:10.1161/01.CIR.0000151424.02045.F7.
Pica, N. and Palese, P. (2013). Toward a universal influenza virus vaccine: Prospects and challenges. Annual Review of Medicine 64(1): 189–202. doi:10.1146/annurev-med-120611-145115.
Pollard, J.H. (1982). The expectation of life and its relationship to mortality. Journal of the Institute of Actuaries109(2): 225–240.doi:10.1017/S0020268100036258. Preston, S.H., Heuveline, P., and Guillot, M. (2001).Demography: Measuring and
mod-eling population processes. Oxford: Blackwell.
Rau, R. (2004). Winter mortality in elderly people in Britain: Lack of social gradient in winter excess mortality is obvious in Denmark. British Medical Journal329(7472): 976–977.doi:10.1136/bmj.329.7472.976-b.
Rau, R. (2006). Seasonality in human mortality: A demographic approach. Berlin: Springer.
Rau, R. and Doblhammer, G. (2003). Seasonal mortality in Denmark: The role of sex and age.Demographic Research9(9): 197–222.doi:10.4054/DemRes.2003.9.9. Reichert, T.A., Simonsen, L., Sharma, A., Pardo, S.A., Fedson, D.S., and Miller, M.A.
(2004). Influenza and the winter increase in mortality in the United States, 1959–1999.
American Journal of Epidemiology160(5): 492–502.doi:10.1093/aje/kwj227. Rey, G., Fouillet, A., Jougla, E., and H´emon, D. (2007). Heat waves, ordinary
temper-ature fluctuations and mortality in France since 1971. Population 62(3): 457–485. doi:10.3917/pope.703.0457.
Robine, J.M., Michel, J.P., and Herrmann, F.R. (2012). Excess male mortality and age-specific mortality trajectories under different mortality conditions: A lesson from the heat wave of summer 2003.Mechanisms of Ageing and Development133(6): 378–386. doi:10.1016/j.mad.2012.04.004.
Rockl¨ov, J., Ebi, K., and Forsberg, B. (2011). Mortality related to tempera-ture and persistent extreme temperatempera-tures: A study of cause-specific and age-stratified mortality. Occupational and Environmental Medicine 68(7): 531–536. doi:10.1136/oem.2010.058818.
Epidemiology and Community Health52(8): 482–486.doi:10.1136/jech.52.8.482. Rosenberg, H.M. (1966). Recent developments in seasonally adjusting vital statistics.
Demography3(2): 305–318.doi:10.2307/2060160.
Rosenwaike, I. (1966). Seasonal variation of deaths in the United States, 1951–1960.
Journal of the American Statistical Association61(315): 706–719.
Schoen, R. (1970). The geometric mean of the age-specific death rates as a summary index of mortality. Demography7(3): 317–324.doi:10.2307/2060150.
Schwartz, J. and Dockery, D.W. (1992). Increased mortality in Philadelphia associ-ated with daily air pollution concentrations. American Review of Respiratory Disease
145(3): 600–604.doi:10.1164/ajrccm/145.3.600.
Seo, Y.B., Choi, W.S., Baek, J.H., Lee, J., Song, J.Y., Lee, J.S., Cheong, H.J., and Kim, W.J. (2014). Effectiveness of the influenza vaccine at preventing hospitalization due to acute exacerbation of cardiopulmonary disease in Korea from 2011 to 2012. Human Vaccines and Immunotherapeutics10(2): 423–427.doi:10.4161/hv.26858.
Seretakis, D., Lagiou, P., Lipworth, L., Signorello, L.B., Rothman, K.J., and Tri-chopoulos, D. (1997). Changing seasonality of mortality from coronary heart disease. Journal of the American Medical Association 278(12): 1012–1014. doi:10.1001/jama.1997.03550120072036.
Shaman, J. and Kohn, M. (2009). Absolute humidity modulates influenza survival, trans-mission, and seasonality. Proceedings of the National Academy of Sciences of the United States of America106(9): 3243–3248.doi:10.1073/pnas.0806852106.
Sheps, M.C. (1958). Shall we count the living or the dead? New England Journal of Medicine259(25): 1210–1214. doi:10.1056/NEJM195812182592505.
Sheth, T., Nair, C., Muller, J., and Yusuf, S. (1999). Increased winter mortality from acute myocardial infarction and stroke: The effect of age. Journal of the American College of Cardiology33(7): 1916–1919. doi:10.1016/S0735-1097(99)00137-0.
Simonsen, L., Reichert, T.A., Viboud, C., Blackwelder, W.C., Taylor, R.J., and Miller, M.A. (2005). Impact of influenza vaccination on seasonal mortality in the US elderly population. Archives of Internal Medicine 165(3): 265–272. doi:10.1001/archinte.165.3.265.
Stafoggia, M., Forastiere, F., Agostini, D., Biggeri, A., Bisanti, L., Cadum, E., Caranci, N., de’Donato, F., De Lisio, S., De Maria, M., Michelozzi, P., Miglio, R., Pandolfi, P., Picciotto, S., Rognoni, M., Russo, A., Scarnato, C., and Perucci, C.A. (2006). Vulnera-bility to heat-related mortality: A multicity, population-based, case-crossover analysis.
Stewart, Q.T. (2011). The cause-deleted index: Estimating cause of death contributions to mortality. Mathematical Population Studies 18(4): 234–257. doi:10.1080/08898480.2011.614496.
Tang, C.H., Coull, B.A., Schwartz, J., Di, Q., and Koutrakis, P. (2017). Trends and spatial patterns of fine-resolution aerosol optical depth-derived PM2.5emissions in the northeast United States from 2002 to 2013.Journal of the Air and Waste Management Association67(1): 64–74. doi:10.1080/10962247.2016.1218393.
te Beest, D.E., van Boven, M., Hooiveld, M., van den Dool, C., and Wallinga, J. (2013). Driving factors of influenza transmission in the Netherlands. American Journal of Epidemiology178(9): 1469–1477.doi:10.1093/aje/kwt132.
Thompson, W.W., Weintraub, E., Dhankhar, P., Cheng, P.Y., Brammer, L., Meltzer, M.I., Bresee, J.S., and Shay, D.K. (2009). Estimates of US influenza-associated deaths made using four different methods. Influenza and Other Respiratory Viruses3(1): 37–49. doi:10.1111/j.1750-2659.2009.00073.x.
Toulemon, L. and Barbieri, M. (2008). The mortality impact of the August 2003 heat wave in France: Investigating the ‘harvesting’ effect and other long-term con-sequences. Population Studies62(1): 39–53.doi:10.1080/00324720701804249. Treanor, J. (2004). Influenza vaccine: Outmaneuvering antigenic shift and drift. New
England Journal of Medicine350(3): 218–220.doi:10.1056/NEJMp038238.
Treanor, J.J. (2016). Influenza vaccination. New England Journal of Medicine375(13): 1261–1268.doi:10.1056/NEJMcp1512870.
Udell, J.A., Zawi, R., Bhatt, D.L., Keshtkar-Jahromi, M., Gaughran, F., Phrommintikul, A., Ciszewski, A., Vakili, H., Hoffman, E.B., Farkouh, M.E., and Cannon, C.P. (2013). Association between influenza vaccination and cardiovascular outcomes in high-risk patients: A meta-analysis. Journal of the American Medical Association310(16): 1711–1720.doi:10.1001/jama.2013.279206.
Valleron, A.J. and Boumendil, A. (2004). ´Epid´emiologie et canicules: Analyses de la vague de chaleur 2003 en France. Comptes Rendus Biologies327(12): 1125–1141. doi:10.1016/j.crvi.2004.09.009.
van Rossum, C.T.M., Shipley, M.J., Hemingway, H., Grobbee, D.E., Mackenbach, J.P., and Marmot, M.G. (2001). Seasonal variation in cause-specific mortality: Are there high-risk groups? 25-year follow-up of civil servants from the first Whitehall study.
International Journal of Epidemiology30(5): 1109–1116. doi:10.1093/ije/30.5.1109. Vaupel, J.W. (1986). How change in age-specific mortality affects life expectancy.
Vaupel, J.W., Manton, K.G., and Stallard, E. (1979). The impact of heterogeneity in individual frailty on the dynamics of mortality. Demography 16(3): 439–454. doi:10.2307/2061224.
Vaupel, J.W. and Yashin, A.I. (1985). The deviant dynamics of death in heterogeneous populations. Sociological Methodology15: 179–211.doi:10.2307/270850.
Warren-Gash, C., Bhaskaran, K., Hayward, A., Leung, G.M., Lo, S.V., Wong, C.M., Ellis, J., Pebody, R., Smeeth, L., and Cowling, B.J. (2011). Circulating influenza virus, climatic factors, and acute myocardial infarction: A time series study in Eng-land and Wales and Hong Kong. Journal of Infectious Diseases203(12): 1710–1718. doi:10.1093/infdis/jir171.
Warren-Gash, C., Hayward, A.C., Hemingway, H., Denaxas, S., Thomas, S.L., Tim-mis, A.D., Whitaker, H., and Smeeth, L. (2012). Influenza infection and risk of acute myocardial infarction in England and Wales: A CALIBER self-controlled case series study. Journal of Infectious Diseases206(11): 1652–1659. doi:10.1093/infdis/jis597. Warren-Gash, C., Smeeth, L., and Hayward, A.C. (2009). Influenza as a trigger for
acute myocardial infarction or death from cardiovascular disease: A systematic review.
Lancet Infectious Diseases9(10): 601–610. doi:10.1016/S1473-3099(09)70233-6. Webster, R.G., Bean, W.J., Gorman, O.T., Chambers, T.M., and Kawaoka, Y. (1992).
Evolution and ecology of influenza A viruses. Microbiological Reviews56(1): 152– 179.
Wilkinson, P., Pattenden, S., Armstrong, B., Fletcher, A., Kovats, R.S., Mangtani, P., and McMichael, A.J. (2004). Vulnerability to winter mortality in elderly peo-ple in Britain: Population based study. British Medical Journal 329(7467): 647. doi:10.1136/bmj.38167.589907.55.
Woods, R.I., Watterson, P.A., and Woodward, J.H. (1989). The causes of rapid infant mortality decline in England and Wales, 1861–1921. Part II.Population Studies43(1): 113–132.doi:10.1080/0032472031000143876.
Yang, J., Ou, C.Q., Ding, Y., Zhou, Y.X., and Chen, P.Y. (2012). Daily temperature and mortality: A study of distributed lag non-linear effect and effect modification in Guangzhou.Environmental Health11(1): 63.doi:10.1186/1476-069X-11-63. Yang, J., Yin, P., Zhou, M., Ou, C.Q., Li, M., Li, J., Liu, X., Gao, J., Liu, Y., Qin, R., Xu,
L., Huang, C., and Liu, Q. (2016). The burden of stroke mortality attributable to cold and hot ambient temperatures: Epidemiological evidence from China. Environment International92–93: 232–238.doi:10.1016/j.envint.2016.04.001.
Journal of Epidemiology109(2): 103–123.doi:10.1093/oxfordjournals.aje.a112666. Zhao, Z., Zhu, Y., and Tu, E.J.C. (2015). Daily mortality changes in Taiwan in the 1970s:
An examination of the relationship between temperature and mortality. Vienna Year-book of Population Research13: 71–90.doi:10.1553/populationyearbook2015s71. Z¨oller, B., Li, X., Ohlsson, H., Sundquist, J., and Sundquist, K. (2013). Age-and
sex-specific seasonal variation of venous thromboembolism in patients with and without family history: A nationwide family study in Sweden. Thrombosis and Haemostasis
Appendix: Denominator construction
The numerators (i.e., the death counts) are recorded monthly, so aggregation of these into pseudoseasons is completely straightforward. Our denominator, or exposure, val-ues (i.e., person-years at risk) come from the Human Mortality Database (HMD), and are for calendar years. To recast these into pseudoseasons, we followed the following graduation/aggregation procedure.
The HMD exposure values for each year are centered at mid-year (i.e., July 1st), and are one year (of time) wide. We interpolated these values between consecutive Julys by fitting an exponential function using the two July 1st values, K0 andK1. That is to say, we estimate the functionKt = K0exp(rt)whereKtis the calendar-year-wide
exposure, centered at an arbitrary time,K0is the earlier of the two July 1st exposures,
tis time since July 1st, andris the growth rate, which works out tolog(K1/K0). We did this repeatedly, always estimatingrfrom the two July 1st values that sandwich the months being interpolated. While it is possible to fitrfrom three or more Julys, doing it pairwise ensures that the fitted curve passes through bothK0andK1. The goal here
is interpolation, not smoothing, so by repeatedly fitting off two points we stick as close as possible to the data. As described so far, the procedure producesKtvalues centered
on any month desired, but these are still one year wide, each. These values were then adjusted to months by multiplying by 31/365 for January, 28/365 for February, and so on. In leap years, 31/366, 29/366, . . . , were used.