University of New Orleans University of New Orleans
ScholarWorks@UNO
ScholarWorks@UNO
University of New Orleans Theses and
Dissertations Dissertations and Theses
Spring 5-19-2017
Political Contributions and Firm Performance: Evidence from
Political Contributions and Firm Performance: Evidence from
Lobbying and Campaign Donations
Lobbying and Campaign Donations
Omer Unsal
University of New Orleans, omunsal@gmail.com
Follow this and additional works at: https://scholarworks.uno.edu/td
Part of the Corporate Finance Commons
Recommended Citation Recommended Citation
Unsal, Omer, "Political Contributions and Firm Performance: Evidence from Lobbying and Campaign Donations" (2017). University of New Orleans Theses and Dissertations. 2361.
https://scholarworks.uno.edu/td/2361
This Dissertation is protected by copyright and/or related rights. It has been brought to you by ScholarWorks@UNO with permission from the rights-holder(s). You are free to use this Dissertation in any way that is permitted by the copyright and related rights legislation that applies to your use. For other uses you need to obtain permission from the rights-holder(s) directly, unless additional rights are indicated by a Creative Commons license in the record and/ or on the work itself.
Political Contributions and Firm Performance: Evidence from Lobbying and Campaign Donations
A Dissertation
Submitted to the Graduate Faculty of the University of New Orleans In partial fulfillment of the Requirements for the degree of
Doctor of Philosophy in
Financial Economics
By Omer Unsal
B.A. Yildiz Teknik University, 2011 M.B.A. Western Michigan University 2013
ii
iii
Dedication
iv
Acknowledgement
v
Table of Contents
List of Tables ... vii
Abstract ... viii
Chapter 1 ... 1
1. Introduction ... 1
2. Literature Review ... 4
3. Methodology ... 6
4. Data Description ... 9
4.1) Firm Data ... 9
4.2) Political Contributions ... 9
4.3) Lobbying Information ... 10
5. Empirical Results ... 15
5.1) Lobbying Activity of Politically Diverse Managers ... 15
5.2) Association between lobbying and CEO Political Ideology ... 18
5.3) Association between lobbying and CEO incentives ... 22
5.4) Association between lobbying and firm performance ... 24
6. Conclusion ... 38
REFERENCES ... 40
Chapter 2 ... 45
1. Introduction ... 45
2. Literature Review ... 49
3. Data Description ... 51
3.1) Firm Data ... 51
3.2) Event Study ... 52
3.3) Litigation Data ... 52
3.4) Violations, Inspections, and Other Disputes ... 52
3.5) Lobbying Information ... 53
3.6) CEO Political Contribution ... 53
3.7) Firm Political Contribution: Political Action Committee (PAC) ... 53
4. Methodology ... 59
4.1) Litigation, Lobbying, and Firm Performance ... 59
4.2) Robustness Check ... 63
vi
5.1) Lobbying Activity and Labor Relations ... 65
5.2) Association between lobbying and litigation risk ... 68
5.3) Association between lobbying, litigation outcome, and firm performance ... 71
6. Conclusion ... 101
REFERENCE ... 102
Appendices ... 106
Appendix A: Definition of Variables ... 106
Appendix B: Definition of Variables ... 111
vii
List of Tables
Chapter 1 ... 1
Table 1 ... 11
Table 2 ... 12
Table 3 ... 14
Table 4 ... 16
Table 5 ... 19
Table 6 ... 20
Table 7 ... 25
Table 8 ... 27
Table 9 ... 30
Table 10 ... 35
Table 11 ... 37
Chapter 2 ... 45
Table 1 ... 55
Table 2 ... 66
Table 3 ... 69
Table 4 ... 72
Table 5 ... 74
Table 6 ... 78
Table 7 ... 83
Table 8 ... 86
Table 9 ... 89
Table 10 ... 91
Table 11 ... 93
Table 12 ... 95
Table 13 ... 97
Table 14 ... 99
viii
Abstract
The following dissertation contains two distinct empirical essays which contribute to the overall field of Financial Economics. Chapter 1 titles as “Corporate Lobbying, CEO Political Ideology and Firm Performance”. We investigate the influence of CEO political orientation on corporate lobbying efforts. Specifically, we study whether CEO political ideology, in terms of manager-level campaign donations, determines the choice and amount of firm lobbying involvement and the impact of lobbying on firm value. We find a generous engagement in lobbying efforts by firms with Republican leaning-managers, which lobby a larger number of bills and have higher lobbying expenditures. However, the cost of lobbying offsets the benefit for firms with Republican CEOs. We report higher agency costs of free cash flow, lower Tobin’s Q, and smaller increases in buy and hold abnormal returns following lobbying activities for firms with Republican managers, compared to Democratic and Apolitical rivals. Overall, our results suggest that the effects of lobbying on firm performance vary across firms with different managerial political orientations. Chapter 2 titled as “Corporate Lobbying and Labor Relations: Evidence from Employee” Litigations. We utilize employee litigations and other work-related complaints to examine if lobbying firms are favored in judicial process. We gather 27,794 employee lawsuits (after initial court hearing) between 2000 and 2014 and test the relationship between employee allegations and firms’ lobbying strategies. We find that employee litigations increase the number of labor-related bills in our sample. We document that the increase in employee lawsuits may drive firms into lobbying to change policy proposals. We also find robust evidence that the case outcome is different for lobbying firms compared to non-lobbying rivals, which may protect the shareholder wealth in the long run. Our results present that lobbying activities may make a significant difference in employee allegations. Our findings highlight the benefit of building political capital to obtain a biased outcome in favor of politically-connected firms.
1
Chapter 1
Corporate Lobbying, CEO Political Ideology and Firm Performance
1. Introduction
2
Manager political orientation affects both firm performance and firm-level decision making processes. For example, Republican managers apply financially conservative policies (Hutton et al. 2014), and Democrat managers are more socially responsible (Di Giuli and Kostovetsky, 2014). Therefore, we hypothesize that manager political ideology could also explain the entry decision to lobbying activities, as well as the amount of involvement in lobbying itself.
One possible explanation of a relation between manager political ideology and corporate policy and lobbying decisions is that the manager’s political ideology is consistent with the goals of the firm, and managers are selected to fulfill those goals. Therefore, the manager’s personal political interests are aligned with those of the firm, managers conduct optimal lobbying actions, agency costs are low, and there is the potential for the firm to benefit from corporate lobbying. On the other hand, it may be the case that the existence of agency costs induces managers to enact lobbying policies that are sub-optimal. For example, the manager’s personal political convictions, whether aligned with those of the firm or not, may cause the manager to overinvest in lobbying activities at the expense of shareholders. As a result, lobbing expenditures and agency costs increase, causing firm value to decline. Agency costs under these circumstances would be highest for firms with weak governance. Finally, there are many CEOs and firms that contribute to candidates and issues of both political parties. In this case, managers may see investing in political capital across both parties as a hedge against future policy actions that may harm the firm. In this case, the ultimate effect of firm lobbying activities on firm value is unclear.
3
Our sample consists of 2,503 unique firms and 4,585 distinct CEOs from the Compustat Executive Compensation (ExecuComp) database between 2000 and 2012, and we find strong evidence that corporate lobbying outcomes vary in accordance with the political orientation of the managers. Initially, we find that firms with Republican-leaning CEOs are lobbying the greatest number of bills and issues, have relatively larger lobbying expenditures, and employ a higher number of lobbyists. Hutton et al. (2014) find that Republican managers make less risky corporate decisions, have less debt and leverage, hold less tangible assets, and make safer investments. Additionally, we document a generous engagement in lobbying efforts by Republican-leaning CEOs, who enact lobbying as an overall corporate strategy.
We next investigate whether the benefits of corporate lobbying drives the lobbying efforts. We focus on the CEO and board characteristics of lobbyist firms. We determine if lobbying introduces principal-agent problems, where the upper-level managers’ decisions are not in the shareholders’ interest (Jensen and Meckling, 1976). We find that lobbying CEOs earn higher compensation, i.e. total compensation, salary, and cash, compared to non-lobbying firm peers. In addition, lobbying CEOs have higher ownership in their firms and are associated with weaker governance, i.e. busy boards (Skaife et al., 2013). In this situation, if lobbying fails to create firm value, then only the managers, not the shareholders, would actually benefit from corporate lobbying efforts.
Finally, we estimate the relationship between firm performance and lobbying and show that firms with Republican-leaning CEOs experience relatively poorer firm performance in terms of decreases in Tobin’s Q, increases in agency conflicts, and the lowest increase in buy-and-hold abnormal returns, compared to firms with Democrat and Apolitical CEOs. On the other hand, the results reveal that lobbying has no effect on the Tobin’s Q and agency costs of firms with Democrat-leaning managers, and these firms yield positive abnormal returns. Our results imply that Democrat-leaning firms do experience some benefits from lobbying, while the increase in buy-and-hold abnormal returns seen by Republican-leaning lobbying firms comes at the cost of increased agency costs and reductions in Tobin’s Q.
4
political orientations. We find that some managers lobby even though firm value is not maximized. This finding provides evidence of a potential agency conflict, whereby excessive lobbying activity decreases shareholder wealth (Skaife et al., 2013). While lobbying expenditures spent by firms is not subject to any limit for legislative proposals, our findings may imply an optimal amount of political lobbying, whereby the firm will receive lobbying benefits up to a point, after which additional lobbying expenditures make the lobbying ineffective in raising firm value. This could suggest a hypothetical optimal lobbying expenditure for firms, and expenditure above that point will be a potential agency cost, not a benefit, to the firm.
The paper proceeds as follows. We provide a summary of existing literature on firm-level political engagement in section 2. Section 3 describes our methodology and research hypotheses. In Section 4, we present the data. In Section 5 we discuss our findings, and we conclude in section 6.
2. Literature Review
Lobbying is a strategic process in which corporations attempt to influence government officials and politicians. In 2012, organizations spent approximately $3.30 billion on lobbying efforts.1 Additionally, lobbying expenditures were nine times greater than individual political campaign donations (Kerr et al., 2011). Direct individual donations to politicians are limited to $5,000 per candidate per election cycle, while there is no restriction on the amount firms can spend on lobbying. 2.
Due to a potential agency problem, lobbying efforts should be implemented only if lobbying provides shareholder benefits. However, the managers of lobbyist firms can potentially expend firm resources, but fail to obtain better firm performance for the shareholders. When the agency costs of lobbying are low, lobbying may contribute the firm value by providing high excess returns (Mathur et al., 2013; Borghesi and Chang, 2012). Such an explanation of lobbying behavior is consistent with our results showing both Democrat-leaning and Apolitical CEOs engage in less lobbying by expending less on lobbying activities, compared to Republican-leaning CEOs. Lobbying efforts have the potential to modify official legislative acts, which could lead to changes in firm revenue, sales and expenditures, by providing tax policy benefits (Richter et al., 2009),
1 http://www.opensecrets.org/lobby/
5
influencing visa and trade policy (Kerr et al., 2011), or preventing corporate fraud detection (Yu and Yu, 2012). Lobbying is also found to be positively related to market and accounting measures of firm performance (Chen et al., 2015), serves shareholders’ interests by increasing firm value (Hill et al., 2013), promotes accounting conservatism (Kong et al., 2013), and increases firm value for corporations operating in heavily regulated industries (Agrawal and Knoeber, 2000).
Outperforming PAC donations, lobbying expenditures doubled between 1999 and 2006, when firms recognized the importance of effective lobbying (Blanes i Vidal et al., 2012). Subsequently, firms are found to increase their lobbying expenditure if the political geography shifts to an area that is not closely affiliated with the President (Antia et al., 2013). More importantly, firm lobbying actions are determined by the amount of entry cost (Bombardini, 2008).
The critical issue of firm involvement in politics is whether firms actually gain benefits from engagement. The main reason for firm lobbying is to access favor from the American political system (de Figueiredo and Richter, 2013). U.S. firms that make donations to political campaigns are found to have well established access to politicians (Kroszner and Stratmann, 1998). Additionally, lower agency costs of free cash flow are reported for politically diverse boards, with regard to their corporate PAC3 contributions (Kim et al., 2013). Similarly, PAC contributing firms are reported to exhibit better stock performance, while helping corporations develop a relationship with politicians (Goldman et al., 2009), which again yield to positive stock price reactions if the supported candidate is elected (Cooper et al., 2010).
For this reason, it is legitimate that firms may decide to enter politics in a manner in which they presume political connections as a feasible opportunity to establish shareholder wealth. Lobbying is one such political involvement, as well as PAC contributions. Firms are found to spend larger amounts in lobbying efforts, compared to PAC activity (Hill et al., 2013). Since firms allocate greater expenditures on lobbying, influencing legislative proposals would benefit the firms in terms of greater success in securing bailout assistance (Duchin and Sosyura, 2012), decreased taxes on firms’ repatriated earnings (Alexander et al., 2009), lower effective corporate tax rates (Richter
3 Political Action Committee, designed for the aim of raising and spending money to either elect or defeat political
6
et al.; 2009), and a higher likelihood to receive more TARP (Trouble Asset Relief Program) funds (Blau et al., 2013), which suggests that lobbying serves shareholder interests.
A vital issue in firm political engagement is whether managers are using firm resources for private gain. Thus, there may actually be an agency issue in which CEO decisions regarding political actions is driven by self-interest. Richter et al. (2009) suggests that lobbying activity is not completely observable and, therefore, not all of its outcomes are traceable into law. As a result of this agency cost problem, lobbying has no effect on Tobin’s Q and does not create any long term benefit for the corporation (Hersh et al., 2008). Lobbying could be derived from unethical practices (Borisov et al., 2014), and lobbyist CEOs earn greater compensation, compared to CEOs of non-lobbying firms (Skaife et al., 2013). Besides, political engagement may result in lower cumulative abnormal returns, compared to firms with no donations, (Aggarwal, et al., 2012) or contributions may not serve shareholder interests, but rather, contributions become the personal and political instruments of the CEOs and other executives, resulting in higher agency costs (Bebchuk and Jackson, 2010).
Although it may be true that political connections attract firms to engage in lobbying actions, our work highlights the potential implication of a resulting severe agency cost problem. Our research is similar to Skaife et al., (2013), Borghesi and Chang (2012), Hill et al. (2013), who analyze the value of lobbying, but we differ from them by analyzing the influence of CEO political ideology on lobbying efforts. Departing from other major empirical findings regarding lobbying effort and firm performance, we conclude that high levels of lobbying action lowers firm value and increases agency conflicts that are borne by shareholders.
3. Methodology
In estimating parameters in our empirical models, the political ideology of CEOs is the main explanatory variable. We also include a set of firm specific control variables to measure the relationship between corporate lobbying and firm performance.
Following Hutton et al. (2015), the political ideology of a CEO is measured by
𝐶𝑃𝐼𝐷 =𝐶𝑜𝑛𝑡𝑟𝑖𝑏𝑢𝑡𝑖𝑜𝑛 𝑡𝑜 𝑅𝑒𝑝𝑢𝑏𝑙𝑖𝑐𝑎𝑛 𝑃𝑎𝑟𝑡𝑦 − 𝐶𝑜𝑛𝑡𝑟𝑖𝑏𝑢𝑡𝑖𝑜𝑛 𝑡𝑜 𝐷𝑒𝑚𝑜𝑐𝑟𝑎𝑡𝑖𝑐 𝑃𝑎𝑟𝑡𝑦
7
The variable Cpid is a measure with boundaries of +1, which is equal to extreme Republican and (-1), which is equal to extreme Democrat. If a CEO does not make any contribution that year, we assume Cpid = 0. To identify the relationship between lobbying and CEO political ideology and other control variables on the financial well-being of companies, we use two approaches: Linear logistic regression and fixed effect panel regression.
Our main focus is to examine how CEO political orientation determines firm value in response to lobbying strategy. At the same time, we acknowledge the potential agency conflict inside the lobbyist firms if the lobbying decisions are driven by CEO self-interest, rather than protecting shareholder wealth. For that reason, we examine the lobbying effort of politically diverse managers, while considering a possible agency problem. For this purpose, we hypothesize that H.1: All other things equal, Republican managers lobby a larger number of bills. (𝛽1>0) • Number of Bills = 𝛽0+ 𝛽1RepCeo +∑ 𝛽𝑠Controls (2)
The number of bills is the log transformation of the number of bills lobbied in a given calendar year. RepCEO is a binary variable and equal to one if Cpid > 0 and zero otherwise. RepCEO estimates how many more bills are lobbied by firms with Republican-leaning managers, compared to rivals. Controls include firm specific variables such as firm size, financial leverage, tangibility, ROA, Herfindahl Index, and firm age.
H.2: All other things equal, Republican CEOs expend on lobbying. (𝛽1>0) • Lobbying Expenditure = 𝛽0+ 𝛽1RepCeo +∑ 𝛽𝑠Controls (3)
Lobbying expenditure is the log transformation of expenditure spent on lobbying in a given calendar year. RepCEO is a binary variable and equal to one if Cpid > 0 and zero otherwise. RepCEO measures how much more is spent on lobbying by firms with Republican-leaning managers, compared to rivals. Controls include the same set of firm specific variables.
H.3: All other things equal, lobbying influences CEO and board characteristics.
8
Lobbyist firm is the dependent variable and equal to one if the firm has lobbying activity, zero otherwise. First, we use CPID to measure if a firm exhibits lobbying activity in response to having a Republican CEO. Then, we examine the potential agency problem in terms of excess CEO pay and board characteristics. We introduce various CEO pay forms such as salary, cash, total compensation, and total compensation including options. We interpret “excess” CEO compensation as the CEO pay which is not fully explained by the market determinants of pay (Core et al., 2008). We also include board specific governance variables such as CEO ownership, board size and busy boards. Our investigation aims to examine whether higher compensation and weaker governance are lobbyist firm characteristics. In this case, if lobbying fails to create firm value, then only the managers and not the shareholders would actually benefit from the lobbying action. Next, we test if greater involvement in lobbying has a positive effect on firm value; H.4: All other things equal, lobbying affects firm performance.
• Firm Performance = 𝛽0+ 𝛽1LobbyBills +∑ 𝛽𝑠Controls (𝛽1>0) (5)
To further investigate the impact of agency costs, we analyze the relationship between corporate lobbying and firm performance. In brief, finding an association between lobbying and poor firm performance can be explained by the agency problem and unexplained CEO compensation. In order to identify the effect of lobbying on shareholder wealth creation, we measure firm performance as Tobin’s Q, agency cost of free cash flow, and excess return over time. LobbyBills is a binary variable and it is equal to one if a firm is lobbying at least one bill in a given calendar year and zero otherwise. Controls include the same firm specific variables. We estimate the model by running a fixed effect panel regression4, and our main interest is the sign and magnitude of 𝛽1, which is the coefficient of LobbyBills. A large and negative value of 𝛽1 indicates that lobbying decreases firm performance. For all tests in the study, we also generate binary variables for each industry and each year to capture panel fixed effects for the analysis.
9
4. Data Description 4.1) Firm Data
We collect personal information for CEOs (i.e. age, full name, compensation, ownership, position on the board) and their firm affiliations from the ExecuComp database and RiskMetrics. Our sample begins in 2000 and ends in 2012.5 The sample includes 2,503 unique firms, 4,585 unique CEOs, and political contributions for 2,037 distinct CEOs for a total of 22,061 firm-year observations between 2000 and 2012. To measure firm performance, control variables are gathered from COMPUSTAT and the Center for Research Security Prices. We include all industries (no SIC restriction) and group them by their Fama-French 12 Industry classification and generate 12 industry dummy variables, such as Consumer Nondurables, Manufacturing, Oil-Gas and Coal Extraction Products, Wholesale, and Retail.
4.2) Political Contributions
Our motivation is to measure whether the political orientations of managers influence lobbying activities. Therefore, the CEOs’ political orientation is the key variable of our paper. First, we identify a manager’s political view by tracking his or her personal or PAC financial contributions to both Democratic and Republican parties during elections (senate, house, presidential and gubernatorial).
The financial contributions to political parties, candidates, or committees can be found on the Federal Election Committee (FEC) website.6 The contribution files include the contributor’s name, occupation, year, and the amount of the money donated, among other variables. We match the executive names from ExecuComp with the FEC data to observe CEO donations. Most of the CEOs report their occupation or current employment position in the FEC contribution files. It is less likely to obtain the best matching results using computer based matching algorithm. Hence, we hand correct our results by name, surname, and suffixes (i.e. Mr, Mrs, Jr, II.) after matching ExecuComp names with the FEC data.
5 Our RiskMetrics data starts from 1998, but since some of the important variables before 1998 are missing;
ExecuComp is used to calculate firm and CEO specific characteristics.
10
4.3) Lobbying Information
Lobbying information is gathered from the Center for Responsible Politics (CRP). 7 The data
contain U.S firms that are lobbying in a given calendar year. We calculate the expenditure amount spent on lobbying, the number of bills lobbied, the name of the lobbyist, and the topic of the bills using the CRP database. We match the CRP data with our firms in the ExecuComp database by company name and year to find publicly traded firm contributions between 2000 and 2012. We also use the Congressional Bills Project database8 to track the lobbied bills that are passed in both the Senate and House of Representatives.
Table 1 shows descriptive statistics for our sample at the individual CEO and firm levels. As shown in Panel A, over the 12 year span of our sample period, CEO donations averaged $2,643 yearly, while Republican candidates received almost $3,000 more in contributions than Democratic candidates. In addition, the mean of Cpid is 0.18 for the managers in our study, suggesting that CEOs are more aligned with the Republican Party.
Panel B of Table 1 represents lobbying characteristics at the firm level. The number of bills lobbied is different than the number of issues lobbied, since one bill is able to contain several issues (topics) in it. The mean of number of bills lobbied is 3.97 and is smaller than the mean number of issues lobbied of 8.69. We also find average lobbying expenditure per bill is approximately $610,000, yearly. Moreover, we report bills which are lobbied in U.S Senate and U.S House of Representatives. The average number of bills lobbied in the U.S. legislature is greater than the average number of bills passed to become law. Therefore, our findings may suggest that not all the bills are able to gain enough votes to overcome legal procedures. As a result, some firms increase their lobbying expenditure over time until the bill becomes law.
Panel C of Table 1 exhibits the CEO and board characteristics, and Panel D of Table 1.a reports results regarding the control variables used in the study. The detailed definitions of variables are described in the Appendix.
11
Table 1 provides descriptive statistics of our sample (2000-2012), reporting the full sample summary statistics for measures of political values, lobbying variables, and control variables. Detailed definitions of variables are reported in the appendix. Panel A summarizes information of political contributions of 2,037 individual CEOs used in this study. Panel B lists calculated summary statistics of lobbying characteristics Panel C lists summary statistics of CEO and board characteristics. Panel C lists calculated summary statistics of control variables.
Table 1
Summary Statistics
Variables N Mean Median Std.Dev Min Max
Panel A. Political characteristic at CEO level
Annual Donation 22,061 2,643.87 0.00 13,355.39 0.00 500,000.00
CPID 22,061 0.18 0.00 0.58 -1.00 1.00
Donation to Rep. Party (Yearly) 7,973 6,004.07 1,000.00 20,602.17 0.00 683,000.00
Donation to Dem. Party (Yearly) 7,973 3,094.62 0 14,648.12 0.00 542,402.00
Panel B. Lobbying characteristics at Firm level
N. of Bills Lobbied 22061 3.97 0.00 10.62 0.00 278.00
Total Lobbying Amount 22061 609,785.50 0.00 7,106,778 0.00 995,000,000
N. of Issue Lobbied 22061 8.69 0.00 24.04 0.00 441.00
N. of Issue Lobbied at Senate 22061 3.09 0.00 8.53 0.00 225.00
N. of Issue Lobbied at House 22061 3.08 0.00 8.50 0.00 234.00
N. of Bills Passed at House 22061 0.35 0.00 1.88 0.00 67.00
N.of Bills Passed at Senate 22061 0.31 0.00 1.43 0.00 37.00
N. of Bills Became Law 22061 0.28 0.00 1.20 0.00 31.00
N. of Lobbyist Emp. 22061 4.68 0.00 13.39 0.00 274.00
N. of Lobbyist Emp. as Congressman 22061 0.14 0.00 0.64 0.00 23.00
Panel C. CEO and Board Characteristic
Board Size 16,609 9.38 9.00 2.59 3.00 34.00
Proportion of Busy Directors 22,061 0.18 0.00 0.38 0.00 1.00
CEO Compensation 21,932 5,286.40 3,016.46 9,298.95 0.00 600,347.35
CEO Compensation (Opt. Included) 22,022 5,911.38 2,573.28 20,014.73 0.00 2,278,668.21
CEO Ownership 21,525 0.42 0.03 18.60 0.00 2,463.62
CEO Salary 22,061 724.59 671.62 403.56 0.00 8,100.00
CEO Bonus 22,061 504.58 0.00 1,498.44 0.00 76,951.00
CEO Cash 22,061 1,229.17 866.25 1,646.22 0.00 77,926.00
CEO Gender 22,061 0.97 1.00 0.16 0.00 1.00
CEO Age 21,390 55.45 55.00 7.45 28.00 96.00
Panel D. Control Variables
Size 22,061 7,392.82 1,475.00 23,774.83 0.00 504,239.58
Tobin's Q 22,058 1.88 1.42 1.55 0.49 35.11
Leverage 22,061 0.23 0.20 0.99 0.00 120.94
ROA 22,061 0.07 0.08 0.14 -3.75 0.39
Tangible 22,061 0.25 0.18 0.23 0.00 0.94
FCF 21,527 0.03 0.04 0.15 -4.46 0.25
Firm Age 22,061 25.61 20.00 16.65 1.00 62.00
Table 2 reports the descriptive statistics for donor managers during all election cycles from 1993 to 2012. Managers who are making at least one donation in given election cycle are identified as donors. % Donor is the percentage of managers that donate in a given election cycle. Mean$ contribution is the average dollar amount given to political parties. Rep$ and Dem$ refer to dollar amount donated to Republican and Democratic parties, respectively. Polarizer indicates the managers who make all contributions to either Republican- or Democratic parties. %Pol is the total number of polarizes as a percentage of total number of donor CEOs. REPDUMMGR is the cycle-specific Republican dummy for donor managers, which takes the value of one when all donations of the manager go to the Republican Party in that cycle and zero otherwise. The 1993-10 row reports the summary statistics for all unique donor managers.
12 Table 2
Political Orientation of Managers
Donors (3-4) Contributions (5-7) Polarizer (10-12) Cycle Specific
Cycle Num. Don All N(Donor) %Don Mean$ Rep$ Dem$ N(Rep) N(Dem) Pol(Rep) Pol(Dem) %Pol REPDUMMGR
(1) (2) (3) (4) (5) (6) (7) (8) (9) (10) (11) (12) (13) (14)
1993-94 7,833 2,708 943 34.82% $3,793 $1,920 $1,870 577 351 412 278 73.17% 0.61
1995-96 10,237 3,251 1,263 38.85% $5,710 $3,879 $1,829 905 343 778 188 76.48% 0.72
1997-98 8,961 3,405 1,065 31.28% $4,219 $4,164 $1,969 729 285 625 212 78.59% 0.68
1999-00 12,074 3,603 1,287 35.72% $9,554 $5,921 $3,627 932 347 830 206 80.50% 0.72
2001-02 8,941 3,346 858 25.64% $5,634 $3,077 $2,556 552 298 382 305 80.07% 0.64
2003-04 13,759 3,494 1,158 33.14% $7,002 $4,915 $2,086 808 340 659 244 77.98% 0.70
2005-06 10,355 3,621 843 23.28% $7,412 $4,619 $2,703 560 276 451 221 79.72% 0.66
2007-08 15,989 4,142 1,205 29.09% $9,765 $5,888 $3,873 777 424 563 357 76.35% 0.64
2009-10 12,427 3,921 948 24.18% $7,688 $4,067 $3,561 584 364 389 358 78.80% 0.62
2011-12 17,636 3,680 1,083 29.43% $16,481 $12,921 $3,554 758 325 637 204 77.65% 0.69
Table 2 exhibits statistics for CEO political donations per election cycle in a similar approach to Hutton et al. (2014). Number of Donations refers to the number of each distinct donation made by CEOs in the election cycle. Based on our data, the number of donations substantially increases in U.S Presidential Elections cycles (1996, 2000, 2004, 2008 and 2012). Mid-year elections are associated with U.S Senate, U.S House and gubernatorial (governor) elections. Number of CEO is the number of managers reported in ExecuComp for a given year. Donor is the CEOs who made at least one donation in a given election cycle. 31% of CEOs in our sample are labeled as a donor. Indeed, Table 2 shows that the mean donation made to the Republican Party is higher than the Democratic Party through all election cycles. The average contribution made by CEOs in our sample is $8,103, of which $5,316 is to the Republican Party, and $2,770 is to the Democratic Party.
In Table 2, we also observe that the number of Republican CEOs is more than twice the number of Democratic CEOs (7,465 vs. 3,539). This difference becomes even larger in Presidential Election years. Therefore, CEOs in our sample who are making at least one donation in a given election cycle are more likely to be Republican leaning CEOs. While individual and PAC donations may be made to both parties, some managers donate to only a single party, and these are reported under Polorizer. We find that 76.88% of CEOs make all donations completely to either the Republican Party or Democratic Party, and we define one-party contributors as polarizers. Different from firm level PAC contributions, individual CEO donations may also be motivated to gain political favors, or to represent the political orientation of a diverse shareholder base (Hutton et al. 2014). In brief, political donations of each individual manager are more likely to show their particular political ideologies and could be used as a proxy to identify their firm-level financial decisions. Lastly, REPDUMMGR is the cycle-specific Republican dummy for donor CEOs, which takes the value of one when all donations of the manager go to the Republican Party in that cycle and zero otherwise.
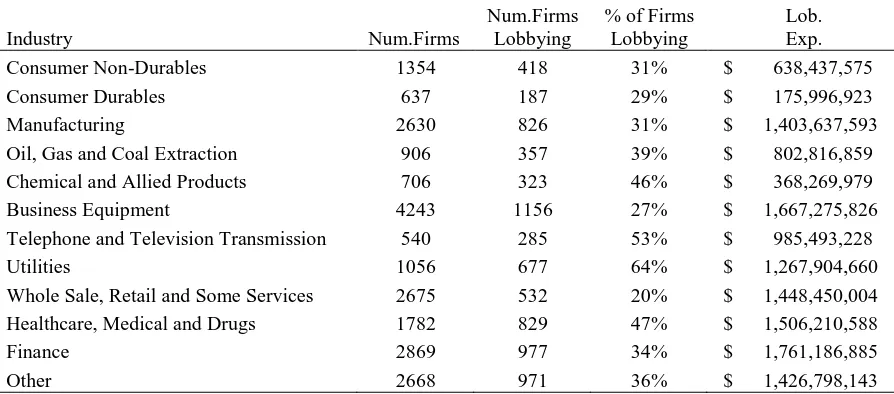
14 Panel B. Lobbying Across Industries
Industry Num.Firms
Num.Firms Lobbying
% of Firms Lobbying
Lob. Exp.
Consumer Non-Durables 1354 418 31% $ 638,437,575
Consumer Durables 637 187 29% $ 175,996,923
Manufacturing 2630 826 31% $ 1,403,637,593
Oil, Gas and Coal Extraction 906 357 39% $ 802,816,859 Chemical and Allied Products 706 323 46% $ 368,269,979
Business Equipment 4243 1156 27% $ 1,667,275,826 Telephone and Television Transmission 540 285 53% $ 985,493,228
Utilities 1056 677 64% $ 1,267,904,660
Whole Sale, Retail and Some Services 2675 532 20% $ 1,448,450,004
Healthcare, Medical and Drugs 1782 829 47% $ 1,506,210,588
Finance 2869 977 34% $ 1,761,186,885
Other 2668 971 36% $ 1,426,798,143
Table 3 exhibits lobbying firms’ characteristics in firm and industry level. Panel A shows the yearly distribution of the proportion of lobbying firms between 2000 and 2012 and average lobbying expenditures spent in calendar year. Panel B shows lobbying distribution of the Fama-French 12 industry classification system with the amount spent on lobbying activities.
Table 3
Lobbyist Firm and Industry Details
Panel A. Lobbying Firm Characteristics
Year
Num.
Firms Num. Firm Lobbying % Firms Lobbying Average Lobbying Expenditure
2000 1687 537 32% $923,863.04
2001 1595 551 35% $945,832.94
2002 1592 567 36% $1,053,251.84
2003 1642 612 37% $1,090,820.89
2004 1651 617 37% $1,206,354.39
2005 1644 667 41% $1,201,210.77
2006 1720 714 42% $1,316,801.71
2007 1882 741 39% $1,456,917.83
2008 1815 725 40% $1,801,042.39
2009 1779 742 42% $3,192,902.30
2010 1740 738 42% $1,933,055.30
2011 1684 710 42% $1,798,518.70
2012 1630 681 42% $1,803,086.34
15
Table 3 presents lobbying firm and industry characteristics in our sample. Panel A of Table 3 exhibits the firm characteristic statistics obtained from the ExecuComp database. We observe the proportion of firms lobbying increases over time, as well as the average lobbying expenditure. In Panel B, we report substantial differences between lobbying industries. The industries are adjusted by the Fama-French 12 industry classification system. The utilities industry is the leading lobbyer, with a lobbying proportion of 64% and a lobbying expenditure of more than $1 million USD. The health and medical industry is the next highest, with the proportion of 47% lobbyers and around $1.5 million USD average expenditure.
5. Empirical Results
5.1) Lobbying Activity of Politically Diverse Managers
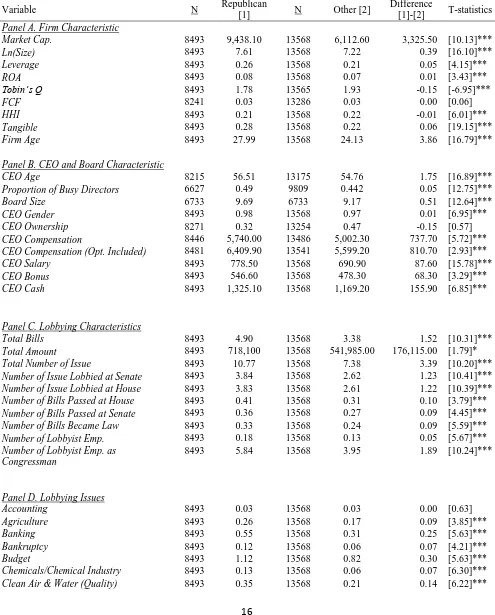
Table 4 is designed to compare the mean score of two groups. Since our main objective is to investigate political ideology on lobbying outcome, we split our managers in two subgroups: Republican managers and others managers (Democrat and Apolitical CEOs)9. In Panel A, we compare subgroups by firm specific variables. The univariate analysis shows that Republican leaning firms are larger in market size and less leveraged compared to their rivals. In addition, they have higher ROA and higher tangibility with slightly less Tobin’s Q.
In Panel B, we examine CEO pay and board characteristics at the managerial level by again comparing subgroup means. First, we find that Republican firms have a higher proportion of busy boards and larger board size. Second, Republican firms outperform their competitors in all forms of CEO pay. To put it briefly, Republican CEOs have higher salary, cash, bonus and overall total compensation, compared to their counterparties. For this reason, the higher CEO pay of Republican managers with relatively weak corporate governance may support the existence of a possible agency problem (Skaife et al. 2013).
9 CEOs are assumed to be Republican if CPID is greater than zero. Other managers are defined as CPID is less than
16 Table 4
Univariate Test
Variable N Republican
[1] N Other [2]
Difference
[1]-[2] T-statistics
Panel A. Firm Characteristic
Market Cap. 8493 9,438.10 13568 6,112.60 3,325.50 [10.13]***
Ln(Size) 8493 7.61 13568 7.22 0.39 [16.10]***
Leverage 8493 0.26 13568 0.21 0.05 [4.15]***
ROA 8493 0.08 13568 0.07 0.01 [3.43]***
Tobin’s Q 8493 1.78 13565 1.93 -0.15 [-6.95]***
FCF 8241 0.03 13286 0.03 0.00 [0.06]
HHI 8493 0.21 13568 0.22 -0.01 [6.01]***
Tangible 8493 0.28 13568 0.22 0.06 [19.15]***
Firm Age 8493 27.99 13568 24.13 3.86 [16.79]***
Panel B. CEO and Board Characteristic
CEO Age 8215 56.51 13175 54.76 1.75 [16.89]***
Proportion of Busy Directors 6627 0.49 9809 0.442 0.05 [12.75]***
Board Size 6733 9.69 6733 9.17 0.51 [12.64]***
CEO Gender 8493 0.98 13568 0.97 0.01 [6.95]***
CEO Ownership 8271 0.32 13254 0.47 -0.15 [0.57]
CEO Compensation 8446 5,740.00 13486 5,002.30 737.70 [5.72]***
CEO Compensation (Opt. Included) 8481 6,409.90 13541 5,599.20 810.70 [2.93]***
CEO Salary 8493 778.50 13568 690.90 87.60 [15.78]***
CEO Bonus 8493 546.60 13568 478.30 68.30 [3.29]***
CEO Cash 8493 1,325.10 13568 1,169.20 155.90 [6.85]***
Panel C. Lobbying Characteristics
Total Bills 8493 4.90 13568 3.38 1.52 [10.31]***
Total Amount 8493 718,100 13568 541,985.00 176,115.00 [1.79]*
Total Number of Issue 8493 10.77 13568 7.38 3.39 [10.20]***
Number of Issue Lobbied at Senate 8493 3.84 13568 2.62 1.23 [10.41]***
Number of Issue Lobbied at House 8493 3.83 13568 2.61 1.22 [10.39]***
Number of Bills Passed at House 8493 0.41 13568 0.31 0.10 [3.79]***
Number of Bills Passed at Senate 8493 0.36 13568 0.27 0.09 [4.45]***
Number of Bills Became Law 8493 0.33 13568 0.24 0.09 [5.59]***
Number of Lobbyist Emp. 8493 0.18 13568 0.13 0.05 [5.67]***
Number of Lobbyist Emp. as Congressman
8493 5.84 13568 3.95 1.89 [10.24]***
Panel D. Lobbying Issues
Accounting 8493 0.03 13568 0.03 0.00 [0.63]
Agriculture 8493 0.26 13568 0.17 0.09 [3.85]***
Banking 8493 0.55 13568 0.31 0.25 [5.63]***
Bankruptcy 8493 0.12 13568 0.06 0.07 [4.21]***
Budget 8493 1.12 13568 0.82 0.30 [5.63]***
Chemicals/Chemical Industry 8493 0.13 13568 0.06 0.07 [6.30]***
17
Economics 8493 0.06 13568 0.05 0.02 [2.31]**
Copyright/Patent/Trademark 8493 0.46 13568 0.40 0.06 [1.47]
Financial
Institutions/Investments/Securities
8493 0.67 13568 0.50 0.18 [3.87]***
Defense 8493 0.93 13568 0.78 0.14 [1.64]
Education 8493 0.18 13568 0.10 0.08 [4.25]***
Energy 8493 1.24 13568 0.75 0.49 [8.32]***
Environmental/Superfund 8493 0.87 13568 0.51 0.36 [8.74]***
Food Industry (Safety, Labeling, etc.) 8493 0.20 13568 0.14 0.06 [2.57]**
Foreign Relations 8493 0.15 13568 0.12 0.03 [2.05]**
Fuel/Gas/Oil 8493 0.18 13568 0.07 0.11 [7.60]***
Natural Resources 8493 0.21 13568 0.11 0.10 [5.91]***
Gaming/Gambling/Casino 8493 0.01 13568 0.02 -0.01 [-2.19]**
Government Issues 8493 0.25 13568 0.19 0.07 [3.64]***
Health Issues 8493 1.27 13568 0.85 0.42 [6.51]***
Intelligence and Surveillance 8493 0.04 13568 0.01 0.03 [4.06]***
Homeland Security 8493 0.34 13568 0.28 0.06 [2.26]**
Housing 8493 0.17 13568 0.08 0.09 [3.97]***
Immigration 8493 0.20 13568 0.12 0.08 [3.83]***
Insurance 8493 0.25 13568 0.13 0.12 [5.41]***
Communications/Broadcasting/Radio/TV 8493 0.24 13568 0.24 0.00 [0.06]
Labor Issues/Workplace 8493 0.54 13568 0.34 0.21 [6.24]***
Law Enforcement 8493 0.19 13568 0.10 0.09 [5.99]***
Manufacturing 8493 0.11 13568 0.06 0.05 [4.37]***
Marine/Maritime/Boating/Fisheries 8493 0.07 13568 0.04 0.03 [3.35]***
Media (Information/Publishing) 8493 0.02 13568 0.03 -0.01 [1.70]*
Medical/Disease Research/Clinical Labs 8493 0.10 13568 0.05 0.05 [5.40]***
Medicare/Medicate 8493 0.74 13568 0.47 0.28 [5.32]***
Postal 8493 0.10 13568 0.07 0.03 [2.04]**
Railroads 8493 0.17 13568 0.10 0.07 [2.87]***
Real Estate 8493 0.05 13568 0.03 0.03 [3.65]***
Retirement 8493 0.23 13568 0.18 0.06 [2.91]***
Roads/Highway 8493 0.06 13568 0.03 0.03 [4.22]***
Science/Technology 8493 0.22 13568 0.15 0.07 [3.87]***
Small Business 8493 0.05 13568 0.03 0.02 [2.57]**
Taxation/Internal Revenue Code 8493 2.29 13568 1.47 0.82 [9.86]***
Telecommunications 8493 0.77 13568 0.56 0.22 [2.15]**
Trade (Domestic & Foreign) 8493 0.95 13568 0.64 0.31 [7.48]***
Transportation 8493 0.53 13568 0.35 0.19 [6.25]***
Travel/Tourism 8493 0.01 13568 0.03 -0.02 [-3.21]***
Utilities 8493 0.25 13568 0.13 0.12 [5.74]***
Veterans 8493 0.06 13568 0.03 0.03 [3.18]***
Waste
(hazardous/solid/interstate/nuclear)
8493 0.12 13568 0.05 0.07 [6.62]***
Welfare 8493 0.01 13568 0.00 0.01 [2.40]**
18
In Panel C, we analyze firm lobbying involvement from various dimensions. Our results confirm that there is a significant statistical difference between Republican firms and other firms in terms of lobbying effort. We report that firms with Republican CEOs are more profoundly involved in lobbying to impact the legislation that they assume would benefit the firm. We find that Republican leaning firms lobby a larger number of bills and their bills include more than one issue (topic) coded. Moreover, Republican leaning firms have higher lobbying expenditures and they lobby more bills in both the U.S Senate and U.S House of Representatives. As a result, more bills are successfully passed in both U.S legislative bodies and become law for Republican firms. In addition, Republican firms hire more lobbyists and more of those lobbyists are former Congressmen. Our findings support the evidence that firms with Republican managers are leaders in lobbying and use all lobbying channels to alter legislative actions on behalf of their firm. In Panel D, we examine the lobbying issues (topics) that are most frequently lobbied in our database. We report 50 types of issues that are lobbied by firms during each calendar year. Republican CEOs lobby a higher number of bills in 44 of the subtopics, compared to other CEOs, and the results are statistically significant.
Our univariate analyses report a more profound involvement in lobbying activity for Republican CEOs. While firms having Republican managers are found to follow less risky corporate decisions, have less debt and leverage, hold less tangible assets, and make safer investments (Hutton et al. 2014), we report that the Republican managers drive greater lobbying expenditures, lobby a larger number of bills, employ more lobbyists and recognize lobbying as an overall corporate strategy. 5.2) Association between lobbying and CEO Political Ideology
19 Table 5
Corporate Lobbying and CEO Ideology.
Dependent Variable Ln(Number of Bills)t+1 Ln(Lob. Amount)t+1
Sample
(1) (2)
Repdumt 0.557 0.101
[0.001]*** [0.001]***
Ln(Size)t 1.726 0.336
[0.001]*** [0.001]***
Leveraget 0.135 0.020
[0.489] [0.570]
Tangiblet 1.433 0.210
[0.015]** [0.016]**
ROAt -3.125 -0.675
[0.001]*** [0.001]***
HHIt 2.143 0.369
[0.001]*** [0.001]***
Ln(FirmAge)t 0.681 0.134
[0.001]*** [0.001]***
Constant -10.690 -2.059
[0.001]*** [0.001]***
Industry & Year Fixed Yes YES
Num.Cluster 2,400 2,400
N 20,231 20,231
R2
28% 33%
Table 6
Lobbying and CEO/Board Characteristics
Dependent Variable Bills Lobbiedt+1
Sample
(1) (2) (3) (4) (5) (6) (7) (8) (9)
CPIDt 0.069 0.073 0.074 0.077 0.078 0.077 0.074 0.089 0.074
[0.015]** [0.001]*** [0.001]*** [0.001]*** [0.001]*** [0.001]*** [0.024]** [0.001]*** [0.001]***
Ln(CEO Compensation)t 0.194
[0.001]***
Ln(CEO Compensation inc. Opt.)t 0.120
[0.001]***
Ln(CEO Salary)t 0.201
[0.001]***
Ln(CEO Cash)t 0.152
[0.001]***
CEO Ownershipt 0.013
[0.001]***
Ln(CEO Age)t -0.394
[0.001]***
Busy Boards 1.334
[0.001]***
Ln(Board Size)t 1.025
[0.001]***
Ln(Size)t 0.579 0.609 0.635 0.633 0.661 0.664 0.651 0.688 0.659
[0.001]*** [0.001]*** [0.001]*** [0.001]*** [0.001]*** [0.001]*** [0.001]*** [0.001]*** [0.001]***
Leveraget 0.064 0.076 0.078 0.072 0.102 0.095 0.947 1.103 0.112
0.213 0.252 0.223 0.245 0.180 0.202 [0.001]*** [0.001]*** 0.137
Tangiblet 0.480 0.453 0.426 0.445 0.390 0.443 0.221 0.038 0.418
[0.001]*** [0.001]*** [0.001]*** [0.001]*** [0.001]*** [0.001]*** [0.066]* 0.752 [0.001]***
21
ROAt -0.786 -0.903 -0.840 -0.884 -0.864 -0.858 -1.180 -1.259 -0.836
[0.001]*** [0.001]*** [0.001]*** [0.001]*** [0.001]*** [0.001]*** [0.001]*** [0.001]*** [0.001]***
HHIt 0.708 0.699 0.694 0.691 0.717 0.721 0.511 0.566 0.689
[0.001]*** [0.001]*** [0.001]*** [0.001]*** [0.001]*** [0.001]*** [0.001]*** [0.001]*** [0.001]***
Ln(FirmAge)t 0.244 0.243 0.214 0.222 0.247 0.252 0.115 0.086 0.249
[0.001]*** [0.001]*** [0.001]*** [0.001]*** [0.001]*** [0.001]*** [0.001]*** [0.001]*** [0.001]***
Constant -7.235 -6.849 -7.271 -6.976 -6.268 -4.740 -6.569 -8.426 -6.264
[0.001]*** [0.001]*** [0.001]*** [0.001]*** [0.001]*** [0.001]*** [0.001]*** [0.001]*** [0.001]***
Industry & Year Fixed YES YES YES YES YES YES YES YES YES
N 20,075 20,192 20,231 20,231 19,730 19,589 20,231 15,227 20,231
R2
23% 23% 23% 23% 23% 22% 23% 25% 22%
Based on our regression results, we find that Republican CEOs lobby 74% more bills, compared to their rival Democrat and Apolitical managers. Since we hypothesize that corporate lobbying actions are influenced by the CEO’s political ideology, our results confirm the involvement of Republican oriented managers in lobbying efforts. Similar to Skaife et al. (2013), we also find lobbyist firms are larger (firm size) but less profitable (ROA) in terms of firm characteristics. In column (2), we test the relationship between lobbying expenditure and CEO political ideology. We use lobbying amount in USD as the dependent variable after taking the log transformation. Likewise, we provide evidence that Republican CEOs spend 10% more on lobbying, compared to rival managers. Firm specific control variables show similar findings to those of the column (1) regression. Overall, findings from Table 5 are consistent with both our research motivation and our univariate analysis in which we report increased lobbying activity for Republican leaning managers of sample firms.
5.3) Association between lobbying and CEO incentives
Table 6 is designed to examine the relationship between lobbying and potential agency conflict in terms of CEO incentives and board characteristics. We estimate a logistic regression of equation (3), where the dependent variable Bills represents firm lobbying activity and is defined as a binary variable equal to one if a firm lobbied at least one bill (lobby active), zero otherwise.
We use several forms of CEO pay such as salary, cash, total compensation and total compensation including options. We also introduce CEO ownership, board size and the proportion of busy boards to investigate whether weak governance is related to the lobbying effort. Since Core et al. (1999) find that CEOs earn higher compensation when board structure is less effective, we test the similar assumption regarding the relation between agency cost, CEO pay, and corporate lobbying. Results from Table 6 demonstrate strong evidence of a relationship between lobbying and excess CEO compensation, as well as given CEO political orientation. We run nine logistic regressions and report that Cpid is positive and significant in all regressions and that, if a firm is involved in lobbying activities, the manager is more likely to be Republican, which is consistent with our previous findings.
23
Further, we report that all CEO pay incentives are positive and suggest that, if a firm engages in lobbying, the managers are more likely to receive higher compensation. In other words, Table 6 shows a possible explanation of agency cost, where lobbyist CEOs earn greater compensation, compared to non-lobbyist peers. Our results are similar to Skaife et al. (2013), where lobbyist managers are better compensated, and Aslan and Grinstein (2011), where higher political connections increase CEO annual compensation.
Next, we find that lobbyist firms are more likely to have higher CEO ownership, defined as the ratio of shares the CEO owns to all the firm’s shares outstanding. Additionally, if a firm exhibits lobbying activity, it is more likely to have a larger board as well as busy boards, where at least one director holds more than three seats outside the firm. Lastly, CEO age is introduced to the model, and our findings suggest that lobbying firms are more likely to have younger CEOs serving as the top executive, rather than older managers.
Findings from Table 6 support our hypothesis of agency cost and lobbying in which we control for CEO pay and board specific variables. It could be the case that lobbying is positively correlated with “weak governance”. To emphasize, lobbyist managers may be monitored less efficiently and enjoy several forms of greater compensation (i.e. cash, bonus and total compensation). (Skaife et al. 2013)
On the other hand, lobbying could also indirectly affect higher CEO pay in alternative ways. First, Sloan (1993) finds that CEO compensation is sensitive to accounting-based firm performance. Since lobbying activity is defined as that intended to influence regulations (i.e. tax, trade, sales, and product approvals) that would benefit the firm revenues, expenditures, and earnings, it is not surprising that lobbying increases CEO pay. In that case, if lobbying increases firm value, but this increase in firm value is not reflected in shareholder value, then lobbying benefits the CEOs, not the shareholders.
24
compensation based on anticipated future outcomes from lobbying. In this situation, lobbying would increase CEO pay in the short run before generating real shareholder wealth. As a result, lobbying increases CEO compensation and agency costs simultaneously.
5.4) Association between lobbying and firm performance
Our main goal is to empirically test the relation between lobbying outcome and CEO political ideology, since the lobbying decision is made by the firm’s top management. Therefore, lobbying should serve to benefit the shareholders and should increase shareholder wealth, as well as increase firm value.
The Lobbying Disclosure Act became law in 1995 to provide public disclosure about how much corporations spend on lobbying. However, the lobbying concept and the expected outcome from lobbying can be difficult to measure systematically. In this case, shareholders who aim to monitor managers and evaluate their performance may suffer due to a lack of transparency. Lobbying expenditure and the opacity of lobbying may introduce agency costs that result from not only the costs associated with the entry decision to lobbying, but also costs from the lobbying outcome itself. Therefore, the link between lobbying and firm performance is potentially important, because legislative acts can affect firm value and is shaped by lobbying efforts.
Table 7 exhibits the relationship between lobbying and firm characteristics between 2000 and 2012. Dependent variable Agency cost is a product of FCF and Grow. FCF is free cash flow divided by assets. Grow is a binary variable equals 1 if Tobin’s Q is less than 1 (Doukas et al. (2000)). Amount is a binary variable and equal to one if firms have lobbying expenditure in given year. Bills is a binary variable and equal to one if firm lobbied at least one bill. Columns show different political ideologies of CEOs, which are Republican (CPID>0), Apolitical (CPID=0) and Democrat (CPID<0). Control variables are calculated from COMPUSTAT and RiskMetrics. All definitions of variables used in this table are in the appendix. Std. Errors are clustered for robustness check. Numbers in parentheses are p-values. *, **, and *** indicate statistical significance at the 10%, 5%, and 1% levels, respectively.
25 Table 7
Lobbying And Agency Cost
Dependent Variable Agency Costt+2
Sample All Republican Apolitical Democrat All Republican Apolitical Democrat
(2) (3) (4) (5) (2) (3) (4) (5)
Ln(Lob.Amount)t+1 -0.009 0.022 -0.042 0.003
0.566 [0.007]*** 0.224 0.797
Lobbydumt+1 -0.074 0.256 -0.371 -0.005
0.618 [0.001]*** 0.216 0.973
Ln(Size)t 0.150 0.039 0.332 -0.041 0.157 0.030 0.353 -0.046
0.104 0.533 0.109 0.287 0.122 0.644 0.117 0.243
Leveraget 1.314 1.160 1.546 0.693 1.318 1.160 1.574 0.685
[0.030]** [0.054]* 0.134 [0.022]** [0.031]** [0.055]* 0.133 [0.024]**
Tangiblet 0.003 -0.780 0.821 -0.872 0.010 -0.792 0.842 -0.876
0.995 [0.018]** 0.316 [0.082]* 0.983 [0.017]** 0.312 [0.079]*
ROAt 6.761 4.790 9.812 1.408 6.749 4.811 9.786 1.412
[0.083]* [0.036]** 0.159 [0.001]*** [0.083]* [0.035]** 0.157 [0.006]***
HHIt 0.112 0.094 -0.252 0.802 0.121 0.080 -0.212 0.801
0.557 0.718 0.477 [0.022]** 0.524 0.761 0.541 [0.022]**
Ln(FirmAge)t 0.068 -0.069 0.134 0.243 0.070 -0.071 0.141 0.242
0.309 0.551 0.144 [0.064]* 0.294 0.540 0.133 [0.064]*
Constant -3.139 -0.799 -6.114 -0.895 -3.186 -0.731 -6.284 -0.868
[0.050]** 0.126 [0.073]* [0.097]* [0.056]* 0.174 [0.077]* 0.108
Industry & Year Fixed YES YES YES YES YES YES YES YES
Num.Cluster 2314 1,299 1,475 737 2314 1,299 1,475 737
N 17,509 6,698 7,627 3,184 17,509 6,698 7,627 3,184
R2
Our key independent variables are Ln(Amount) and Lobbydum. Ln(Amount) is the log transformation of lobbying expenses, while Lobbydum is a binary variable and is equal to one if a firm has lobbied at least one bill in a given calendar year and zero otherwise, respectively. While most bills require an expenditure in order to be lobbied, some bills are actually lobbied by corporations without any expenditure. In our sample data, we find 95% of the bills are lobbied by firms through a certain amount of expenditure. Therefore, we use both Ln(Amount) and Bills to identify whether the agency cost of free cash flow is related to lobbying expenditure. The results of Table 7 show that lobbying does not result in an agency cost problem for Democrat and Apolitical managers. However, firms with Republican managers are positively and significantly related to the agency cost of free cash flow. Thus, our results strongly support the cost of agency problem that lobbying activity comes at the expense of shareholder wealth. Considering the excess involvement in lobbying, it is reasonable that firms with Republican oriented managers are confronting this agency problem.
While we find greater CEO pay, along with weak governance, contribute to firm lobbying, our results are aligned with previous literature. On average, we report that Republican CEO firms have higher agency costs in terms of both lobbying expenditure and lobbying effort. A similar association is documented by Kim (2008), where lobbying introduces a principal-agent issue and lowers shareholder rights. Coates and John (2012) also argue that lobbying lowers the financial performance of firms and generates agency costs. Lobbyist CEOs may exploit firm resources for their own benefit rather than corporate gain (Skaife et al., 2013) and receive greater compensation (Aslan and Grienstein, 2012). Our findings show that the higher lobbying efforts of Republican managers is associated with agency conflict that is borne by shareholders. In Table 8, we study the effect of lobbying on firm performance, where firm performance is measured by Tobin’s Q. Tobin’s Q is calculated as the ratio of the market value of total assets to the book value of total assets, and in our regressions it is calculated one year following the lobbying decision. As in Table 7, our main independent variables are lobbying amount and lobbying activity, which are main lobbying proxies. The OLS regression includes industry and year fixed effects and reports clustered standard errors for robustness of our results. We divide our sample into three sub-samples based on the CEO political ideology and measure the effect of lobbying on firm value.
Table 8
Corporate Lobbying and Tobin's Q.
Dependent Variable Tobin's Qt+2
Sample All Republican Apolitical Democrat All Republican Apolitical Democrat
(1) (2) (3) (4) (1) (2) (3) (4)
Ln(Lob.Amount)t+1 -0.012 -0.014 -0.010 -0.004
[0.001]*** [0.001]*** [0.069]* 0.502
Lobbydumt+1 -0.135 -0.179 -0.134 0.018
[0.001]*** [0.001]*** [0.040]** 0.790
Ln(Size)t 0.119 0.085 0.162 0.119 0.124 0.090 0.162 0.128
[0.001]*** [0.001]*** [0.001]*** [0.001]*** [0.001]*** [0.001]*** [0.001]*** [0.001]***
Leveraget 0.752 1.157 0.562 -0.247 0.754 1.156 0.563 -0.235
0.124 [0.085]* 0.404 0.480 0.123 [0.086]* 0.404 0.500
Tangiblet -0.358 -0.421 -0.174 -0.348 -0.351 -0.413 -0.171 -0.340
[0.001]*** [0.019]** 0.335 0.162 [0.011]** [0.021]** 0.346 0.176
ROAt 0.368 0.522 0.383 0.105 0.357 0.510 0.385 [0.097]*
0.596 0.397 0.769 0.872 0.607 0.409 0.768 0.881
HHIt 0.074 0.179 0.142 -0.181 [0.083]* 0.190 0.142 -0.179
0.494 0.381 0.320 0.271 0.442 0.353 0.321 0.280
Ln(FirmAge)t -0.284 -0.196 -0.343 -0.285 -0.283 -0.197 -0.343 -0.283
[0.001]*** [0.001]*** [0.001]*** [0.001]*** [0.001]*** [0.001]*** [0.001]*** [0.001]***
Constant 1.823 1.683 1.735 2.085 1.781 1.644 1.722 2.037
[0.001]*** [0.001]*** [0.001]*** [0.001]*** [0.001]*** [0.001]*** [0.001]*** [0.001]***
Industry & Year Fixed YES YES YES YES YES YES YES YES
Num.Cluster 2329 1,313 1,481 741 2329 1,313 1,481 741
N 17,701 6,811 7,690 3,200 17,701 6,811 7,690 3,200
R2 14% 17% 13% 18% 14% 17% 13% 18%
Table 8 exhibits regression analysis for the sample survey data, clustered by GVKEY, examining the relation between lobbying and firm performance between 2000 and 2012. The dependent variable is the firm performance measured by Tobin’s Q. The independent variable Amount is a binary variable and equal to one if firms have lobbying expenditure in given year. And Bills, is a binary variable and equal to one if a company is lobbying in given calendar year, zero otherwise. Columns show different political ideologies of CEOs, which are Republican (CPID>0), Apolitical (CPID=0) and Democrat (CPID<0). All definitions of variables used in this table are in the appendix. Numbers in parentheses are p-values. *, **, and *** indicate statistical significance at the 10%, 5%, and 1% levels, respectively.
Table 8 compares the performance of lobbying firms, depending on CEO political ideology. Since we report that Republican CEOs lobby more bills and spend more on lobbying activities, we expect to find a different outcome from corporate lobbying on Tobin’s Q for firms with Republican-leaning managers. We find that lobbying lowers Tobin’s Q in our full sample. However, once we analyze the sub-samples, the decrease in Tobin’s Q is statistically significant for Republican CEOs (Cpid>0) and Apolitical CEOs (Cpid=0). Moreover, the decrease in Tobin’s Q is greater for Republican CEOs (1.5%and 17%) than for Apolitical CEOs (1.1% and 13%). The decrease in Tobin’s Q has the lowest magnitude for Democratic CEOs, but this decrease is statistically insignificant. Table 8 shows the consequences of the lobbying decision on firm value. Our findings present that lobbying activity influences Tobin’s Q negatively and lowers firm value, unlike Hersh et al (2008), which fails to find a relationship between Tobin’s Q and corporate lobbying.
The main desire for firms to participate in political actions may be to protect themselves from the threats of future legislative processes. In order to change those legislative processes, firms commit to expend their financial resources on “lobbying expenditures”. Firm-level lobbying expenditure is delivered to politicians through employed lobbyists to promote the firm’s interests. Despite the fact that lobbying firms seek corporate gain, we find that lobbying lowers the firm value for firms with Republican and Apolitical managers. If a firm is involved in lobbying to establish a relationship with Washington, it remains as a lobbyist to reinforce the value of lobbying (Drutman, 2011). Thus, managers may be expending more on lobbying to promote more bills in which they believe it would serve firm’s objectives. However, the cost of extra lobbying actually offsets the potential benefits. As a result, we cast doubt on the value relevance of lobbying and political engagement in a manner similar to Aggarwal et al. (2012). Comparatively, we perform panel regressions of market adjusted returns on lobbying activity, controlling for other firm characteristics in Table 9. Since lobbying investment is unlikely to affect same-year returns, a firm’s buy-and-hold abnormal returns (BHAR) are calculated over the next 12, 24, and 36 months following lobbying activities, which is measured using a lobbying dummy variable. Given that the firm lobbied at least one bill for year t, the abnormal return is calculated as the difference in the
29
stock’s annual return, which is geometrically compounded using monthly returns over December t through November t + 1, minus the return on value-weighted market index, calculated in the same way over the same period.10
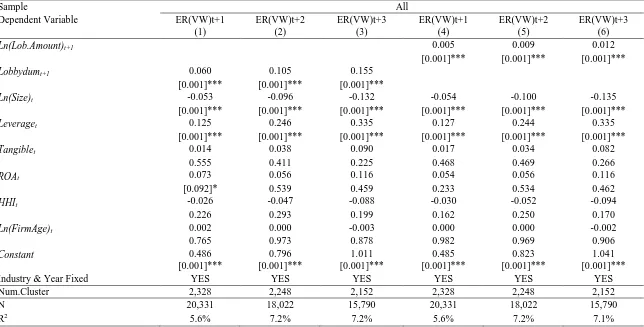
Table 9 presents the regression results of estimating the relationship between lobbying and excess returns. Our results are mostly consistent with the prior studies in which lobbying increases stock returns over time (Hill et al., 2013; Chen et al., 2015). In Panel A, the first three columns show that lobbying firms, compared to non-lobbying firms, earn higher excess returns in the next 1, 2 and 3 years following the lobbying action. Similarly, columns 4, 5 and 6 demonstrate that the amount of money spent on lobbying expenses is positively correlated with the excess returns in the following years. Panel A shows the results for all firms in our sample; however, our main objective is to determine whether the lobbying effect on stock performance differs depending on the political ideology of the CEO.
Panel B examines whether firms with Republican-leaning CEOs, which are lobbying a higher number of bills and spending more in lobbying expenditures, earn higher abnormal returns, controlling for other variables. The results in the first three columns reveal that lobbying firms have higher excess returns over the next 12, 24 and 36 months in our Republican sample. Nevertheless, the magnitude of the difference in excess returns between lobbyers and non-lobbyers is lower than that of the overall sample. Likewise, in columns 4, 5 and 6, if firm has lobbying expenditure, it has a positive effect on the following year’s excess return, although the magnitude is smaller, compared that of the whole sample. Panel C presents the same regressions for firms with Apolitical CEOs. We observe that lobbying and the amount of the money spent on lobbying is positively related to the excess returns in the subsequent years. Additionally, the magnitude of next period’s excess returns following lobbying action is larger for firms with Apolitical CEOs, compared to Republican ones.
10 We also have the results using buy and hold abnormal returns adjusted for equal-weighted market index, the