University of New Orleans University of New Orleans
ScholarWorks@UNO
ScholarWorks@UNO
University of New Orleans Theses and
Dissertations Dissertations and Theses
Summer 8-9-2017
Social norms and stock trading
Social norms and stock trading
Asem Alhomaidi aalhoma1@uno.edu
Follow this and additional works at: https://scholarworks.uno.edu/td
Part of the Business Law, Public Responsibility, and Ethics Commons, Corporate Finance Commons, and the Finance and Financial Management Commons
Recommended Citation Recommended Citation
Alhomaidi, Asem, "Social norms and stock trading" (2017). University of New Orleans Theses and Dissertations. 2373.
https://scholarworks.uno.edu/td/2373
This Dissertation is protected by copyright and/or related rights. It has been brought to you by ScholarWorks@UNO with permission from the rights-holder(s). You are free to use this Dissertation in any way that is permitted by the copyright and related rights legislation that applies to your use. For other uses you need to obtain permission from the rights-holder(s) directly, unless additional rights are indicated by a Creative Commons license in the record and/ or on the work itself.
Social norms and stock trading
A Dissertation
Submitted to the graduate faculty of the University of New Orleans
in partial fulfillment of the requirements for the degree of
Doctor of Philosophy in
Financial Economics
by
Asem Alhomaidi
B.A. King Saud University, 2006 M.S. Finance, University of Tampa, USA, 2009
M.S. Financial Economics, University of New Orleans, USA, 2016
Table of Contents
List of Tables iii
List of figures iv
Abstract v
CHAPTER 1 1
1. Introduction 1
2. Market segmentation, investor recognition, and Islamic finance 5
3. Previous findings on Islamic and conventional stock performance 8
4. Data and Methodology 10
5. Results and interpretation 12
5.1. Descriptive Statistics 12
5.2. Breadth of ownership 15
5.3. Investor Recognition 18
5.4. Information environment and stocks Synchronicity 24
5.5. Stock visibility and investor familiarity 29
5.6. Stock liquidity 34
6. Robustness checks 37
7. Conclusion 39
References 41
CHAPTER 2 45
1. Introduction and Motivation 45
2. Data and Stock Classifications 51
3. Methodology and Results 56
3.1. Simple model 56
3.2. Multi-factor model 57
3.3. Liquidity commonality 67
3.4. Cross-sectional regressions 71
3.5. Commonality dynamics 75
4. Robustness Checks 78
5. Concluding Remarks 82
References 83
List of Tables
Table 1 : Summary statisitcs
14
Table 0:2: Breadth of ownership
17
Table 3: stock Idiosyncratic volatility
21
Table 0:4: Cross-sectional regressions of idiosyncratic volatility
23
Table 5: Stock price Synchronicity with local and global macroeconomic factors
28
Table 6: Systematic and unsystematic turnover
31
Table 7: Cross-sectional regressions of Systematic and unsystematic turnover
33
Table 8: Stock liquidity And trading activity
36
Table 9: Robustness check
38
Table 10 : Summary statisitcs
55
Table 11: Stock returns comovement with same class
59
Table 12: Stock returns comovement with Islamic and conventional portfolios
62
Table 13: Stock return comovments using FF three-factor, Carhart four-factor, and PS
liquidity models
65
Table 14: Stock return comovements using FF three-factor, Carhart four-factor, and
PS liquidity models
66
Table 15: Commonality in liquidity within classes
70
Table 16: Cross-sectional regressions of comovements
72
Table 17: Comovements Difference-in-Difference
79
Table 18: Stock return and liquidity commonalities of Banks & Financial Service and
List of figures
Figure 1 :
Islamic and Conventional stocks distributions across market sectors
12
Figure 2 :
Islamic and Conventional stocks distributions across market sectors
53
Figure 3: Same-class stock return comovements
76
Figure 4: Same-class stock
liquidity commonality (Amihud’s (2002) illiquidity)
76
Abstract
The dissertation consists of two essays. In the first essay we compare the performance of Islamic and conventional stock returns in Saudi Arabia in order to determine whether the Saudi market exhibits characteristics that are consistent with segmented markets and investor recognition effects. We sample the daily stock returns of all Saudi firms from September 2002 to 2015 and calculate important measures, including idiosyncratic volatility (Ang et al, 2006), market integration (Pukthuanthong and Roll, 2009), systematic turnover (Loughran and Schultz, 2005), and stock turnover and liquidity (Amihud, 2002). Integration tests report that Islamic stocks are more sensitive to changes in global and local macroeconomic variables than conventional stocks, supporting the hypothesis that the Islamic and conventional stock markets are segmented in Saudi Arabia. In addition, our results show that Islamic stocks have larger number of investors, lower idiosyncratic risk, higher systematic turnover, and more liquid than conventional stocks, which supports the investor recognition hypothesis. Our results provide new evidence on asset pricing in emerging markets, the evolving Islamic financial markets, and the potential impact of other implicit market barriers on global financial markets. In the second essay we examine the effects of shared beliefs and personal preferences of individual investors on their trading and investment decisions. We anticipate that the process of classifying stocks into Shariah compliant (Islamic) and non-shariah compliant (conventional) has an effect on investibility and acceptance of the stock especially by unsophisticated or individual investors. The wide acceptance of Islamic stocks between individual investors promote and facilitate the circulation of firm-specific information between certain groups of investors. Our results indicate that stock classification has an effect on the stock price comovement through increased stock trading correlation between the
groups of Islamic investors. The commonality in preferences between Islamic stocks’ holders
generate commonality in trading activity and in stock liquidity. We find that classifying a stock as an Islamic stock increases its price comovement with other Islamic stocks and also increases its commonality in liquidity.
JEL Classification: G1, G2, F3, P5
Keywords: Segmented markets, Islamic finance, emerging markets, asset pricing, investor
CHAPTER 1
The Effect of Implicit Market Barriers on Stock Trading and Liquidity
1. Introduction
A key role of financial markets is to produce the information and financial contracts
necessary to facilitate the transfer of capital in the most efficient way possible. Advances in
technology and regulatory reforms have recently reduced many of the physical and
information barriers to trade; however, potential physical, legal, philosophical, information,
and cultural barriers can impede capital flows and, ultimately, lead to segmented, potentially
inefficient global financial markets. Understanding the dynamics of these barriers may still
provide significant new economic insights. Emerging markets, aside from being an important
source of economic and financial market growth, can serve as important laboratories for
studying the relationship between market barriers, financial market integration, and
economic efficiency. In particular, the Islamic emerging financial markets represent a unique
opportunity to observe the impact that cultural differences, in the form of religious investment
restrictions, can have on the efficiency of the underlying financial markets. We begin to
address the effects of cultural market barriers and investor recognition by providing
important new results that examine the Islamic and conventional stock markets of Saudi
Arabia.
Islamic financial markets have begun to have a major impact in the global economy.
In particular, much research has focused on asset-pricing issues in light of emerging and
Islamic financial markets. Recently, Merdad, Hassan, and Hippler (2015) find that, by
complying with Sharia law, firms have lower stock returns than non-compliant, or
conventional, firms. We extend their analysis by examining whether the return difference
between the two classes of stocks are due to market segmentation, caused by religious-based
restrictions on the portfolios of Islamic investors, or from liquidity effects caused by investor
segmentation and investor recognition effects has important implications as to the efficiency
of emerging and Islamic financial markets.
We examine the stock market of Saudi Arabia for several important reasons. First, the
majority of traders in the Saudi stock market are individual traders, which gives us the
opportunity to test the effect of individual recognition on trading behavior. Secondly, Saudi
Arabia has a majority Muslim population, and it is known for its strong adherence to Sharia
law, which gives us the opportunity to test the effect of religious beliefs on investor
investment decisions and portfolio construction. Third, in Saudi Arabia, clerics and Islamic
finance scholars voluntarily screen stocks and financial instruments for their Sharia
compliance and attempt to disseminate this information to the public through different media
channels. This enables us to study the effect of such information on individual trading activity
and determine whether this type of stock classification acts to increase the recognition of
Sharia compliant stocks. Finally, Saudi banks, especially Islamic banks, encourage individual
investment in the stock market through their Murabaha personal loan products, which are
Islamic loans whereby a bank sells stock on credit its customers. The customers have the
discretion to choose among a portfolio of stocks, but the stocks must be Sharia-compliant.
Consequently, potential borrowers that may initially have no interest in investing in the stock
market are incentivized to gather information pertaining to Sharia compliant stocks. As a
consequence of these trends in the Saudi market, individual investors have become very
active in trading Saudi stocks, and, as documented by Saudi Stock Exchange (Tadawul), 90
percent of Saudi stocks are traded by individual investors1. Therefore, using the sample of
Saudi stocks makes it possible to examine the impact of sharia-compliance on measures of
market segmentation and investor recognition.
We examine the sample of daily Saudi Arabian-listed stock returns from 2002 to 2015,
and our results support the segmentation and impediment-to-trade hypothesis; conventional
stocks are isolated and segmented from Islamic stocks in the Saudi market, which creates an
implicit barrier to trade. We apply the Pukthuanthong and Roll (2009) measure of market
returns than conventional stock returns in Saudi Arabia. In some regressions, the percentage
of macroeconomic factors explaining Islamic stock returns is twice that explaining
conventional stock returns. One important implication of this result is that, since conventional
securities cannot be traded by Islamic investors, investors who invest in conventional
securities must hold undiversified portfolios and, thus, require a return premium for bearing
some idiosyncratic risk. To test this implication, we follow Ang et al. (2006) and estimate firm
idiosyncratic volatility as the variance of unexplained residuals estimated using the Fama and
French (1993) three-factor models, Carhart (1997) four-factor model, and Pastor and
Stambaugh (2003) liquidity model. The results show that Islamic stocks have higher visibility
and investor recognition, as indicated by estimated idiosyncratic risk, than conventional
stocks.
We also test the investor recognition hypothesis and the results indicate that the
differences in liquidity and trading activity between Islamic and conventional stock classes
comes mainly from the stock visibility and individual investor recognition of these stocks.
This finding means that conventional stocks are known to relatively few investors in the Saudi
markets, due to the fact that they do not meet Sharia requirements. Grullon et al. (2004) show
that stock liquidity increase with the size of a firm’s investor base, which he characterizes as
“the degree of firm visibility.”
Our empirical results indicate that Islamic stocks enjoy higher liquidity and more
trading activity than conventional stocks in Saudi markets. We find that Islamic stock
turnover is 20 percent higher than conventional stock turnover in the Saudi market. In
addition, according to Amihud’s (2002) liquidity measure, Islamic stocks are 24 percent more
liquid than their conventional counterparts in the Saudi market. Our results also imply that
the greater turnover of Islamic stocks comes completely from systematic turnover. We apply
a methodology similar to Loughran and Schultz (2005), and the results show that, when
investors trade stocks for market-wide reasons, they trade Islamic stocks. Our findings imply
that familiarity is an important criterion in determining trading. If investors trade in response
to information that concerns a particular stock, they have to trade that stock. On the other
market-wide ramifications, they choose to trade the stocks that they are familiar with; Islamic
stocks.
Our paper contributes to multiple strands of the literature. To our knowledge, ours is
the first study to examine the liquidity and trading activity differences between Islamic and
conventional stocks in the context of the market segmentation and investor recognition, and
this represents a significant contribution to the literature on the subject. Our results link
market segmentation and stock cross-listing to stock liquidity and trading activity by showing
that the market segmentation effect can result not only from explicit, but also from implicit
barriers, such as religious beliefs.
While prior studies have shown that firm visibility and recognition by investors can
be affected by media coverage (Fang and Peress, 2009), firm geographic location (Loughran
and Schultz, 2005), listings on exchanges (Kadlec and McConnell, 1994; Foerster and Karolyi,
1999), initiation of analyst coverage (Irvine, 2003), addition to stock indices (Shleifer, 1986;
Chen, Noronha, and Signal, 2004), hiring of investor relations firms (Bushee and Miller, 2012),
and increases in advertising expenditures (Grullon, Kanatas, and Weston, 2004). Our paper
contributes to this literature by showing that Sharia stock classification affect firm visibility
and recognition by equity market participants.
The results link investor recognition to stock liquidity by showing that Sharia stock
classification acts as a source of information dissemination to outside investors. Lastly, this
paper contributes to the growing literature on Islamic finance by showing that stock screening
and Sharia classification increases investor awareness of Islamic finance and the role of Sharia
compliance in the Saudi market. Our results imply that Islamic loans can benefit the economy
as a whole by increasing trading in stock markets, improving the circulation of money across
different economic sectors, and lowering the external costs of funds for Sharia-compliant firms
through increased liquidity and recognition. Furthermore, our results suggest that other
implicit market barriers may exist in financial markets, due to other philosophical and cultural
Our paper is also related to the growing literature on the effect of investor preferences
and social norms on portfolio choice and asset prices. Previous studies indicate that stock
prices are affected by preferences toward social responsible investing (Heinkel, Kraus, and
Zechner (2001), Geczy, Stambaugh, and Levin (2003)), political preferences (Hong and
Kostovetsky (2012)), religious and gambling preferences (Kumar, Page, and Spalt (2011)), and
social norms (Hong and Kacperczyk (2009)). Our paper contribute to this literature by
showing that the market outcomes are affected by the preferences of Islamic investors.
The remainder of this paper is organized as follows. In section 2, we show our
hypothesis development and in section 3, we review the relevant literature on Islamic finance.
Section 4 explains the data and methodology used in our analyses. Section 5 presents and
interprets the results. Section 6 summarizes the findings and concludes.
2. Market segmentation, investor recognition, and Islamic finance
As a part of efforts by Islamic scholars in providing important information to potential
investors, Islamic scholars began screening stocks in order to classify them as Sharia
compliant (Islamic), or non-Sharia compliant (conventional). Depending on each investor’s
level adherence to their Islamic beliefs, Islamic investors typically refrain from trading stocks
that are not compliant with Sharia law (conventional stocks) and will only trade Islamic, or
Sharia compliant, stocks. On the other hand, non-Muslim investors, who care less about
Islamic religious restrictions, will trade stocks regardless of whether they are Sharia compliant
(Islamic), or not. Based on this system, Islamic stocks will be accepted by a wider base of both
Islamic and conventional investors in Saudi Arabia, while conventional stocks will be traded
only by investors that do not place an emphasis on Sharia compliance.
We expect that, since the majority of stock trades in Saudi Arabia are conducted by
individual investors, a stock’s Sharia classification will affect its trading and liquidity through
two channels. First, Sharia classification creates an implicit barrier between two classes of
Sharia compliant. We call this the market segmentation hypothesis, or the
impediment-to-trade hypothesis.
To illustrate the segmentation hypothesis, consider a two-country model of “partial
segmentation” similar to that of Errunza and Losq (1985) in which investment barriers are
asymmetric: country 1’s investors can invest in country 2’s securities, but country 2’s investors
are prohibited from investing in country 1’s securities. Errunza and Losq (1985) show that
country 2’s (eligible) securities are priced as if markets were completely integrated, but
country 1’s (ineligible) securities command a “super risk premium”. If a company from
country 1 cross-lists its shares in country 2, comparative statics show that the risk premium
disappears, the share price increases, and the expected return decreases. A Similar situation
exists in segmented markets, where firms issue restricted shares that only local citizens can
hold and unrestricted shares that can be held by both local and foreign investors. Studies
uniformly find that unrestricted shares trade at premium prices, relative to those of restricted
shares. Also, Bailey, Chung and Kang (1999) find that unrestricted shares generally have large
price premiums, compared to restricted shares2. Therefore, an explanation of what occurs in
the Islamic markets is that there are two types of investors, Islamic and conventional investors.
Islamic investors trade only in Sharia-compliant stocks and cannot trade in conventional
stocks, whereas conventional investors can trade in both Islamic and conventional stocks.
In addition, Sharia classification actively promotes Islamic stocks by increasing the
base of potential investors for Islamic stocks and, therefore, makes Islamic stocks recognized
by a greater number of Muslim investors than conventional stocks. The wider base of potential
investors for Islamic stocks facilitates the dissemination of new information related to Sharia
compliant stocks and, therefore, increases their liquidity and trading activity. We call this the
investor recognition hypothesis.
2 Bailey (1994) suggests that the lack of alternative investments to low-yielding bank accounts drives
The idea that “neglected” stocks earn a return premium over “recognized” stocks has
been in existence for many years (e.g., Arbel et al., 1983). Merton (1987) develops an asset
pricing model that explains this apparent pricing anomaly. The key difference between
Merton’s model and standard asset pricing models such as the CAPM is that Merton’s model
assumes that investors only know about a subset of available securities and that these subsets
differ across investors.
A number of studies examine the effect of firm visibility and investor recognition on
stock performance. Loughran and Schultz (2005) examine the effect of firm’s geographic
location on stock visibility. Specifically, they compare urban and rural firms and find that
rural firm (firms with low visibility) stocks trade much less, are covered by fewer analysts,
and are owned by fewer institutions than urban firms (firms with high visibility).
Additionally, Grullon et al. (2004) use firm advertising expenditure as a measure of firm
visibility and they find that firms with greater advertising expenditures have a larger number
of both individual and institutional investors, and better stock liquidity. Fang and Peress
(2009) argue that media coverage increases firm visibility by increasing the breadth of
information dissemination and that stocks with high media coverage have a low idiosyncratic
volatility suggesting that it is highly recognized by wider base of investors than stocks with
no media coverage. Other examples of the effect of firm visibility on stock market include;
listings on exchanges (Kadlec and McConnell, 1994; Foerster and Karolyi, 1999), initiation of
analyst coverage (Irvine, 2003), addition to stock indices (Shleifer, 1986; Chen, Noronha, and
Signal, 2004), and hiring of investor relations firms (Bushee and Miller, 2012),
There is also a growing literature that relates social norms, ethical screening, and social
responsibility to stock visibility and performance. For example, Heinkel, Kraus, and Zechner
(2001) examine the price implications of ethical constrained investment on polluting
companies. In a similar vein, Geczy, Stambaugh, and Levin (2003) find a sizeable effect of
socially responsible investing on the prices of screened stocks. Hong and Kacperczyk (2009)
show that sin stocks, i.e., publicly traded companies involved in the production of alcohol,
neglected by norm-constrained institutions.
3. Previous findings on Islamic and conventional stock performance
A large number of studies have compared Islamic stocks with their conventional
counterparts, in terms of returns. However, these studies give non-conclusive empirical
evidence of relative risk-adjusted performance of Islamic equity investments vis-à-vis
conventional ones. For example, on one hand, we have several studies that show Islamic
equities outperformed conventional ones in terms of both raw and risk-adjusted returns (e.g.
Alam and Rajjaque (2010); Ashraf and Mohammad (2014); Canepa and Ibnrubbian (2014);
Shamsuddin (2014); Charles et al. (2015)). On the other hand, we have other studies that find
that the risk-adjusted returns of Islamic equities to be no different from conventional ones
(e.g. Ahmad and Ibrahim (2002); Girard and Hassan (2008); Dharani and Natarajan (2011);
Walkshausl and Lobe (2012)). To add to this already mixed results, the recent study of Merdad
et al. (2015) show that in Saudi Arabia, Islamic stocks have a lower stock returns compared to
their conventional counterparts even after accounting for market, size, and book-to-market
effects.
In many studies which make comparisons of various aspects of performance and
risk-return profiles between Islamic and conventional equities, two common explanations are
often mentioned in making sense of the obtained empirical results. First, is that Islamic
equities have lower financial leverage and second, is that Islamic portfolios are less diversified
(firms are concentrated in fewer sectors). Few papers explore these two perspectives in detail.
Bhatt and Sultan (2012) examined whether financial leverage is a distinct and separate risk
factor that explains stock returns difference between Islamic and conventional stocks. They
found that although Islamic stocks were also quite sensitive to this leverage factor, the
sensitivity is significantly lower when compared to that of conventional stocks.
The question of whether Islamic stocks are less diversified has garnered growing
class that is distinct from conventional securities. The idea is that as a result of Sharia stock
screening, Islamic stock will have its own distinctive characteristics that sets it apart from
mainstream stocks. Returns from investment in such an asset class do not move in tandem
with conventional investment and the corresponding risk profiles are characteristically
different than those of unscreened stock portfolios.
Majdoub and Mansour (2014) and Balcilar et al. (2015) argue that Sharia compliant
equity sectors are concentrated in few industries and have a close linkage between real and
financial sectors, which result in a weak market integration between Islamic and conventional
equities leading to a considerable diversification benefits. Saiti et al. (2014), Abbes and Trichilli
(2015), and Mensi et al. (2015) provide similar results and suggested that the diversification
benefits are more pronounced in Islamic regions. Dewandaru et al. (2014) argue that
concentration of Islamic equities in few sectors and their low level of leverage give rise to their
dual exposure to local and global market shocks. Specifically, they find that while Islamic
portfolios are generally less exposed to shocks originating from inside the region, they are
more exposed to shocks originated from outside of the region.
In terms of stock sensitivity to macroeconomic factors, a number of studies gave
documented that Islamic stocks are more sensitive to global macroeconomic factors such as
oil prices and U.S. interest rates (e.g. Hammoudeh et al. (2014); Naifar (201); Yilmaz et al.
(2015)). Meanwhile, a study by Wahyudi and Sani (2014) examined the sensitivity of Islamic
capital market in Indonesia to some key macroeconomic variables and found that the Islamic
stocks are more sensitive to local fiscal policies. Canepa and Ibnrubbian (2014) argue that the
difference in performance between Islamic and conventional stocks cannot be explained by
any variant of the efficient market model and to reason things out, a behavioral finance model
is needed.
The conclusion of Dewandaru et al. (2015) support this reasoning. They argue that
lower sensitivity of Islamic stocks to local shocks is because their small size and low level of
leverage make them less attractive to stock analysts. This however does not necessarily imply
institutional investors who have a preference for, or are constrained to, Islamic stocks.
Hoepner et al. (2011) results also support the behavioral model explanation for the difference
between Islamic and conventional stocks performance. They find that the performance of
Islamic fund is positively related to the influence of Sharia law on consumers in its home
economy and that Islamic funds from Islamic economies with Muslim majority perform best.
4. Data and Methodology
We obtain our data from the following resources, daily stock returns and financial
information for from Global Compustat and Tadawul, monthly analyst coverage from
Institutional Brokers Estimate System (I/B/E/S), monthly macroeconomic factors from The
International Monetary Fund (IMF) database, monthly number of investors from Tadawul.
Stock returns and financial information data are from 2002 to 2015. Analyst coverage is
defined as the number of analysts reporting current fiscal year annual or quarter earnings
estimates each month and it covers the period from 2005 to 2015. Number of investors data
are on firm-level basis and cover the period from 2010 to 2015.
To classify the firms into Islamic or conventional, we use Sharia stock classification
reports published by Sharia scholars. Multiple Sharia stock classification by different Sharia
scholars and these classifications differ in the screening process and criteria for selecting
Islamic firms. But these classifications share some criteria, like the prohibited activities, which
include (1) activities that involve in any form of usury or interest rates (riba), for example,
borrowing or investing in interest bearing or fixed-income instruments. (2) Activities that
involve excessive risk, uncertainty, ambiguity, or deception (gharar). (3) Activities that are
related by any means to gambling, lottery, or game of chance (maysir). (4) Activities that are
related to non-halal businesses, such as those that deal with pork, adult entertainment,
tobacco, non-medical alcohol, and all other unethical businesses.
For many firms, it is quite difficult not to engage in some of these activities especially
add certain exceptions to the filtering process and the adherence to Sharia law. For example,
if a firm is engaged in an impermissible activity, the ratio of income generated by that
impermissible activity to the total income must be less than a certain percentage in order to
classify the firm as an Islamic firm, otherwise it will be considered as a non-Sharia compliant
or conventional firm. The classifications will differ in what percentage of income generated
by impermissible activities that the firm cannot exceed in order to be classified as an Islamic
firm.
In this paper, we rely on Dr. Al-Fozan’s 3 stock classification reports since it is
commonly used by investors, covers stocks listed in all sectors of equity market, and it is one
of the strictest classification, which insure that firms that are classified as Sharia-compliant by
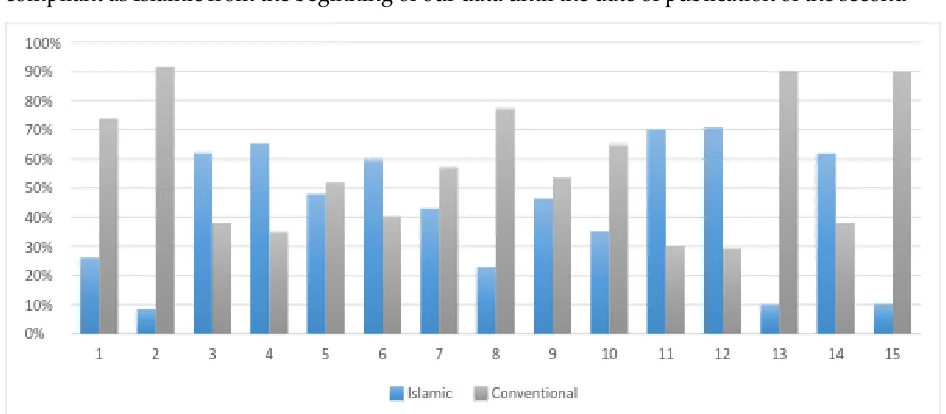
any other classification must be Sharia compliant according to this classification. Figure 1
shows the distribution of Islamic and conventional stocks across market sectors. It is
important to note that Islamic and conventional stocks are not equally distributed across
market sectors. For example, Conventional stocks dominate both Petrochemical Industries
and insurance sectors, whereas Islamic stocks dominate Real Estate Development and
Transport sectors. This distribution heterogeneity could cause endogeneity problem in our
results; the difference in visibility and investor familiarity between Islamic stocks or
conventional stocks could be attributed to the fact that these stocks belong to certain sectors
and not to the fact that they are classified as Islamic or conventional. To address this issue, we
control for sector differences by adding dummy variable for industries or market sectors.
The data on stock classification were is obtained from published Sharia stock
classification reports issued by Sharia scholars. The first classification report published by Dr.
Al-Fozan was released on December 2007 and classifies 28 of the total 117 firms traded in
Saudi equity market as Islamic or Sharia-compliant firms. Since our data begins before the
3 Canepa and Ibnrubbian (2014) and Merdad et al. (2015) use an alternative classification of
Dr.Al-Osaimi which has the same level of strictness and popularity as Dr.Al-Fozan’s but it does not cover all sectors of equity market. According to Dr. Al-Osaimi, the reason for not classifying stocks in some sectors is because these sectors usually have their own Sharia board that take care of classifying stocks. We repeated our tests using Dr.Al-Osaimi’s classification and that didn’t affect our main
first classification report was published we assign firms that were classified as
Sharia-compliant as Islamic from the beginning of our data until the date of publication of the second
Figure 1 : Islamic and Conventional stocks distributions across market sectors
The industries are as follows: 1: Banks & Financial Services, 2:Petrochemical Industries 3:Cement, 4:Retail, 5:Energy, & Utilities, 6:Agriculture & Food Industries, 7:Telecommunication & Information Technology, 8:Multi-Investment, 9:Industrial Investment, 10:Building & Construction, 11:Real Estate Development, 12:Transport, 13:Media and Publishing, 14:Hotel & Tourism, and 15:Insurance.
report. The classification reports are revised periodically to add or remove firms from Islamic
or Sharia-compliant firms according to the criteria mentioned earlier and we update our
sample to match these reports. Sharia stock classification reports are publically available on
the internet and the total number of published reports until the end of 2015 was nine reports4
and the total number of stocks that have been classified as Sharia-compliant in the last report
was 89 out of 177 firms traded in the Saudi equity market.
5. Results and interpretation
5.1. Descriptive Statistics
Before we examine liquidity and trading activity of conventional and Islamic stocks,
we analyze the differences in firm characteristics and performance between the two classes.
Table 1 shows the summary statistics of firms during the sample period, which spans from
Jan 2002 to Dec 2015. We separate firms into two groups, Islamic and conventional firms,
based on Al-Fozan’s stock classification. Conventional firms tend to have a wider firm size
distribution than Islamic firms, as indicated by their firm market capitalization standard
deviation which is twice as large as that of Islamic firms. The mean firm size of conventional
firms is higher than that of Islamic firms but conventional firms have a median firm size that
is lower than the median firm size of Islamic firms.
In terms of book-to-market ratio, both groups have a similar statistics and the
difference between the two class is very small. Islamic firms have a lower leverage ratios and
this is expected since one of the main Sharia-compliance classification criteria hinges on firm
leverage level. In term of profitability, Islamic firms are more profitable than conventional
firms as indicated by their higher return-on-assets ratio. The mean and median ROA for
Islamic firms are three times as much as that of conventional firms, but Islamic firms’
profitability is slightly less stable than that of conventional firms as indicated by their ROA
volatility. Islamic firms are also older than conventional firms and the have a higher number
of firms that pay dividends as indicated by their high average of dividends payer dummy.
In terms of stock liquidity and trading activity, conventional stocks are more actively
traded but less liquid than Islamic stocks as indicated by their high turnover ratio and less
ILLIQ and ILLIQMA statistics. The price range of Islamic and conventional stocks are very
similar, which suggests that investors will have no preference of one class over the other based
on stock prices. Islamic stocks have a lower daily stock return than conventional stocks which
is consistent with the results of Merdad et al. (2015). Average stock return volatility and
momentum are lower in Islamic stocks than conventional stocks and this should attract the
attention of more individual investors, however, Islamic stocks have a higher number of
Table 1 : Summary statisitcs
This table shows summary statistics for Saudi stocks during the period from 2002 to 2015 separated based on Al-Fozan’s classification into Islamic and conventional stocks. “Size” is the market capitalization calculated as the stock closing price at the end of the year times the number of shares outstanding, “BM” firm quarterly Book-to-market ratio,” Leverage” firm quarterly debt to assets ratio, “ROA” firm quarterly return on assets, “VROA” is firm quarterly ROA volatility over the past 3 years, “Firm Age” is the number of months since the stock is available in our data, “DD” is a dummy variable that equal one if the firm pay dividends, zero otherwise, “Turnover” stock daily trading volume over total shares outstanding, “ILLIQ” stock daily Amihud’s (2002) illiquidity, “ILLIQMA” stock daily Amihud’s illiquidity relative to the market
average, stock “Closing price”, stock “Daily returns”, stock daily “Return volatility” during the month, “Momentum” is the average monthly returns during the past six months “Number of analyst”, “ Number of investors” reported at the end of each month, and “ Number of firms”
in each class every year.
Variable
Islamic firms Conventional firms
Mean Median Std.
Dev. Min Max Mean Median
Std.
Dev. Min Max
Size 6,062 1,887 14,789 212 115,230 12,200 1,490 35,932 136 365,094
BM 0.57 0.50 0.34 0.08 2.60 0.58 0.51 0.33 0.08 3.55
Leverage 16.1% 9.1% 17.0% 0.0% 58.4% 27.5% 25.9% 20.5% 0.0% 65.8%
ROA 6.0% 6.1% 10.4% -77.5% 38.5% 2.3% 2.1% 8.4% -131.0% 47.1%
VROA 0.027% 0.009% 0.046% 0.000% 0.340% 0.026% 0.007% 0.047% 0.000% 0.355%
Firm Age 83.36 81.00 48.61 1.00 162.50 76.64 70.50 43.79 1.00 162.50
DD 0.42 0.00 0.49 0.00 1.00 0.36 0.00 0.48 0.00 1.00
Turnover 3.4% 0.8% 8.0% 0.0% 39.8% 3.9% 1.0% 9.2% 0.0% 44.2%
ILLIQ 2.94 0.05 346 0.00 6.13 25.10 0.05 2600 0.00 13.00
ILLIQMA 0.93 0.42 2.25 0.00 7.50 1.04 0.39 3.11 0.00 10.66
Closing price 38.26 29.64 27.67 5.35 142.00 32.36 26.61 20.51 3.75 134.25
Daily returns 0.04% 0.03% 2.55% -9.34% 9.60% 0.06% 0.04% 2.99% -9.76% 9.86%
Return
volatility 0.065% 0.080% 0.042% 0.003% 0.423% 0.090% 0.102% 0.056% 0.005% 0.510%
Monthly
Momentum 1.35% 0.71% 8.03% -22.36% 396.24% 1.91% 0.99% 9.16% -58.94% 352.73%
#Analyst 1.42 0.00 2.80 0.00 19.00 1.27 0.00 2.83 0.00 15.00
#Investors 62,760 22,788 106,649 1,849 699,437 56,251 20,530 93,853 2,054 608,361
1.1. Breadth of ownership
In this section we examine if investors are more likely to buy stocks of firms that have
been classified as Islamic or Sharia-compliant. To do this, we are going to perform a
cross-sectional regression to test the difference between the two stock classes in terms of number of
investors investing in each firm. The summary statistics in table 1 suggests that Islamic firms have
an average number of investors of 62,760 compared to 56,251 for conventional firms. The table
also shows that Islamic firms are higher than conventional firms in terms of median, minimum,
and maximum number of investors. Since Islamic and conventional firms differ in their firm
characteristics, the univariate analysis is not sufficient to draw conclusion.
Nest, we analyze in a multivariate regression framework the difference between the two
stock classes in term of breadth of ownership. We regress the natural logarithm of the number of
shareholders against a classification dummy variable that takes one if the stock is classified as
Islamic and zero otherwise, and a set of control variables suggested in Grullon et al. (2004) to
explain cross-sectional variations in the breadth of ownership. We expect the number of
shareholders to increase with firm size (capitalization) and this is because larger firms more likely
to have greater analyst coverage and press coverage and also have more shares available to
potential investors. Therefore, we include the market capitalization as a control variable to
account for such size effects. We also include the inverse of the share price since some investors
prefer stocks within certain price ranges due to the transaction cost associated with these stocks.
Stock liquidity may also be preferred by a larger group of investors, therefore, we include stock
turnover as an additional control variable. Investors also prefer profitable stocks and stocks that
have a positive return momentum so we use return on assets “ROA” and stock price performance
over the last six months as control variables.
Stock return volatility, firm age, and debt to assets ratio are employed as proxies for
skewness and outliers in stock return volatility and firm age, we use the natural logarithm of
these variables. It is important to note that many of the above variables control for any effect
related to stock visibility, familiarity, or investor
recognition and the only left effect should be related to the effect of investor preference toward
one of the two classes of stocks. Since Islamic and conventional stocks are not uniquely
distributed across equity market sectors, we include a dummy variable for every industry except
one industry to control for difference in investors’ preferences toward certain market sectors or
industries.
For each of the 72 months over 2010 to 2015, for which we have the number of investors
in each firm is available in our data, we run monthly cross-sectional regressions as follow:
Log( investors)𝑖,𝑡= 𝛼𝑡+ 𝛽1𝑡 𝐼𝑠𝑙𝑎𝑚𝑖𝑐 + 𝛽2𝑡 𝐿𝑜𝑔(𝑆𝑖𝑧𝑒) + 𝛽3𝑡𝑅𝑂𝐴 + 𝛽4𝑡 𝐿𝑜𝑔(𝐴𝑔𝑒) +
𝛽5𝑡𝑀𝑜𝑚𝑒𝑛𝑡𝑢𝑚 + 𝛽6𝑡𝐿𝑜𝑔(𝑅𝑉) + 𝛽7𝑡𝐼𝑛𝑣𝑝 + 𝛽8𝑡 𝐿𝑜𝑔(𝑇𝑢𝑟𝑛𝑜𝑣𝑒𝑟) + 𝛽9𝑡𝐷𝐷 +
𝛽10𝑡 𝐿𝑒𝑣𝑒𝑟𝑔𝑒 + 𝜀𝑖,𝑡 (1)
where 𝐼𝑠𝑙𝑎𝑚𝑖𝑐 is a dummy variable that takes one if the firm is classified as Islamic and zero
otherwise, 𝑆𝑖𝑧𝑒 is firm market capitalization, 𝑅𝑂𝐴 is the firm return on assets ratio, 𝐴𝑔𝑒 is number
of months since the stock was available in our data, 𝑀𝑜𝑚𝑒𝑛𝑡𝑢𝑚 is the average monthly stock
returns for the past six months, 𝑅𝑉 is daily stock return volatility over the past month, 𝐼𝑛𝑣𝑝 is
the inverse of share price, 𝑇𝑢𝑟𝑛𝑜𝑣𝑒𝑟 is stuck turnover in the past month, 𝐷𝐷 is a dividends payer
dummy variable that takes one if the firm paid dividend during the year and zero otherwise, ,
and 𝐿𝑒𝑣𝑒𝑟𝑔𝑒 is the firm debt to asset ratio. We also control for additional differences across
industries by including a dummy variable for industry.
Table 2 presents the results from the multivariate analysis. We calculate the time-series
average of the coefficients across the monthly regressions. To take into account serial correlation
Table:2: Breadth of ownership
In the regressions, the dependent variable is the log of number of investors for firm i at the end of the month t. Explanatory variables are an Islamic dummy variable which equals to one if the firm is
classified as Islamic and zero otherwise, “Size” is the natural log of firm market value, “ROA” firm return on assets, “Age” is the number of month since the firm appears in our data, “Momentum” is the
average stock monthly return for the last six months, “RV” is daily stock return volatility over the past month, “1/p” is the inverse of share price, , “Turnover” is the stock monthly turnover for the past
month calculated as the ratio of traded stock volume over firm total shares outstanding, and “DD” is a
dummy variable that equals one of the firm pay dividends and zero otherwise. We also control for industry by including a dummy variable for each industry.The cross-sectional regressions weight each day equally. The parameter values are the average of the monthly cross-sectional regressions. In parentheses are the Fama–MacBeth t-statistics calculated using Newey-West corrected standard errors. Intercepts and coefficients on the industry dummies are not reported to save space.
Log ( Number of investors)
(1) (2) (3)
Islamic dummy 0.17 b 0.15 c 0.15 c
(2.95) (2.59) (2.38)
Size 0.36
a 0.40 a 0.41 a
(39.10) (27.67) (30.64)
ROA -0.93 a -0.84 a -0.68 c
(-4.57) (-4.12) (-2.53)
Log (Age) -0.95 a -0.97 a -0.95 a
(-18.97) (-18.65) (-17.20)
Momentum 0.64 0.57 0.52
(1.02) (0.87) (0.78)
Log (RV) 0.07 0.06 0.06
(1.81) (1.69) (1.45)
1/p 18.77 a 18.58 a 18.02 a
(11.61) (11.65) (13.53)
Log (Turnover) 0.06
a 0.06 a
(5.76) (5.23)
DD -0.15
(-1.64)
R-squared 0.54 0.54 0.55
Number of obs. 72 72 72
(a) significant at 1% , (b) significant at 5% and (c) significant at 10%
Consistent with the results in table 1, we find that Islamic firms have a larger number of investors
is positive and statically significant at 1% level of significant except for the model where we
include firm leverage level.
The results are also economically significant. For example, an interpretation of the
coefficients on Islamic dummy variable suggests that Islamic firm have a 15% to 17% more
number of investors than a conventional firm that have the same size, profitability, trading
activity, and risk. The results also suggest that the number of common shareholders is positively
related to firm size, past returns, and stock return volatility and liquidity but negatively related
to firm profitability and age. The results also suggest that investors do not prefer dividends
paying stocks and stocks with high price range.
To sum up, the results above suggest that after controlling for variables that may proxy
for familiarity, visibility, or investor recognition, Islamic stocks are have a larger number of
investors compared to conventional stocks. This is consistent with our conjecture that Islamic
stocks are accepted by a wider
base of equity market participants, those who care about Sharia rules and stocks classification
and others who are careless about such classification. Thus Islamic stocks are held by both group
of investors, Islamic and conventional investors, whereas conventional stock are held by a fewer
number of investors, conventional investors only.
1.2. Investor Recognition
Since Islamic stocks are traded by both Islamic and conventional investors, they have a
broader clientele and, thus, have higher media and analyst coverage, which leads to a higher
degree of investor recognition. In addition, it is important to note that, in Islamic countries, a
major mechanism for Islamic banks to provide Islamic or Sharia-compliant loans is through the
purchase and sale of Islamic stocks. The use of Islamic compliant stocks to facilitate Islamic bank
liquidity of Islamic stocks. Secondly, it increases the Islamic stock investor base by introducing
new investors, bank borrowers, to the Islamic stock market.
If Islamic stock classification improves investor recognition, then its effect should be
stronger among stocks that would otherwise have a lower degree of recognition. In Merton’s
(1987) framework, firm idiosyncratic risk is priced, because of the imperfect diversification that
stems from a lack of investor recognition. Firms with higher idiosyncratic volatility should offer
a return premium to compensate shareholders for the undiversified risk they impose. In this way,
idiosyncratic volatility measures the amount of idiosyncratic risk borne by investors due to
imperfect diversification. Hence, there should be a clear difference in the idiosyncratic risk
between the two classes of stocks. The intuition behind this is that, since conventional stocks
cannot be traded by all the market participants, investors hold undiversified portfolios and
idiosyncratic risk should be priced in the Saudi market.
Following Ang et al. (2006), we estimate firm idiosyncratic volatility as the variance of
the residuals from regressing stock i daily excess returns using Fama and French (1993)
three-factor, Carhart (1997) four-three-factor, and Pastor and Stambaugh (2003) models as follow:
𝑅𝑖,𝑡 = 𝛼𝑖,𝑡+ 𝛽𝑖,𝑡 𝑀𝐾𝑇 + 𝑠𝑖,𝑡 𝑆𝑀𝐵 + ℎ𝑖,𝑡𝐻𝑀𝐿 + 𝜀𝑖,𝑡 (2a)
𝑅𝑖,𝑡 = 𝛼𝑖,𝑡+ 𝛽𝑖,𝑡 𝑀𝐾𝑇 + 𝑠𝑖,𝑡 𝑆𝑀𝐵 + ℎ𝑖,𝑡𝐻𝑀𝐿 + 𝑢𝑖,𝑡𝑈𝑀𝐷 + 𝜀𝑖,𝑡 (2b)
𝑅𝑖,𝑡 = 𝛼𝑖,𝑡+ 𝛽𝑖,𝑡 𝑀K𝑇 + 𝑠𝑖,𝑡 𝑆𝑀𝐵 + ℎ𝑖,𝑡𝐻𝑀𝐿 + 𝑙𝑖,𝑡𝐿𝐼𝑄 + 𝜀𝑖,𝑡 (2c)
The variance of the residuals 𝜀𝑖,𝑡 is estimated using firm-month regressions of daily stock returns.
Because the data for these factors are not available for Saudi Arabia, we followed Fama and
French (2012) and construct size (SMB), value (HML), and momentum (UMD) factors.
Specifically, we sort stocks on size (market capitalization) and momentum and on size and the
ratio of book equity to market equity (B/M). Size sorting is done at the end of June of each year
whereas value and momentum sorting are done monthly. Big stocks are those in the top 70% of
by 3 sorts on size and B/M and size and momentum produces six portfolios for value and
momentum factors.
We compute daily value-weight returns for each portfolio. The size factor (SMB) is the
equal-weight average of the returns on the three small stock portfolios from the 2 by 3 size-B/M
sorts minus the average of the returns on the three big stock portfolios. The value and momentum
factors, (HML) and (UMD), are the equal-weight average of the returns of small and big value
minus growth and winners minus losers respectively. To construct the, Liquidity factor (LIQ), we
follow Pastor and Stambaugh (2003) and sort stocks based on their sensitivity to market liquidity.
High liquidity stocks are those in the top 70% of liquidity beta, and small stocks are those in the
bottom 30%. The liquidity factor is the equal-weight average of the daily returns of high minus
low liquidity beta stocks.
If stock classification increases investor recognition and improves diversification, its effect
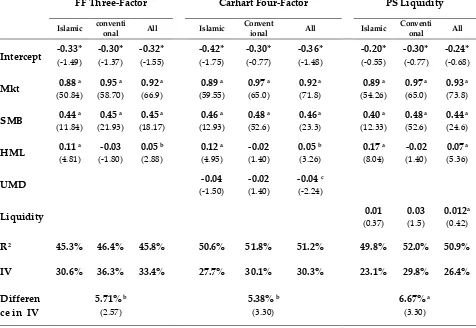
should be stronger among firms with higher idiosyncratic volatility. Table 3 shows the
idiosyncratic volatility of both classes of stocks. The the difference in idiosyncratic risk between
the two stock classes. We average the estimates cross-sectionally in each month and then across
months. Islamic stocks report lower idiosyncratic volatility than conventional stocks in any of the
three pricing models. The difference in average idiosyncratic risk between Islamic and
conventional stocks equals 5.71%, 5.38%, and 6.67% using Fama and French (1993), Carhart
(1997), and Pastor and Stambaugh (2003) multi-factor models which account for 18.7%, 19.4%,
and 28.9% of the average idiosyncratic volatility of Islamic stock, respectively. The difference is
statically significant at 5% level of significance in the first two models and at 1% level of
significance in Pastor and Stambaugh (2003) liquidity model.
Next, we want to examine, in a multivariate framework, whether firm characteristics can
explain the reported idiosyncratic volatility or is it because of the effect of Sharia stock
Table 3: stock Idiosyncratic volatility
This table reports average coefficients and Idiosyncratic volatility from monthly stock-level time-series regressions of daily firm returns Using Fama-French (1993) three-factor , Carhart (1997) four-factor, and Pastor and Stamaugh (2003) liquidity models.We report average coefficients for Islamic, conventional, and all stocks in the market. We average the coefficients cross-sectionally in each month and then across months. In parentheses are the Fama–MacBeth t-statistics calculated using Newey-West corrected standard errors. The sample period is from 2002 to 2015.
FF Three-Factor Carhart Four-Factor PS Liquidity
Islamic conventi
onal All Islamic
Convent
ional All Islamic
Conventi onal All
Intercept -0.33* -0.30* -0.32* -0.42* -0.30* -0.36* -0.20* -0.30* -0.24*
(-1.49) (-1.37) (-1.55) (-1.75) (-0.77) (-1.48) (-0.55) (-0.77) (-0.68)
Mkt 0.88 a 0.95 a 0.92 a 0.89 a 0.97 a 0.92 a 0.89 a 0.97 a 0.93 a
(50.84) (58.70) (66.9) (59.55) (65.0) (71.8) (54.26) (65.0) (73.8)
SMB 0.44 a 0.45 a 0.45 a 0.46 a 0.48 a 0.46 a 0.40 a 0.48 a 0.44 a
(11.84) (21.93) (18.17) (12.93) (52.6) (23.3) (12.33) (52.6) (24.6)
HML 0.11 a -0.03 0.05 b 0.12 a -0.02 0.05 b 0.17 a -0.02 0.07a
(4.81) (-1.80) (2.88) (4.95) (1.40) (3.26) (8.04) (1.40) (5.36)
UMD -0.04 -0.02 -0.04 c
(-1.50) (1.40) (-2.24)
Liquidity 0.01 0.03 0.012a
(0.37) (1.5) (0.42)
R2 45.3% 46.4% 45.8% 50.6% 51.8% 51.2% 49.8% 52.0% 50.9%
IV 30.6% 36.3% 33.4% 27.7% 30.1% 30.3% 23.1% 29.8% 26.4%
Differen ce in IV
5.71% b 5.38% b 6.67% a
(2.57) (3.30) (3.30)
* numbers are multiplied by 1000
(a) significant at 1% , (b) significant at 5% and (c) significant at 10%
Ferreira and Laux (2007), we conduct our regression tests using the logistic transformation of
idiosyncratic volatility computed as:
Ψ𝑖,𝑡 = ln ( 𝜎𝑖𝜀,𝑡2
where 𝜎𝑖𝑡2 is total return volatility of stock i during the month t and 𝜎𝑖𝜀,𝑡2 is the idiosyncratic
volatility of stock i in month t. As with Ferreira and Laux (2007) we test firm idiosyncratic
volatility by running the following cross-sectional regression every month:
Ψ𝑖,𝑡 = 𝛼𝑡+ 𝛽1𝑡 𝐼𝑠𝑙𝑎𝑚𝑖𝑐 + 𝛽2𝑡 𝐿𝑜𝑔(𝑆𝑖𝑧𝑒) + 𝛽3𝑡 𝐵𝑀 + 𝛽4𝑡 𝑅𝑂𝐴 + 𝛽4𝑡𝑉𝑅𝑂𝐴 + 𝛽5𝑡𝐷𝐷 +
𝛽6𝑡 𝐿𝑜𝑔(𝐴𝑔𝑒) + 𝛽7𝑡𝐼𝑛𝑣𝑝 + 𝛽8𝑡 𝐴𝑛𝑎𝑙𝑦𝑠𝑡 + 𝛽9𝑡 𝐿𝑒𝑣𝑒𝑟𝑔𝑒 + 𝛽10𝑡 𝐿𝑜𝑔(𝐼𝑛𝑣𝑒𝑠𝑡𝑜𝑟𝑠) + 𝜀𝑖,𝑡
(2e)
Where Ψ𝑖,𝑡 is the logistic transformed relative idiosyncratic volatility computed form either model
(2a),(2b), or (2c), 𝐼𝑠𝑙𝑎𝑚𝑖𝑐 is a dummy variable that takes one if the firm is classified as Islamic and
zero otherwise, 𝑆𝑖𝑧𝑒 is firm market capitalization, 𝐵𝑀 is the firm book-to-market ratio, 𝑅𝑂𝐴 is the
firm return on assets ratio, 𝑉𝑅𝑂𝐴 is the firm quarterly ROA volatility during the last 12 quarters
or the past three years, 𝐷𝐷 is a dividends payer dummy variable that takes one if the firm paid
dividend during the year and zero otherwise, 𝐴𝑔𝑒 is number of months since the stock was
available in our data, 𝐼𝑛𝑣𝑝 is the inverse of share price, 𝐴𝑛𝑎𝑙𝑦𝑠𝑡 is the number of analyst covering
the stock, Leverage is the firm debt to asset ratio, and 𝐼𝑛𝑣𝑒𝑠𝑡𝑜𝑟𝑠 is the total number of investors
holding stock i at the end of the month t. We also control for additional differences across
industries by including a dummy variable for industry.
Table 4 presents three different versions of the monthly cross-sectional regression
equation (2e). We calculate the time series averages of estimates and adjust their standard errors
for autocorrelation using the Newey and West (1987) approach with twelve lags. The consistent
result is a significant negative relation between idiosyncratic volatility and a firm Sharia
compliance. In column (1) of the three different multi-factor models, for example, the regression
coefficient on the Islamic dummy variable is between -0.15 and -0.17 and it is statically significant
at 1% level of significance. This suggests that independent of any changes in other firm
characteristics, Islamic stocks, on average, have 15% to 17% lower idiosyncratic volatility
Table 0:4: Cross-sectional regressions of idiosyncratic volatility
The table reports Fama-MacBeth (1973) cross-sectional regression estimates, where the dependent variable is firm idiosyncratic volatility measured using monthly regression of firm daily stock returns using three different models. Independent variables are Islamic dummy variable that equals one if the
firm is classified as Islamic and zero otherwise, “Size” is the natural log of firm market value, “B/M”
Book-to-market ratio, “ROA” firm return on assets,“VROA” is firm quarterly ROA volatility over the
past 3 years, “DD” is a dummy variable that equals one of the firm pay dividends and zero otherwise, “Age” is the number of month since the firm appears in our data, “1/p” is the inverse of share price, Number of analyst, “Leverage” is firm debt to asset ratio and we put missing values for firms in Banks
& Financial Service and Insurance sectors, and “Number of investors” which is the total number of
investors for each firm at the end of the month (from Jan 2010 to Dec 2015). We average coefficients cross-sectionally each month and then across months. Intercepts and coefficients on the industry dummies are not reported to save space. In parentheses are the Fama–MacBeth t-statistics calculated using Newey-West corrected standard errors.
FF Three-Factor Carhart Four-Factor PS Liquidity
(1) (2) (3) (1) (2) (3) (1) (2) (3)
Islamic dummy -0.15
a -0.04 -0.06 c -0.15 a -0.05 -0.07 a
-0.17 a -0.04 -0.07 c
(4.4) (1.1) (2.2) (5.0) (1.5) (3.5) (3.5) (1.0) (2.4)
Size 0.002 0.01 0.08 a -0.01 -0.01 0.06 b -0.05 c -0.03 c 0.02
(0.1) (0.5) (3.5) (-0.5) (-0.3) (3.3) (-2.1) (-2.0) (1.3)
B/M 0.15 -0.03 0.06 0.15
c -0.02 0.07 0.20 c 0.05 0.12
(1.9) (-0.3) (0.7) (2.1) (-0.2) (0.7) (2.4) (0.8) (1.3)
ROA 4.02
a 4.09 a 5.07 a 4.11 a 4.13 a 5.25 a 4.88 a 5.02 a 4.94 a
(5.9) (5.2) (6.4) (6.0) (5.2) (7.0) (8.6) (7.5) (6.9)
VROA -7.22 46.15 -26.4 -10.42 42.54 -27.6 0.94 43.12 -28.0 (-0.3) (1.4) (-0.7) (-0.4) (1.3) (-0.7) (0.0) (1.5) (-0.8)
DD 0.03 0.03 0.05 0.03 0.04 0.04 0.03 0.01 0.03
(1.3) (1.1) (1.9) (1.7) (1.6) (1.8) (1.3) (0.7) (1.3)
Log (Age) -0.28
c -0.34 a -0.35 a -0.28 c -0.32 a -0.32 a -0.33 b -0.30 a -0.28 a
(-2.2) (-3.4) (-5.6) (-2.3) (-3.5) (-5.2) (-3.3) (-3.6) (-5.5)
1/p -6.16
a -5.85 a -4.46 b
-5.92 a -5.73 a -4.37 c
-6.08 a -6.56 a -5.52 b
(-4.7) (-4.0) (-2.8) (-4.0) (-3.5) (-2.5) (-5.6) (-4.3) (-3.4)
# of analysts -0.01 -0.06 c -0.04 a 0.00 -0.05 -0.04 a -0.05 c -0.16 -0.03 a
(-0.2) (-2.1) (-5.9) (-0.1) (-1.7) (-5.4) (-2.3) (-1.8) (-3.7)
leverage 0.41
a 0.44 a 0.52 a
(3.4) (3.6) (3.9)
Log (# Investors) -0.07 a -0.06 a -0.06 a
(-4.7) (-4.1) (-5.0)
Number of
Regressions 126 126 72 126 126 72 108 108 72
The same conclusion can be drawn from column (3), which control for number of
investors, the estimated coefficient is between -0.06 and -0.07 with a t-statistic that is significant
at 5% level of significance for FF (1993) and PS (2003) multi-factor models and at 1% level of
significance in Carhart (1997) model. This suggest that even after controlling for the number of
investors, Islamic stocks’ investors hold a more diversified portfolio than that of conventional
stocks’ investors. When we control for leverage in column (2), the coefficient on Islamic dummy
variable still have the negative sign but it lose it statistical significance. This suggests that the
negative relationship between Islamic classification and idiosyncratic volatility could be driven
by the firm level of leverage, but this conclusion is ruled out by the fact that the negative and
statically significant coefficient on leverage variable indicates that higher level of leverage
decreases stock’s idiosyncratic volatility.
These results clearly indicate that Islamic stocks are held by broader investor base than
conventional stocks and this is consistent with our hypothesis that Islamic stocks are traded by
all type of investors, Islamic and conventional, and that conventional stocks, as indicated by their
high level of idiosyncratic risk, held by narrower base of investors, conventional investors, who
do not care about Sharia stock classification. The difference in idiosyncratic risk also suggests that
conventional stocks suffer from isolation and supports our hypothesis of market segmentation.
Conventional stocks are traded by fewer investors, because they are restricted from being traded
by Islamic investors, which leads to conventional stocks being segmented and isolated from
Islamic stocks. Therefore, conventional stocks have to compensate their investors in the form of
an additional risk premium for being undiversified.
1.3. Information environment and stocks Synchronicity
et al. (2000) suggest that limitations on informed arbitrage may explain the differences in return
synchronicity between international equity markets. We expect that the limitation on Islamic
investors to trade non-Islamic stocks will create a barrier between the two classes of stocks that
leads synchronicities of stocks returns with local and global economic factors to differ between
the two classes. We also expect that Islamic investors to share many common experiences and
similar perspectives with each other and also follow a similar way to gather and process
information, therefore, they are more likely to arrive at similar investment decisions, which can
lead them to converge in stock selections and buy/sell decisions. Eun et al. (2015) suggest that
culture influences stock price synchronicity by affecting a country’s information environment and
correlations in investors’ trading activities.
To test whether the two classes are informationally segmented, we follow Morck et al.
(2000) and Pukthuanthong and Roll (2009) and use R2 from regressing individual stock return on
local or global macroeconomic factors as a measure of stock synchronicity and integration with
other stock in the market. If Islamic and conventional stocks have R2 or synchronicity that is not
statically different, we say that they are informationally integrated and there is no limitation or
barrier to trade them and if they have a statically different R2, we say that they are informationally
segmented. Also, high R2 means more information about local or global factors is incorporated
into stock prices compared to low R2.
To test stock local synchronicity, we use monthly macroeconomic factors that are available
in the International Monetary Fund database for Saudi Arabian economy. We follow the
methodology of Pukthuanthong and Roll (2009) and extract the first eight principal components,
which represent nearly 65% of total variation, from the monthly returns of 67 macroeconomic
factors that are available and use them as the local factors to estimate the following model: