FABRICATION OF SOLID SOLUTION TUNGSTEN-RHENIUM ALLOYS BY HIGH ENERGY BALL MILLING AND SPARK PLASMA SINTERING
by Cory C. Sparks
A thesis
submitted in partial fulfillment of the requirements for the degree of
Master of Science in Materials Science and Engineering Boise State University
BOISE STATE UNIVERSITY GRADUATE COLLEGE
DEFENSE COMMITTEE AND FINAL READING APPROVALS
of the thesis submitted by
Cory C. Sparks
Thesis Title: Fabrication of Solid Solution Tungsten-Rhenium Alloys by High-Energy Ball Milling and Spark Plasma Sintering
Date of Final Oral Examination: 31 March 2012
The following individuals read and discussed the thesis submitted by student Cory C. Sparks, and they evaluated his presentation and response to questions during the final oral examination. They found that the student passed the final oral examination.
Darryl P. Butt, Ph.D. Chair, Supervisory Committee Megan E. Frary, Ph.D. Member, Supervisory Committee Indrajit Charit, Ph.D. Member, Supervisory Committee
iv
ACKNOWLEDGEMENTS
Dr. Butt and Dr. Frary were wonderful advisors and I appreciate all the time and effort they gave me while working on this thesis. They were very patient with the trials and tribulations of having me as a graduate student. I would also like to thank Dr. Indrajit Charit for being on my committee.
Logan Ward was a huge help in almost all aspects of this research. The polishing and microstructural analysis of the fabricated samples would have taken much, much longer without his efforts. I have also received a lot of help from both graduate and undergraduate students in the Advanced Materials Laboratory and Frary Research group at Boise State University. Their time, expertise, and feedback were greatly appreciated.
v
vi ABSTRACT
Tungsten-rhenium powders of varying compositions were fabricated by spark plasma sintering (SPS). In initial exploration of the parameter space, W-25 at% Re powders were blended and consolidated by SPS at 1500 to 1900°C with sintering dwell times of 0 to 60 minutes. In addition, the influence of milling was investigated. W-25 at% Re powders were high-energy ball milled at 200 to 400 rpm for 5 hours and consolidated at 1700°C with sintering dwell times of 0 to 60 minutes. The sample densities, grain sizes, porosities, contamination level, and hardness values were measured. The
intermetallic content, specifically the fraction of σ-phase, of each sample was determined by scanning electron microscopy (SEM) in the backscatter mode and X-ray diffraction (XRD).
Processing parameters were optimized to yield high density and hardness values, with corresponding minimal grain growth, porosity, contamination, and minimal σ-phase content. The optimized process that was developed involved ball milling at 400 rpm for 30 hrs, followed by consolidation at 1800°C and hold times of 30 minutes. This process resulted in a complete solid solution between tungsten and rhenium, and no detectable σ -phase based on TEM/EDS characterization.
vii
viii
TABLE OF CONTENTS
ACKNOWLEDGEMENTS ... iv
ABSTRACT ... vi
LIST OF TABLES ... xii
LIST OF FIGURES ... xiii
LIST OF ABBREVIATIONS ... xix
LIST OF SYMBOLS ... xxi
CHAPTER ONE: INTRODUCTION ... 1
1.1 - Motivation for Research and Objectives ... 1
CHAPTER TWO: BACKGROUND INFORMATION ... 3
2.1 - W-Re Alloys ... 3
2.2 - Overview of Sintering Processes and Powder Metallurgy ... 6
2.2.1 - Shrinkage Background ... 10
2.3 - Development of Intermetallics ... 12
2.4 - High Energy Ball Milling ... 17
2.5 - Spark Plasma Sintering ... 22
2.5.1 - SPS Effects on Grain Size ... 23
CHAPTER THREE: EXPERIMENTAL METHODS ... 25
3.1 - Evaluation of W and Re powders ... 25
ix
3.2 - Reduction Process... 26
3.3 - Powder Processing ... 28
3.3.1 - Variable Milling and Temperature Powders ... 28
3.3.2 - Optimized Powders... 29
3.4 - XRD of Powders ... 29
3.4.1 - Variable Milling and Temperature Powders ... 29
3.4.2 - Optimized Powders... 29
3.5 - Sintering with SPS ... 29
3.6 - Sintering Profiles ... 33
3.6.1 - Variable Milling and Temperatures Powders ... 33
3.6.2 - Optimized Powders... 33
3.7 - Post-Processing of Samples ... 35
3.8 - Density Measurements ... 35
3.9 - Metallographic Preparation ... 35
3.10 - Evaluation with XRD ... 36
3.10.1 - Variable Milling and Temperature Samples ... 36
3.10.2 - Optimized Samples ... 37
3.11 - SEM/BSE Measurements ... 37
3.12 - SEM/EBSD ... 38
3.13 - SEM/EDS ... 39
3.13.1 - Variable Milling and Temperature Samples ... 39
3.13.2 - Optimized Samples ... 40
x
3.14.1 - Variable Milling and Temperature Samples ... 40
3.14.2 - Optimized Samples ... 41
3.15 - TEM and STEM/EDS ... 41
3.15.1 - Variable Milling and Temperature Samples ... 41
3.15.2 - Optimized Samples ... 42
CHAPTER FOUR: RESULTS AND DISCUSSION ... 43
4.1 - Variable Milling Energy and Temperature Trials ... 43
4.1.1 - Evaluation of As-Received Powders ... 43
4.1.2 - Reduced Powders ... 45
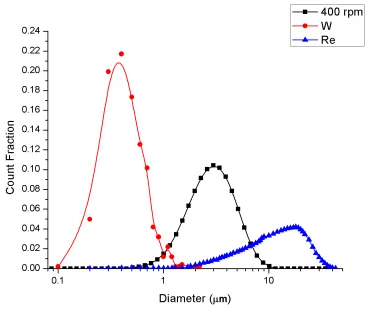
4.1.3 - Particle Size Distributions ... 46
4.1.4 - SEM Analysis of Milled and Blended Powders ... 47
4.1.5 - XRD of Powders ... 49
4.1.6 - Displacement Curves ... 51
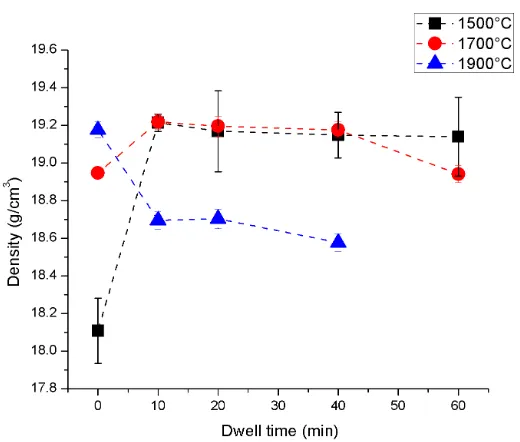
4.1.7 - Density Trends ... 52
4.1.8 - Shrinkage Model... 55
4.1.9 - Microstructure ... 58
4.1.10 - XRD of Pellets ... 62
4.1.11 - Intermetallic Content ... 64
4.1.12 - Tungsten Grain Growth ... 68
4.1.13 - Hardness Values ... 70
4.1.14 - TEM and STEM/EDS ... 72
4.1.15 - Contamination Effects from Media and Vessel ... 74
xi
4.2 - Optimized Samples ... 79
4.2.1 - Particle Size Distribution For Optimized Powders... 79
4.2.2 - SEM Analysis of Optimized Powders ... 81
4.2.3 - XRD of Powders ... 82
4.2.4 - Density Trends ... 85
4.2.5 - Porosity ... 86
4.2.6 - Displacement Curves ... 88
4.2.7 - Shrinkage Model... 89
4.2.8 - Microstructure ... 92
4.2.9 - EBSD ... 93
4.2.10 - XRD of Pellets ... 95
4.2.11 - Intermetallic Content ... 96
4.2.12 - Tungsten Grain Growth ... 98
4.2.13 - Hardness Values ... 101
4.2.14 - TEM and STEM/EDS ... 104
CHAPTER FIVE: CONCLUSIONS ... 109
xii
LIST OF TABLES
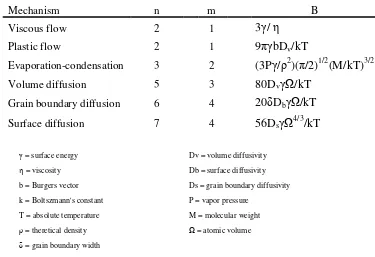
Table 1. Initial stage sintering mechanisms and associated parameters. Adapted from German.20 ... 11 Table 2. Variable milling energy and temperature sintering matrix ... 33 Table 3. Optimized sample sintering matrix with each condition processed 3 times
... 33 Table 4. Potential activation energies and mechanisms from shrinkage data for the
blended W-25 at% Re samples ... 57 Table 5. Potential activation energies and mechanisms from shrinkage data for the
milled W-25 at% Re samples ... 58 Table 6. Elements found in STEM/EDS area scan ... 74 Table 7. Optimized parameters for SPS powder consolidation of W-25 at% Re ... 77 Table 8. Optimized parameters for high-energy ball milling process of W-25 at%
Re ... 79 Table 9. Potential activation energies and mechanisms from shrinkage data for the
xiii
LIST OF FIGURES
Figure 1. Plots of DBTT as a function of average recrystallized grain diameter for pure tungsten and W-24Re/W-26Re (left) and hardness (VHN) as a
function of rhenium content (right). Adapted from Klopp.30... 4 Figure 2. Plot of high temperature strength of W-Re alloys as a function of rhenium
content. Steady creep rate 10-6 per second; temperature 1927°C (corresponds approximately to rupture life of 50 hrs). Adapted from Klopp.33 ... 4 Figure 3. Plot of tensile strength of dilute W-Re alloys at 371°C as a function of
rhenium content. Values compiled from three sources. Adapted from Klopp.32; 33; 58 ... 5 Figure 4. Schematic of two sphere model. Adapted from German.20 ... 8 Figure 5. Schematic of the two classes of sintering mechanisms as applied to a
partially sintered geometry. Surface transport mechanisms (evaporation-condensation, surface diffusion, volume diffusion) provide for neck growth by moving mass from surface sources while bulk-transport processes (plastic flow, grain-boundary diffusion, volume diffusion) provide for neck growth using internal mass sources. Only bulk transport mechanisms give shrinkage and densification. Adapted from German.20 .. 9 Figure 6. Phase diagram of W-Re system. Adapted from Klopp.30 ... 12 Figure 7. Optical image of σ-phase forming around round rhenium particle in
tungsten matrix. Adapted from Smith.52 ... 14 Figure 8. Average radius of Re (α) and σ-phases as a function of sintering time (left)
and volume fractions of Re (α) and σ-phases (normalized to theoretical density) as a function of time at 2325°C (right). Adapted from Smith.52 . 15 Figure 9. Time required for σ-phase dissolution for multiple temperatures as a
function of rhenium particle size. Adapted from Smith.52 ... 16 Figure 10. Schematic depicting the ball motion inside a planetary ball mill. Adapted
xiv
Figure 11. Particle size distribution as a function of milling time for NiTa. Adapted from Suryanarayana.10 ... 19 Figure 12. Schematic example of microstructural evolution for a ductile-brittle
system (oxide dispersion strengthen case), with increased milling time (a to c). Adapted from Suryanarayana.10... 20 Figure 13. Schematic of SPS sintering configuration ... 23 Figure 14. Reduction profile for tungsten and rhenium powders... 27 Figure 15. Milling vessel and media (left) and PM100 planetary ball mill (right) .... 28 Figure 16. SPS unit currently housed at CAES facility in Idaho Falls, Idaho ... 30 Figure 17. Photograph of two graphite punches, die, tungsten powders and resulting
pellet ... 31 Figure 18. Typical temperature and current profiles ... 34 Figure 19. Photographs of the post-processing steps: removal of grafoil, sectioning,
mounted in conductive epoxy (from left to right) ... 36 Figure 20. SEM/BSE image of σ-phase particles in a tungsten matrix (left) and after
highlighted using ImageJ software (right) ... 38 Figure 21. Indentation scheme for the cross-section of variable temperature sample 40 Figure 22. Indentation scheme for the cross-section of optimized sample ... 41 Figure 23. SEM images of as-received tungsten (left) and rhenium powders (right) 43 Figure 24. Particle size distributions for as-received tungsten and rhenium... 44 Figure 25. SEM images of tungsten (left column) and rhenium (right column) both
as-received (top row) and after hydrogen reduction (bottom row) ... 45 Figure 26. Particle size distributions for the W-25 at% Re powders milled with
xv
Figure 29. SEM images of W-25 at% Re powders ball milled at 200 rpm to 400 rpm ... 49 Figure 30. XRD scans for the blended and milled W-25at% Re powders ... 50 Figure 31. Overlaid Re 100% XRD peaks for blended and milled W-25 at% Re
powders ... 50 Figure 32. SPS ram displacement (left) and modeled displacement rate (right) as a
function of sintering time for the blended W-25 at% Re samples ... 51 Figure 33. SPS ram displacement (left) and modeled displacement rate (right) as a
function of sintering time for the milled W-25 at% Re samples ... 52 Figure 34. Density as a function of SPS dwell time for blended W-25 at% Re samples
... 53 Figure 35. Density as a function of SPS dwell time for milled W-25 at% Re samples
... 54 Figure 36. SEM images of W-25 at% Re sample sintered with no dwell (left) and 30
minute dwell (right) ... 55 Figure 37. Logarithmic shrinkage as a function of inverse temperature for the W-25
at% Re blended samples ... 56 Figure 38. Logarithmic shrinkage as a function of inverse temperature for the W-25
at% Re milled samples ... 58 Figure 39. SEM/BSE images of blended samples consolidated at 1500, 1700, and
1900°C for 0 to 60 minutes (mag. = 2500 X) ... 60 Figure 40. SEM/BSE images of ball milled samples consolidated at 1700°C for 0 to
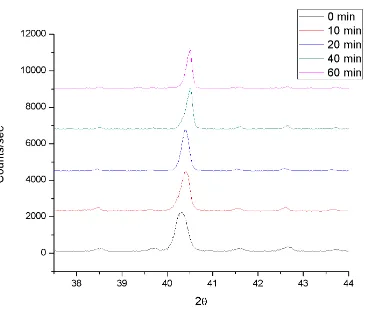
60 minutes (mag. = 2500 X) ... 61 Figure 41. XRD scans for the W-25 at% Re blended (1700°C) showing the 0-60
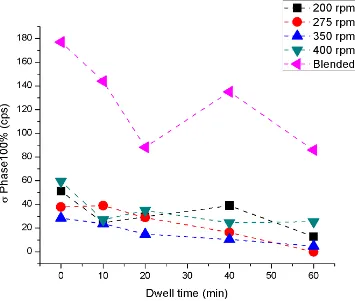
minute dwells; vertical lines indicate σ-phase 57 ... 62 Figure 42. Overlaid XRD scans for blended (1700°C) W-25 at% Re samples; vertical lines are σ-phase reference peaks.57 ... 63 Figure 43. The 100% peak intensity for σ-phase as a function of sintering dwell time
xvi
Figure 45. σ-phase area content for blended samples (left) and the calculated area from σ-phase radii measured by Smith and Hehemann (right) as a function of sintering dwell time.52... 66 Figure 46. σ-phase area content as a function of SPS dwell time for the W-25 at% Re
milled samples ... 67 Figure 47. Grain size as a function of SPS dwell time for the W-25 at% Re blended
samples. The measurement error bars were obscured by the symbols so were not included. ... 68 Figure 48. Grain size as a function of SPS dwell time for the W-25 at% Re milled
samples. The measurement error bars were obscured by the symbols so were not included. ... 69 Figure 49. Hardness as a function of SPS dwell time for the blended (1700°C) and
the 400 rpm W-25 at% Re samples... 71 Figure 50. TEM bright field image of W-25 at% Re milled at 400 rpm, consolidated
at 1700°C for 40 min. ... 72 Figure 51. STEM/EDS results for W-25 at% Re sample milled at 400 rpm,
consolidated at 1700°C for 40 min. ... 73 Figure 52. X-Ray spectrum found during STEM/EDS scan ... 74 Figure 53. Fe at% as a function of SPS dwell time determined through EDS ... 75 Figure 54. Particle size distributions for the optimized W-xRe powders milled for 30
h... 80 Figure 55. Comparison of particle size distributions for W-25 at% Re milled 5 hrs
and 30 hrs ... 81 Figure 56. SEM images of the optimized W-xRe powders ... 82 Figure 57. XRD scans for W-25 at% Re powders milled 0, 10, 20, and 30 hours;
vertical lines indicate rhenium peaks.37 ... 83 Figure 58. Lattice constant of W100% peak of W-25 at% Re as a function of milling
time ... 84 Figure 59. SEM images of optimized W-25 at% Re powders milled 30 hours showing
embedded combinations (top left) and layered powders (remaining
xvii
Figure 60. Density of optimized W-xRe samples as a function of SPS dwell time ... 86 Figure 61. Porosity in optimized W-xRe samples as a function of SPS dwell time .. 87 Figure 62. Measured density (left) and density inferred from porosity measurements
(right) for optimized W-xRe samples ... 88 Figure 63. SPS ram displacement (left) and modeled displacement rate (right) as a
function of sintering time for the optimized W-xRe samples ... 89 Figure 64. Logarithmic shrinkage as a function of inverse temperature for the
optimized W-xRe samples ... 90 Figure 65. Inferred grain boundary activation energies for the variable temperature,
milling speed and optimized samples ... 92 Figure 66. SEM images of optimized samples consolidated at 1800°C for 0 to 30
minutes (mag. = 2500 X) ... 93 Figure 67. EBSD inverse pole figure maps of W-3 at% Re and W-25 at% Re samples consolidated at 1800°C for 0 to 30 min. ... 94 Figure 68. Inverse pole figure (left) and grain shape aspect ratio (right) for W-25 at% Re sample ... 95 Figure 69. XRD scan of optimized W-25 at% Re sintered at 0, 15, and 30 minutes;
peaks other than tungsten at 40.5° are from mounting epoxy... 96 Figure 70. Box plot of σ area percent as a function of SPS dwelt time for W-10 at%
Re optimized samples ... 97 Figure 71. Box plot of σ area percent as a function of SPS dwelt time for W-25 at%
Re optimized samples ... 98 Figure 72. Grain size as a function of SPS dwell time for optimized W-xRe samples
... 99 Figure 73. Grain size as a function of rhenium content for optimized W-xRe samples
... 100 Figure 74. Average grain diameter in fracture zone of W-Re alloys. Test temperature
3630°F (2000°C). Adapted from Garfinkle.17 ... 101 Figure 75. Hardness (HVN) for the optimized W-xRe samples as a function of SPS
xviii
Figure 76. Hardness (HVN) as a function of rhenium concentration with comparison to data compiled by Klopp.30 ... 103 Figure 77. Bright field TEM image with SAD insert of optimized W-25 at% Re
sample (zone axis = [010]) ... 104 Figure 78. TEM bright field images of optimized W-25 at% Re sample consolidated
with 30 minute dwell time ... 105 Figure 79. STEM/EDS area scans showing image, tungsten, and rhenium
distributions (left to right) ... 106 Figure 80. X-Ray spectrum found during STEM/EDS area scan ... 107 Figure 81. STEM/EDS area scans showing image, cobalt, and zinc distributions (left
xix
LIST OF ABBREVIATIONS
BSE – Backscatter electron
CAES – Center for Advanced Energy Studies DBTT – Ductile to Brittle Transition Temperature EBSD – Electron backscatter diffraction
EDS – Energy Dispersive Spectroscopy FWHM – Full Width Half Maximum HEBM – High Energy Ball Milling
HRTEM – High Resolution Transmission Electron Microscopy LED – Light Emitting Diode
P/M – Powder Metallurgy PSA – Particle Size Analyzer PSD – Particle Size Distribution SEM – Scanning Electron Microscope SPS – Spark Plasma Sintering
xxi
LIST OF SYMBOLS
σ – W2Re3 intermetallic phase χ – WRe3 intermetallic phase γ = surface energy
η = viscosity
CHAPTER ONE: INTRODUCTION
1.1 - Motivation for Research and Objectives
Sintering tungsten or tungsten-rhenium alloys typically requires very high temperatures and long hold times due to their high melting temperatures. Spark plasma sintering (SPS), on the other hand, is a powder metallurgical technique that has produced samples of superior quality at lower temperatures and hold times compared to traditional consolidation techniques such as hot pressing and pressureless sintering. The process is unique in its ability to use rapid temperature ramp rates while also applying uniaxial pressure to powders, consolidating samples to almost theoretical densities.
While previous work at Boise State has shown the SPS technique capable of sintering tungsten powders at low temperatures and short hold times, the consolidation of W-Re powders is complicated by issues of alloy homogenization. The tungsten-rhenium system is only partially miscible and has two intermetallic phases, σ and χ. Both of these phases are detrimental to the mechanical properties of the alloy and will form when localized concentrations of rhenium above the solubility limit are present in the tungsten matrix.
2
microstructure. Unfortunately, extensive milling can also result in a high amount of contamination in the processed powders.
CHAPTER TWO: BACKGROUND INFORMATION
2.1 - W-Re Alloys
Tungsten has the highest melting temperature of all metals, high corrosion resistance, high thermal conductivity, high creep resistance, and the lowest vapor pressure of metals.13; 35 With these properties, tungsten-based alloys are candidates for many high temperature applications such as structural materials, aerospace, friction stir-welding, nuclear reactor cladding, thermocouples, and thermionic emitters.32; 36; 59 However, tungsten has a high ductile-to-brittle-transition temperature (DBTT) and its poor ductility at room temperature makes fabrication difficult.41 These problems can be alleviated by alloying tungsten with rhenium.
Figure 1. Plots of DBTT as a function of average recrystallized grain diameter for pure tungsten and W
rhenium content (right)
Figure 2. Plot of high temperature rhenium content. Steady creep rate 10
(corresponds approximately to rupture life of 50 hrs)
DBTT as a function of average recrystallized grain diameter for pure tungsten and W-24Re/W-26Re (left) and hardness (VHN) as a function of rhenium content (right). Adapted from Klopp.30
of high temperature strength of W-Re alloys as a function of Steady creep rate 10-6 per second; temperature
corresponds approximately to rupture life of 50 hrs). Adapted from Klopp
4
DBTT as a function of average recrystallized grain diameter ) as a function of
as a function of per second; temperature 1927°C
Figure 3. Plot of tensile strength of dilute W rhenium content. Values
al.33, and Witzke et al.58)
The concentration of rhenium in the alloy can yield different properties. Concentrations with 5 at% Re
strength; this phenomenon is thought to be due to a reduction in the Peierl’s stress when alloying.30; 35 Tungsten has the
concentrations close to the solubility limit the processing temperature
increase in the number of available slip planes with a smaller part associated with lower stacking fault energies, producing twinning effects
ensile strength of dilute W-Re alloys at 371°C as a function of alues compiled from three sources (Klopp & Witzke
). Adapted from Klopp et al.33
The concentration of rhenium in the alloy can yield different properties. Concentrations with 5 at% Re result in a hardness minimum, but the maximum creep strength; this phenomenon is thought to be due to a reduction in the Peierl’s stress when
Tungsten has the greatest ductility when alloyed with rhenium
concentrations close to the solubility limit, which is approximately 30 at% depending processing temperature.8 This ductilization effect is thought to be largely due to increase in the number of available slip planes with a smaller part associated with lower
producing twinning effects.30 The rhenium ductilization effect is
as a function of Klopp & Witzke32, Klopp et
The concentration of rhenium in the alloy can yield different properties. but the maximum creep strength; this phenomenon is thought to be due to a reduction in the Peierl’s stress when
ductility when alloyed with rhenium
30 at% depending on thought to be largely due to an increase in the number of available slip planes with a smaller part associated with lower
6
also believed to be due to a scavenger effect on light element interstitials, where the interstitials are re-distributed from low energy positions (such as dislocations and grain boundaries) to clusters within the lattice.35 This is thought to increase the grain boundary rupture strength of the W-Re alloy. Alloying to the solubility limit has little effect on the alloy’s melting temperature, as increasing rhenium content to 25 at% results in only a small drop in the melting temperature, decreasing from 3422 to 3050°C.36 Rhenium concentrations beyond the solid solubility limit will yield the intermetallic σ and χ -phases, which will be discussed in a following section of this thesis.
The biggest drawback to the incorporation of rhenium is its cost: the price of rhenium is approximately $900 per kilogram, compared to tungsten, which is approximately $50 per kilogram (as of early 2012).
2.2 - Overview of Sintering Processes and Powder Metallurgy
Tungsten and tungsten-rhenium alloys are commonly fabricated by powder metallurgy methods as casting ingots is a difficult and expensive process.36; 46 Furthermore, in a study by Stephenson, W-25 at% Re samples produced by powder metallurgical techniques had a lower secondary creep rate at 2200°C.46 So, processing W-Re powders via powder metallurgy is simpler, more cost-effective, and, at given temperatures, results in alloys less likely to rupture from applied stresses.
providing insight into the atomic mechanisms responsible for sintering.12; 26; 27; 29 The following discussion on sintering and sintering mechanisms relevant to this thesis is summarized from works by German.19; 20
The sintering process is a solid state reaction that forms solid bonds between particles when heated sufficiently. The driving force behind this reaction is the overall reduction in surface stresses. The surface stresses of the particles are a function of both the surface energy and the radii of the forming particles, otherwise known as the Laplace equation:
σ γ (1)
where σ is the surface stress, γ the surface energy, and R1 and R2 are the coalescing particle radii. As these particles are heated, a certain number of atoms can break free from their positions and move. The minimum energy required for these atoms to break their bonds is called an activation energy and the number of atoms that can overcome that activation energy can be expressed with the Arrhenius temperature relation:
exp
volume occupied by the particles. This reduction can be seen in
spherical particles bond together forming a neck at their interface. Given enough time and heat, the particles eventually
Figure 4. Schematic of t
There are two different types of mechanisms for atomic migration that occur during the sintering process
surface diffusion and evaporation
between the particles; however, the centers of the powders do not move and consolidation does not occur. In contrast
diffusion, along with plastic flow, will result in the centers of the p together, shrinkage in the compact
volume occupied by the particles. This reduction can be seen in Figure 4, where two spherical particles bond together forming a neck at their interface. Given enough time and
the particles eventually coalesce into a single mass.
Schematic of two sphere model. Adapted from German
There are two different types of mechanisms for atomic migration that occur during the sintering process (Figure 5). The lower temperature regime, consisting of surface diffusion and evaporation-condensation, yields no consolidation. A neck c
however, the centers of the powders do not move and consolidation In contrast, the higher temperature regime of grain boundary and volume diffusion, along with plastic flow, will result in the centers of the particles coming together, shrinkage in the compact, and an overall higher resulting density.
8
, where two spherical particles bond together forming a neck at their interface. Given enough time and
. Adapted from German.20
There are two different types of mechanisms for atomic migration that occur consisting of yields no consolidation. A neck can form however, the centers of the powders do not move and consolidation , the higher temperature regime of grain boundary and volume
Figure 5. Schematic of t
partially sintered geometry. Surface transport mechanis condensation, surface diffusion, volume diffusion)
moving mass from surface sources
grain-boundary diffusion, volume diffusion)
mass sources. Only bulk transport mechanisms gi Adapted from German.
There are three stages of sintering
of sintering is characterized by rapid growth of the inter
intermediate stage, pores become smoother but remain interconnected grain growth at the end of the
density, and higher amounts of grain growth. When consolidating powders, there clear distinction between
happens.
To a large extent, there are two approaches to sintering powders: conventional pressureless sintering and pressure
are generally pressed in a die at high pressures
Schematic of the two classes of sintering mechanisms as applied to a partially sintered geometry. Surface transport mechanisms
condensation, surface diffusion, volume diffusion) provide for neck growth by moving mass from surface sources while bulk-transport processes
boundary diffusion, volume diffusion) provide for neck growth using internal mass sources. Only bulk transport mechanisms give shrinkage and densification.
.20
There are three stages of sintering: initial, intermediate, and final. The initial stage of sintering is characterized by rapid growth of the inter-particle neck. During the
intermediate stage, pores become smoother but remain interconnected, and there is some grain growth at the end of the stage. Final stage sintering yields isolated pores, higher density, and higher amounts of grain growth. When consolidating powders, there
between the sintering stages or the dominant mechanisms occurring as it
xtent, there are two approaches to sintering powders: conventional pressureless sintering and pressure-assisted sintering. Conventionally sintered samples are generally pressed in a die at high pressures then the compact is then removed and
he two classes of sintering mechanisms as applied to a ms (evaporation-provide for neck growth by transport processes (plastic flow, provide for neck growth using internal ve shrinkage and densification.
initial, intermediate, and final. The initial stage particle neck. During the
and there is some stage. Final stage sintering yields isolated pores, higher density, and higher amounts of grain growth. When consolidating powders, there is no
the sintering stages or the dominant mechanisms occurring as it
xtent, there are two approaches to sintering powders: conventional assisted sintering. Conventionally sintered samples
10
thermally treated in a furnace at temperatures where diffusion can occur. This approach is simpler and cheaper than pressure-assisted sintering, which simultaneously applies stress to the powders while sintering. Benefits of pressure-assisted sintering are higher
densification rates, less porosity, and increased performance. Drawbacks are comparative cost and contamination from interaction between powders and die/punches, which
worsens with longer processing time.
2.2.1 - Shrinkage Background
There are different methods to determine the active mechanisms occurring during sintering. One approach is to use a shrinkage model for early stage sintering as seen in Equation 3:
(3)
where Lo is the initial length of the compact, ∆L is the change in length during sintering, t is the isothermal sintering time, and D, m, and n are materials constants. The variable B is given by:
B B e ! (4)
where Bo is a collection of material, temperature, and geometric constants, R is the gas constant, T is the absolute temperature, and Q is an activation energy associated with the atomic transport process. Inserting Equation 4 into Equation 3 yields:
"#
#$ %& '
()*+
A few simple mathematical steps will results in an equation that relates shrinkage to the inverse temperature during sintering.
ln "# #$
1ln
%& +
,-. 2 4563 (6)
Once the linear rate of change is determined, values of n associated with different diffusion mechanisms (as seen in Table 1) can be substituted in. The dominant
mechanism can be inferred after comparing the correlating activation energies with literature values for the likely mechanism.
Table 1. Initial stage sintering mechanisms and associated parameters.
Adapted from German.20
Mechanism n m B
Viscous flow 2 1 3γ/ η
Plastic flow 2 1 9πγbDv/kT
Evaporation-condensation 3 2 (3Pγ/ρ2)(π/2)1/2(M/kT)3/2
Volume diffusion 5 3 80DvγΩ/kT
Grain boundary diffusion 6 4 20δDbγΩ/kT
Surface diffusion 7 4 56DsγΩ4/3/kT
γ = surface energy Dv = volume diffusivity η = viscosity Db = surface diffusivity
b = Burgers vector Ds = grain boundary diffusivity k = Boltszmann's constant P = vapor pressure
T = absolute temperature M = molecular weight
ρ = theretical density Ω = atomic volume δ = grain boundary width
There is little contribution to densification during initial stage sintering.
research. However, while a dominant mechanism might shrinkage model, the effects of processing parameters
within the compacts and how this might change the consolidation process can be inferred.
Rhenium is only partially miscible in tungsten up to approximately 30 at% (depending on processing temperature). Localized rhenium concentrations above that solubility limit will result in the formation of intermetallic phases.
system has two intermetallic phases:
even in small quantities, is undesirable as they degrade the properties of the alloy
the two, σ-phase is the more problematic intermetallic as it is more stable and difficult to dissolve.52 The solubility limits for tungsten and rhenium along with compositional ranges for the two intermetallics can be seen in
Figure 6. Phase diagram of W
However, while a dominant mechanism might not be established using the shrinkage model, the effects of processing parameters on possible mechanisms occurring within the compacts and how this might change the consolidation process can be inferred.
2.3 - Development of Intermetallics
partially miscible in tungsten up to approximately 30 at% (depending on processing temperature). Localized rhenium concentrations above that solubility limit will result in the formation of intermetallic phases. The tungsten
tallic phases: σ and χ.52 The occurrence of either of these phases, es, is undesirable as they degrade the properties of the alloy
phase is the more problematic intermetallic as it is more stable and difficult to The solubility limits for tungsten and rhenium along with compositional
intermetallics can be seen in Figure 6.
Phase diagram of W-Re system. Adapted from Klopp
12
not be established using the on possible mechanisms occurring within the compacts and how this might change the consolidation process can be inferred.
partially miscible in tungsten up to approximately 30 at% (depending on processing temperature). Localized rhenium concentrations above that
The tungsten-rhenium The occurrence of either of these phases, es, is undesirable as they degrade the properties of the alloy.8 Of phase is the more problematic intermetallic as it is more stable and difficult to
The solubility limits for tungsten and rhenium along with compositional
The σ-phase is a large tetragonal structure containing 30 atoms in the unit cell but with no definite stoichiometry.5 It is very brittle and has high hardness values of up to HV 1300-2000.8; 14 A σ-phase particle is rhenium-enriched and, as rhenium has low diffusivity rates in tungsten, the dissolution of this intermetallic phase necessitates either high temperatures or long hold times to allow suitable amounts of diffusion to occur to where the alloy is considered homogeneous.15
Figure 7. Optical image of tungsten matrix
Smith and Hehemann average radius and volume of the dissolution of the σ and rhenium (
Optical image of σ-phase forming around round rhenium particle in tungsten matrix. Adapted from Smith and Hehemann.
Smith and Hehemann used a coarse-grid systematic point count to determine the and volume of the σ and rhenium phases.52 Figure 8 illustrates the
rhenium (α) particles in their compacts.
14
forming around round rhenium particle in .52
Figure 8. Average radius of Re ( (left) and volume fraction
density) as a function of time at 2325°C (right) Hehemann.52
With this information, and using a parabolic rate law to describe the rhenium particle, Smith and Hehemann
along with activation energies for both the rhenium and
extend these values to calculate the hold times necessary to dissolve
of sintering hold time at a given temperature. These relations can be seen in
Average radius of Re (α) and σ-phases as a function of sintering time (left) and volume fractions of Re (α) and σ-phases (normalized to theoretical density) as a function of time at 2325°C (right). Adapted from Smith
With this information, and using a parabolic rate law to describe the
rhenium particle, Smith and Hehemann were able to determine dissolution rate constants along with activation energies for both the rhenium and σ-phases.52 They could then extend these values to calculate the hold times necessary to dissolve σ-phase
a given temperature. These relations can be seen in
s as a function of sintering time (normalized to theoretical . Adapted from Smith and
With this information, and using a parabolic rate law to describe the dissolving were able to determine dissolution rate constants
Figure 9. Time required for function of rhenium particle size
Research by Smith and Hehemann show times, and small rhenium particles will result in less microstructure.52 Unfortu
their experiments are only valid above 2224°C and for pressure techniques similar to their inductor
phase develops and different mechanisms dominate the sintering and dissolution process. Also, the use of pressure assisted sintering methods would likely influence the evolution and dissolution of the phases within the alloy. Regardless, the
Time required for σ-phase dissolution for multiple temperatures as a function of rhenium particle size. Adapted from Smith and Hehemann
Smith and Hehemann shows that higher temperatures, longer hold mall rhenium particles will result in less σ-phase in an alloy’s
Unfortunately, the dissolution rates at given temperature determined in their experiments are only valid above 2224°C and for pressure less consolidation
techniques similar to their inductor-susceptor approach. Below those temperatures, rent mechanisms dominate the sintering and dissolution process. Also, the use of pressure assisted sintering methods would likely influence the evolution and dissolution of the phases within the alloy. Regardless, the results of Smith and
16
dissolution for multiple temperatures as a
and Hehemann.52
that higher temperatures, longer hold s
given temperature determined in less consolidation
susceptor approach. Below those temperatures, χ -rent mechanisms dominate the sintering and dissolution process. Also, the use of pressure assisted sintering methods would likely influence the evolution
Hehemann work provide a fundamental understanding of how σ-phase forms and dissolves as a function of processing parameters.52
2.4 - High Energy Ball Milling
High energy ball milling is a powder processing method that has been shown to be effective in synthesizing powders of unique or difficult-to-fabricate materials such as amorphous metals, tungsten-carbide, magnetically isotropic compounds, and difficult-to-alloy transition metal binary difficult-to-alloys.22; 51; 54 Mechanical milling can be a non-equilibrium processing technique able to synthesize materials with superior homogeneity, and refined and/or metastable crystal structures.34 It has also been shown to be successful at both refining grain size and mechanically alloying tungsten-rhenium powders.25; 43
Mechanical alloying was first developed by Benjamin et al. in an effort to
Figure 10. Schematic depicting the ball motion inside a planetary ball mill Adapted from Suryanarayana
These collisions fracture individual particles while also welding others together. The welding action can initially occur more rapidly than the fractur
overall larger particles. Eventually reached, as seen in Figure
result in two types of elemental powders forming homogeneous solid solutions
Schematic depicting the ball motion inside a planetary ball mill Adapted from Suryanarayana.10
These collisions fracture individual particles while also welding others together. The welding action can initially occur more rapidly than the fracturing, resulting in overall larger particles. Eventually, more particles begin to fracture and a steady state is
Figure 11. This continued process of fracturing and re result in two types of elemental powders forming homogeneous solid solutions
18
Schematic depicting the ball motion inside a planetary ball mill.
These collisions fracture individual particles while also welding others together. resulting in particles begin to fracture and a steady state is
Figure 11. Particle size distribution as a function of milling time for NiTa
There are many variables that Some of the important variables ratio, jar/media size and type
independent of each other. For instance, increasing the charge ratio has been seen to increase the overall energy imparted to powders
will restrict the internal movement within the vessel, limiting media
Ball milling two different powder types can have different results depending on the brittle or ductile nature of each type of powder.
such as tungsten and rhenium,
into lamellar structures while the brittle tungsten will fragment and the boundaries between the
ductile plates become thinner, more convolute
Particle size distribution as a function of milling time for NiTa Adapted from Suryanarayana.10
There are many variables that influence the effectiveness of mechanical alloying. important variables include milling time, milling speed and energy, charge
size and type.10 The effects these variables have on the powders are not independent of each other. For instance, increasing the charge ratio has been seen to increase the overall energy imparted to powders, but adding too much media to the jar
rict the internal movement within the vessel, limiting media-powder interaction. Ball milling two different powder types can have different results depending on the brittle or ductile nature of each type of powder. For a brittle and ductile combination gsten and rhenium, the theory is that the ductile rhenium powders will flatten into lamellar structures while the brittle tungsten will fragment and embed themselves at the boundaries between the ductile rhenium particles.4; 10 With longer milling
ductile plates become thinner, more convoluted, and the brittle and ductile components
Particle size distribution as a function of milling time for NiTa.
influence the effectiveness of mechanical alloying. energy, charge the powders are not independent of each other. For instance, increasing the charge ratio has been seen to
but adding too much media to the jar powder interaction. Ball milling two different powder types can have different results depending on
become more evenly distributed homogenization process by the ductile component.34 system can be seen in Figure
Figure 12. Schematic example of system (oxide dispersion strengthen case) Adapted from Suryanarayana
Mechanically altering the powders is somewhat of a necessity Re solid solution. Interdiffusion studies of arc cast tungsten and powde
rhenium by Arcella determined diffusion depths as a function of annealing temperature and time.3 To achieve a zone width comparable to the average diameter of commercially available rhenium would take hundreds to thousands of hours for temperatures between 1800°C and 2000°C. A reduction in the average size of the rhenium particles via ball milling would decrease the diffusion distance and necessary hold times.
Ball milling can decrease powder sizes and aid in the diffusion between binary compounds. Sintering
W-become more evenly distributed. The ball milling process can also aid the
homogenization process by enhancing diffusion pathways by the plastic deformation An example of the microstructural evolution for a ductile/brittle Figure 12.
Schematic example of microstructural evolution for a
(oxide dispersion strengthen case), with increased milling time (a to c) Adapted from Suryanarayana.10
Mechanically altering the powders is somewhat of a necessity in producing a W . Interdiffusion studies of arc cast tungsten and powder metallurgy rhenium by Arcella determined diffusion depths as a function of annealing temperature
To achieve a zone width comparable to the average diameter of commercially available rhenium would take hundreds to thousands of hours for temperatures between 1800°C and 2000°C. A reduction in the average size of the rhenium particles via ball
ould decrease the diffusion distance and necessary hold times.
Ball milling can decrease powder sizes and aid in the diffusion between binary -Re powders that are finer and/or have been mechanically
20
The ball milling process can also aid the
enhancing diffusion pathways by the plastic deformation in An example of the microstructural evolution for a ductile/brittle
microstructural evolution for a ductile-brittle milling time (a to c).
in producing a W-r metalluW-rgy rhenium by Arcella determined diffusion depths as a function of annealing temperature
To achieve a zone width comparable to the average diameter of commercially available rhenium would take hundreds to thousands of hours for temperatures between 1800°C and 2000°C. A reduction in the average size of the rhenium particles via ball
ould decrease the diffusion distance and necessary hold times.
alloyed to some degree can drastically reduce the time required for inter-diffusion to occur, yield less intermetallic phases, and induce superplasticity in the alloy.25; 43 Ball milling might also be useful in extending the solubility range of rhenium in tungsten. Supersaturated alloys have been synthesized with ball milling for many different systems and this would likely decrease the σ-phase concentration in the alloy.10
A drawback to the ball milling process is the rise in contamination levels within the powders. Provided the milling occurs in an inert environment (typically argon), the main source of contamination is likely to be the milling vessel and media. High energy ball milling is a high impact process and, as such, will result in the incorporation of material from the milling jar and media. Dissimilar media/vessel material will incorporate different elements into the powders. In contrast, matching the milling vessel and media material to the powder material will keep different element types out of the powder, but will change the powder composition. The amount of contamination can vary widely even with similar types of milling equipment. For instance, Froes et al. found Fe
contamination of 3500 ppm when ball milling W-25 wt% Re for 10 h.15 In a different study, Kim and Koch measured 5 at% Fe concentrations when milling Nb and Sn up to 30 h and Boldrick et al. found 3 to 40 at% Fe when milling 1 to 50 h.7; 28 Chen et al. used WC media in a SPEX 8000 steel vessel for higher density type media, yielding increased milling energies; however, they kept their milling times minimal to prevent
22
2.5 - Spark Plasma Sintering
Spark Plasma Sintering (SPS) is also known as pulsed electric current sintering (PECS), pulse discharge sintering (PDS), plasma activated sintering (PAS), pulse current sintering (PCS), plasma pressure compaction (P2C), and field activated sintering
technique (FAST), amongst others.45 The presence of either a spark or plasma is not agreed upon. Recent research using in situ atomic emission spectroscopy suggests that neither is present regardless of the conductivity of the powders.24
The SPS technique is a relatively simple process that has been used to consolidate metal, ceramic, intermetallic, and composite powders, typically with superior
Figure 13
2.5.1 - SPS Effects on Grain Size
The short ramp and hold times used by the SPS typically yield finer grain microstructures.23; 42; 44; 45
heating rate limits surface diffusion that occurs in early stage sintering less change in pore morphology
contributes to densification effects on tungsten’s high
and Klopp found that the creep behavior of fine
13. Schematic of SPS sintering configuration
Effects on Grain Size
short ramp and hold times used by the SPS typically yield finer grain 23; 42; 44; 45 Modeling work by Olevsky et al. indicated that a higher heating rate limits surface diffusion that occurs in early stage sintering.44
less change in pore morphology, which can limit grain boundary diffusion
contributes to densification. Limiting grain growth during sintering can have positive effects on tungsten’s high-temperature mechanical properties. Research by Sutherland and Klopp found that the creep behavior of fine-grained tungsten fabricated through
Schematic of SPS sintering configuration
short ramp and hold times used by the SPS typically yield finer grained indicated that a higher
This results in which can limit grain boundary diffusion, which
grain growth during sintering can have positive temperature mechanical properties. Research by Sutherland
24
powder metallurgy was stronger at 4800°F (2649°C) when compared to larger grained samples.53 In high temperature tensile testing at 2500°F to 4150°F (1371°C to 2282°C), a similar trend for arc-melted tungsten was determined. By decreasing the average grain diameter from 1 mm to 50 µm, the yield strength increased 80% and the ultimate tensile strength 40%.31 Strain hardening coefficients for recrystallized materials also increased with this drop in grain size.31 Furthermore, Ratliff et al. contended that decreasing grain size increases the grain boundary area, resulting in a lower impurity concentration and improved ductility.49
CHAPTER THREE: EXPERIMENTAL METHODS
The experimental component of this study was comprised of two components; the first to establish the effects of the SPS temperature and hold times, along with the ball milling energy on the tungsten-rhenium powders. This was accomplished by mixing one set of W-25 at% Re powders and varying the temperature and dwell time during SPS. A second set of powders (of the same composition) were ball milled with increasing rotational energy and the resulting powders sintered at one temperature with varying dwell times. The density, grain size, σ-phase content, and hardness values of both sets of consolidated samples were evaluated using SEM/BSE, TEM, XRD, EBSD, and
Archimedes method.
The second experimental component consisted of using parameters determined from the first set that result in little to no σ-phase, high density, low grain size, and porosity, along with minimized contamination. These processing parameters were used to fabricate alloy samples with rhenium compositions ranging from 0 to 25 at%.
Microstructural evaluation of these samples was conducted using characterization techniques similar to the first set.
3.1 - Evaluation of W and Re Powders
26
While Rhenium Alloys, Inc. provided a particle size distribution, Buffalo Tungsten did not. To characterize the particle size distribution of the tungsten powders, the diameters of 500 particles were measured from SEM images.55
3.1.1 - Particle Size Analysis
The as-received and milled powders were analyzed using a Horiba Partica LA-950 Laser Scattering Particle Size Distribution Analyzer (PSA). The following protocol and parameters were determined by an evaluation performed by Horiba Instruments Inc. on W and W-25 at% Re powder test samples.
Approximately 100 mg of each powder set was added to 50 mL 0.1% sodium pyrophosphate (NaPP) in water. The mixture was then ultra sonicated in a 50 W sonicator for 15 min and then applied to the PSA with an eye-dropper where it was circulated and agitated. The refractive index values for pure tungsten were 3.374 and 2.420i for the red LED and 3.701 and 2.946i for the blue LED. The parameters for W-25 at% Re were 2.951 and 2.42i for the red LED and 3.196 and 2.946i for the blue LED. For the compositions between W and W-25 at% Re, the real component for both refractive indices were interpolated and the imaginary component held constant.
3.2 - Reduction Process
using hydrogen, which bonds with the oxygen products.39; 40
Both tungsten and rhenium powders were loosely packed into two alumina crucibles and loaded into a 50 mm diameter alumina tube (CoorsTek, Golden, CO) housed in a high temperature furnace (Model 1730
Bloomfield, NJ). Both ends of the alumina tube were sealed and a mixture of N H2 gas (Praxair, Salt Lake City, UT, USA) flowed through into a bubbler at a rate of approximately 100 cm3/min. The temperature of the furnace was ramped
temperature of 850°C at a rate of 5°C/min, allowed to dwell for 6 h, and then ramped down at 5°C/min (profile seen in
transferred to an argon-filled glovebox (870
Figure 14. Reduction
The powders were examined both before and after the reduction process Hitachi-4500S SEM to ensure that
sintering occurred.
using hydrogen, which bonds with the oxygen, leaving water and pure metal
Both tungsten and rhenium powders were loosely packed into two alumina crucibles and loaded into a 50 mm diameter alumina tube (CoorsTek, Golden, CO) housed in a high temperature furnace (Model 1730-12 HT, CM Furnace, Inc.
Both ends of the alumina tube were sealed and a mixture of N gas (Praxair, Salt Lake City, UT, USA) flowed through into a bubbler at a rate of
/min. The temperature of the furnace was ramped
at a rate of 5°C/min, allowed to dwell for 6 h, and then ramped (profile seen in Figure 14). The powders were then quickly bagged and
filled glovebox (870-CLC , Lansing, MI) for further processing.
Reduction profile for tungsten and rhenium powders
The powders were examined both before and after the reduction process SEM to ensure that no changes in powder morphology with regards to
metal as the
by-Both tungsten and rhenium powders were loosely packed into two alumina crucibles and loaded into a 50 mm diameter alumina tube (CoorsTek, Golden, CO)
12 HT, CM Furnace, Inc. –
Both ends of the alumina tube were sealed and a mixture of N2– 6 at% gas (Praxair, Salt Lake City, UT, USA) flowed through into a bubbler at a rate of
/min. The temperature of the furnace was ramped to the hold at a rate of 5°C/min, allowed to dwell for 6 h, and then ramped
. The powders were then quickly bagged and CLC , Lansing, MI) for further processing.
for tungsten and rhenium powders
3.3.1 - Variable Milling and One 50 ± 0.004 g batch of in a multi-tank mixer (MTI, Inc.
powders of the same composition was milled in a Retsch PM100 planetary ball mill at 200, 275, 350, and 400 rpm
the milling media 10 mm
by weight (249g/50g) and a 5:1 duty cycle
down). The jar, media, and planetary ball mill can be seen in
Previous experimentation with YSZ media in the hardened steel vessel had shown the media rather than the vessel
was used as it was believe
milling media. Both the blended and milled samples were loaded and sealed in an argon filled glovebox to avoid oxidation during their respective processing.
Figure 15. Milling vessel and media (left) and PM100 planetary ball mill (right) 3.3 - Powder Processing
illing and Temperature Powders
One 50 ± 0.004 g batch of W-25 at% Re powders was blended at 150 xer (MTI, Inc., Richmond, CA). Another 50 ± 0.004 g batch of powders of the same composition was milled in a Retsch PM100 planetary ball mill at
rpm for 5 h. The milling vessel was a 250 mL hardened steel jar, the milling media 10 mm diameter WC-6 Co balls, the charge ratio ~5/1 media/powder
and a 5:1 duty cycle was used (5 min running and 1 min cool The jar, media, and planetary ball mill can be seen in Figure 15.
Previous experimentation with YSZ media in the hardened steel vessel had shown the media rather than the vessel as the prime source of contaminants. WC
was used as it was believed that an influx of WC would be preferable to Fe or Zr from the milling media. Both the blended and milled samples were loaded and sealed in an argon filled glovebox to avoid oxidation during their respective processing.
Milling vessel and media (left) and PM100 planetary ball mill (right)
28
blended at 150 rpm for 5 h ). Another 50 ± 0.004 g batch of
powders of the same composition was milled in a Retsch PM100 planetary ball mill at . The milling vessel was a 250 mL hardened steel jar,
5/1 media/powder (5 min running and 1 min cool
Previous experimentation with YSZ media in the hardened steel vessel had shown the prime source of contaminants. WC-6 Co media d that an influx of WC would be preferable to Fe or Zr from the milling media. Both the blended and milled samples were loaded and sealed in an
3.3.2 - Optimized Powders
Two batches of 60 ± 0.004 g of each composition (3 at% Re, 6 at% Re, W-10 at% Re, W-25 at% Re) were ball milled at 400 rpm for 30 h. The milling vessel and media was WC-6Co. The volume of the milling vessel was 125 mL and the media were 10 mm in diameter. The charge ratio was ~3.9/1 by weight (233.4g/60g) and a 5:1 duty cycle used.
3.4 - XRD of Powders
3.4.1 - Variable Milling and Temperature Powders
The blended and milled W-25 at% Re powders were characterized using an MPD X’Pert XRD tool (Phillips, Inc.). The diffractometer uses a Cu Kα x-ray source and
Bragg-Brentano geometry. The powders were scanned with a 2θ of 20 to 120° with a 0.02° step size.
3.4.2 - Optimized Powders
The powders for the optimized powder sets were characterized using an AXS D8 Discover XRD tool (Bruker, Inc.). The diffractometer also uses a Cu Kα x-ray source
with a nickel filter, Göbel mirror and germanium primary monochromator. Their scans utilized a Hi-Star area detector with a 2θ ranging from 20 to 50°.
3.5 - Sintering with SPS
30
this research has a maximum voltage and current of 20V and 1500A, respectively. The sintering chamber contains two water-cooled rams that also function as electrodes for the current. The rams have a maximum range of 65 mm and can apply up to 50 kN of force.
Figure 16. SPS unit currently housed at CAES facility in Idaho Falls, Idaho
Each sample was consolidated in a die and punch set made from AXF-5Q POCO high-strength graphite (Figure 17). The outer diameter of the die was 44.5 mm, the inner diameter 12.7 mm, and the height 30 mm. The die used two punches, which had
Figure 17. Photograph of two graphite punches, die, tungsten powders and resulting pellet
For each sample, the interior of the die was lined with high-purity graphite foil to prevent inter-diffusion between the powders and the carbon in the die. This resulted in a foil encapsulation that required significant grinding to remove, though without the foil the pellet could not be removed without breaking the die. For each sample, a 12 mm graphite foil disk was placed on top of the bottom punch and 8.0 ± 0.02 g were poured into the die. Another 12 mm graphite foil disk was placed on top of the powders and the top punch inserted. The graphite die was then covered with a 4 mm thick carbon felt insulation to minimize heat loss and the thermal gradient from the center of the punches to the edge of the die. Two circular layers of felt were also applied to the top and bottom of the die, with 12 mm holes cut out to allow punch access.
32
thick, 38.1 mm diameter cylinder on top of a 12.7 mm thick, 101.6 mm diameter cylinder. These separators protect the electrodes from both the high temperatures and force from the punch. The die is balanced on the top separator with the bore directed toward the pyrometer. Two complementary separators were then balanced on the top punch to protect the top electrode. The bottom ram was then raised, compressing the punches into the die. The pyrometer is then aligned and the chamber closed. For each sintering run, the chamber was evacuated and purged three times using a rough pump and argon supply. After the last purge cycle, a booster pump engages, which typically
decreases the pressure to 20-30 Pa (2 – 3 *10-4 torr).
The Dr. Sinter unit uses two automatic KP1000 controllers (Chino Corp.) for both the temperature and pressure. After entering the respective profiles, the controllers
automatically dictate the current output and ram force to increase or decrease the temperature or pressure, respectively. The data of the temperature, current, force, ram displacement, displacement rate, and chamber pressure were recorded with LabView software at a sample rate of one data point per second.
3.6 - Sintering Profiles
3.6.1 - Variable Milling and Temperatures Powders
The blended W-25 at% Re samples were consolidated at 1500°C, 1700°C, and 1900°C for 0, 10, 20, 40, and 60 min hold times. The ball milled W-25 at% Re powders were consolidated at 1700°C with identical dwell times. The constant parameters used for the SPS unit were a ram force of 5.0 kN (42.4 MPa), 100°C/min ramp rate, and low vacuum environment (~20 Pa). These sintering parameters can be seen in Table 2.
Table 2. Variable milling energy and temperature sintering matrix
0 min. 10 min. 20 min. 40 min. 60 min.
1500°C B B B B B
1700°C B, M B, M B, M B, M B, M
1900°C B B B B B
B = Blended W-25 at% Re
M = Ball Milled W-25 at% Re @ 200, 275, 350, and 400 rpm 3.6.2 - Optimized Powders
The variable composition optimized samples were consolidated at 1800°C with 0, 15, and 30 min dwell times with three samples fabricated for each parameter set to show process variability (Table 3). The constant SPS parameters were a ram force of 5.0 kN (42.4 MPa), 100°C/min ramp rate, and low vacuum environment (~20 Pa).
Table 3. Optimized sample sintering matrix with each condition processed 3
times
0 min. 15 min 30 min
W-3 at% Re x 3 x 3 x 3
W-6 at% Re x 3 x 3 x 3
W-10 at% Re x 3 x 3 x 3
The optical pyrometer ha
sintering run the controller would slowly increase the current until the die was above the minimum. The current would drop
programmed hold temperature of 600°C. After stabilizing for 2 min,
ramp back up such that the temperature ramp rate would be 100°C/min, which would be maintained until reaching
would shut off and the die set would quickly cool to room tempera typically take around 15-20 min.
measurement for a typical processing run is shown in
Figure 18
The optical pyrometer has a minimum temperature limit of 570°C sintering run the controller would slowly increase the current until the die
was above the minimum. The current would drop, allowing the temperature to return to a programmed hold temperature of 600°C. After stabilizing for 2 min, the current would ramp back up such that the temperature ramp rate would be 100°C/min, which would be
reaching the hold temperature. At the end of the hold time, the current the die set would quickly cool to room temperature, which would
20 min. The current and corresponding temperature measurement for a typical processing run is shown in Figure 18.
18. Typical temperature and current profile
34
a minimum temperature limit of 570°C, so for each sintering run the controller would slowly increase the current until the die temperature
allowing the temperature to return to a the current would ramp back up such that the temperature ramp rate would be 100°C/min, which would be
the hold temperature. At the end of the hold time, the current which would The current and corresponding temperature
3.7 - Post-Processing of Samples
After pressing the pellets out of the graphite die using a manual lever press, each sample would have encapsulating graphite foil surrounding its exterior. This would be polished off using a 74 µm diamond pad. The carbon in the graphite foil would also diffuse into the pellet, resulting in a visually darker region that would also need to be ground off with the diamond pad. The amount of time necessary to remove this carbon rich region was a function of the sintering temperature and dwell time but typically required approximately 20-40 min.
3.8 - Density Measurements
After sintering runs, the graphite paper encapsulating each sample was ground off and the densities measured using Archimedes principle. An analytical scale (Mettler Toledo, AB54-S) and associated density kit (33360) were used for all density
measurements. A thermometer was inserted into the water in the suspension beaker and the temperature allowed to stabilize before taking measurements. Each sample was measured five times in air and five times suspended in water. The samples were dried off with paper towels between suspension measurements.
3.9 - Metallographic Preparation
(Konductomet, Buehler, Inc.) while the other half miscellaneous experimentation.
The embedded samples were then ground with SiC polishing paper from 400 to 1200 grit. They were then polished with 1.0
felt pads. This was followed by vibratory polishing for six hours in After washing the sample in de
Murakami’s Reagent (10 mL hydroxide) using a cotton swab
water, dried with compressed air, and then stored in a vacuum chamber until microstructural characterization.
Figure 19. Photographs of
sectioning, mounted in conductive epoxy (
3.10.1 - Variable Milling and The cross section o and optimized) and the 1700
XRD tool. The samples were scanned scintillation point detecto
(Konductomet, Buehler, Inc.) while the other half was retained for TEM samples and us experimentation.
The embedded samples were then ground with SiC polishing paper from 400 to 1200 grit. They were then polished with 1.0 µm and then 0.3 µm Al2O3 slurries on nylon felt pads. This was followed by vibratory polishing for six hours in 0.05 µ
After washing the sample in de-ionized water, the sample was etched for 5 Murakami’s Reagent (10 mL water, 1 gram potassium ferricyanide, 1 g sodium
cotton swab. The samples were then quickly washed in de water, dried with compressed air, and then stored in a vacuum chamber until microstructural characterization. A post-processing flowchart can be seen
Photographs of the post-processing steps: removal of grafoil, sectioning, mounted in conductive epoxy (from left to right)
3.10 - Evaluation with XRD
illing and Temperature Samples
The cross section of each pellet for the ball milled samples (both variable energy and optimized) and the 1700°C blended set was characterized using an AXS D8 Discover
The samples were scanned with a 2θ ranging from 20-50° with a point detector, which utilized a step size of 0.02° with a hold time of
36
retained for TEM samples and
The embedded samples were then ground with SiC polishing paper from 400 to slurries on nylon
µm Al2O3 slurry. ionized water, the sample was etched for 5-7 s with
, 1 gram potassium ferricyanide, 1 g sodium . The samples were then quickly washed in de-ionized water, dried with compressed air, and then stored in a vacuum chamber until
processing flowchart can be seen Figure 19.
: removal of grafoil,
seconds per step. However, as the samples were smaller than the x-ray spot, their epoxy mounts added their own signature peaks.
3.10.2 - Optimized Samples
One sample from each set of optimized W-25 at% Re was characterized with the AXS D8 Discover XRD tool. These samples had the highest concentration of rhenium and, if present, the highest likelihood of σ-phase presence. The samples were scanned with a 2θ ranging from 20 to 50° with a NaI(Tl) scintillation detector point detector, which utilized a step size of 0.02° with a hold time of 1.5 seconds per step. After
reviewing the W-25 at% Re optimized sample’s scans, the remaining compositions were not scanned.
3.11 - SEM/BSE Measurements
The amount of σ-phase in each sample was quantified using backscatter electron (BSE) images. The contrast in a BSE image directly correlates to the atomic density at any given point. The differences in packing density for the tungsten, rhenium, and σ -phases can be differentiated in this manner. Each sample was imaged 10-15 times at the center of their cross-section with roughly 100 µm between each image using a Rutherford BSE detector attached to a LEO 1430VP scanning electron microscope. The
magnification was 2500x giving each image an area of approximately 41 x 62 µm. This magnification was a balance of having a suitable sampling area versus having the
resolution to differentiate phases present. These images were then analyzed using ImageJ software where the area percentage of σ-phase could be determined through both