© 2002. Biological Procedures Online. Published in Biological Procedures Online under license from the author(s). Copying, printing, redistribution and storage permitted.
Biol. Proced. Online 2002;4(1): 88-93.
A Sensitive Quantification of HHV-6B by Real-time PCR
Bodil Øster
1and Per Höllsberg
1*1Department of Medical Microbiology and Immunology, Bartholin Building, University of Aarhus, DK-8000 Aarhus, Denmark.
*Corresponding author: Per Höllsberg, M.D., Department of Medical Microbiology and Immunology, Bartholin Building, University of Aarhus, DK-8000 Aarhus C, Denmark. Phone: +45 8942 1772. Fax: +45 8619 6128. E-mail: ph@microbiology.au.dk Submitted: September 4, 2002; Revised: November 12, 2002; Accepted: November 12, 2002; Published: December 9, 2002 Indexing terms: HHV-6B; PCR; mRNA.
ABSTRACT
Human herpesvirus (HHV)-6B is a pathogen causing latent infection in virtually all humans. Nevertheless, the interaction of HHV-6B with its host cells is poorly understood. Although HHV-6B is approximately 90% homologous to HHV-6A, it expresses certain B-specific genes. In order to quantify the amount of expressed viral mRNA we have developed a method using real-time PCR on a LightCycler instrument. Here we describe an assay for the detection of the HHV-6B B6 mRNA, but our approach can easily be extended to involve other mRNAs. This method is useful during the study of HHV-6B biology and offers reliable and reproducible, quantitative detection of viral mRNA below the attomol range.
INTRODUCTION
In 1986, a novel virus was isolated from six immunocompromised patients by Salahuddin and co-workers and was denoted Human B-lymphotropic virus (HBLV) due to their capability to infect B cells (1). HBLV was shown to possess a double-stranded DNA genome consisting of more than 110 kbp and was identified as a member of the herpesvirus family (2). Later the virus was shown to have a broader host cell range with T cells as a major target and was renamed human herpesvirus 6 (HHV-6) (3,4). Based on differences in restriction enzyme cleavage patterns and different reactivity with monoclonal antibodies between different isolates, HHV-6 was divided into two subgroups, HHV-6A and HHV-6B. These viruses are two closely related betaherpesviruses with an overall nucleotide identity of 90% (5,6). Whereas more than 90% become seropositive to HHV-6B in early childhood, the epidemiology of HHV-6A is less well characterized. Both HHV-6A and –6B infects T cells and monocytes in vivo (7,8), but the viral gene expression from
infected cells is only partially described. Since HHV-6A and – 6B may give rise to different types of infections and clinical outcomes, it is of interest to develop sensitive methods to distinguish between these viruses.
PCR amplifications of reverse-transcribed RNA is a sensitive method for analyzing viral gene expression. However, conventional PCR is not quantitative, since the number of amplification cycles it takes before the amplified product reaches a plateau is not investigated. This contains the potential pitfall that samples with different amounts of template have reached the same plateau after 30 cycles, i.e., the same amount of amplified product, although the kinetics of the amplifications have been quite different. To avoid these problems, real-time PCR has been developed in order to monitor the amount of amplified product in each cycle.
Recently, the genomes of HHV-6A and HHV-6B have been sequenced (5,6). Further studies have predicted 97 unique genes in HHV-6B, 88 of which have counterparts in HHV-6A (5). However, HHV-6A and HHV-6B each comprise nine genes, which are completely unique for each virus. The nine HHV-6B specific genes, designated B1-B9, provide nine obvious potential markers for HHV-6B infection.
MATERIALS AND METHODS
Virus, cell culture, and T-cell infection
The T-lymphoblastic cell line Molt-3 was infected by HHV-6B, strain PL1 (generated by Dr. P. Lusso). Molt-3 T cells were grown at 37°C and 5% CO2 in Dulbecco’s Modified
Eagle Medium (DMEM) supplemented with glutamine (0.292 g/L), 10 mM HEPES, streptomycin (0.2 g/L), penicillin (0.2 i.e./L), and 10% heat inactivated fetal bovine serum. Virus was collected from the supernatants of HHV-6B-infected T cells. The supernatants were cleared from cell debris by centrifugation at 4500 × g for 1 hour, and subsequently centrifuged at 100,000 × g for 1 hour. Infection was performed with 8×10⁶ Molt-3 cells per ml of 20-fold concentrated virus
supernatant.
RNA purification
Total RNA was isolated from 2×10⁶ T cells at room
temperature using High Pure RNA Isolation Kit (Roche Diagnostics Scandinavia AB, Hvidovre, Denmark). In brief, T cells were lysed in 4.5 M guanidine hydrochloride, 50 mM Tris-HCl and 30% Triton X-100 (w/v), pH 6.6, followed by the collection of nucleotides on a filter by high-speed centrifugation. To remove contaminating DNA, nucleotides were treated with 200 U DNase for 15 min and washed once in a buffer consisting of 5 M guanidine hydrochloride and 20 mM Tris HCl (pH 6.6) in ethanol, and twice in a buffer consisting of 20 mM NaCl and 2 mM Tris-HCl (pH 7.5) in ethanol. Finally, RNA was eluted in sterile, nuclease-free, double-distilled H2O in a total volume of 60 µl. Total RNA
concentration was determined in triplicates by absorbance measurements (GeneQuant II RNA/DNA Calculator, Pharmacia Biotech, Hørsholm, Denmark).
Reverse transcription (RT)-PCR
First-strand cDNA synthesis from 1 µg of total RNA was performed using 100 pmol of p(dT)15 primer for cDNA
synthesis (Roche, Hvidovre, Denmark) followed by a denaturation step at 65°C for 10 min. The RNA was reverse transcribed using the method described by the manufacturer of the Expand Reverse Transcriptase kit for first-strand synthesis (Roche, Hvidovre, Denmark) for 45 min at 42°C.In brief, 1 × Expand Reverse Transcriptase buffer (first strand) was mixed with DTT in a final concentration of 10 mM, dNTP-mix, disodiumsalt solution with dATP, dCTP, dGTP, and dTTP at a final concentration of 1 mM, 20 U RNase inhibitor, and 50 U Expand Reverse Transcriptase enzyme. The reaction was stopped at 95°C for 2 minutes. The cDNA was diluted to 40 µl with double-distilled H2O. To avoid sample-to-sample
contamination, separate laboratories were used for RNA purification, PCR set-up and template addition.
Primers and probes
Primers and probes for PCR amplification were designed by and purchased from TIB-MOLBIOL (Berlin, Germany). The primers for the internal standard β2-microglobulin were as
follows: forward primer: CAA GCA GAG AAT GGA AAG TC; reverse primer: GAT GCT GCT TAC ATG TCT CG. The forward and reverse primers for the HHV-6B specific gene B6 are shown in Fig. 1 together with the specific internal probes B6 FL and B6 LC. The B6 FL probe was labeled at its 3’-end with the donor dye, Fluorescein (FL) and the B6 LC probe was labeled at its 5’-end with the acceptor dye, LightCycler-Red 640 (LC Red 640).
Fig. 1: Location of primers and probes in B6 of HHV-6B. The entire ORF of B6, strain Z29 is shown (GenBank Accession number AF157706). The region spanning the two primers has been sequenced and found 100% identical between strain Z29 and strain PL1 [9]. B6 F, forward primer; B6 LC and B6 FL, internal probe-pair; B6 R, reverse primer.
Optimization of PCR conditions
The concentration of the probe B6 LC was optimized with 0.2 µM, 0.3 µM, and 0.4 µM. The annealing temperature was optimized with 55°, 57°, 60°, and 62°C and the MgCl2
concentrations with 1, 2, 3, 4, and 5 mM.
Real-time quantitative PCR
Real-time PCR was carried out using the LightCycler – FastStart DNA Master Hybridization Probes reagent (Roche, Hvidovre, Denmark). A standard curve was created by amplifications of a synthetic oligonucleotide (DNA Technologies, Aarhus, Denmark) with the same sequence as the product amplified by B6F/B6R. For quantification, the test template used was cDNA derived from reverse transcribed RNA isolated 0h, 1h, 3h, 8h, 22h, and 48h after infection. H2O
presence of potential inhibitory factors in the samples, 5 µl of cDNA from non-infected Molt-3 T cells was added to each standard dilution. Oligonucleotide standard and cDNA were amplified in a mixture of 5 µl cDNA/diluted oligonucleotide standard, 2.5 mM MgCl2, 0.5 µM primer B6 F, 0.5 µM primer
B6 R, 0.2 µM Probe B6 LC, 0.2 µM Probe B6 FL, and 2 µl LightCycler – FastStart DNA Master Hybridization Probes in a final volume of 20 µl. The PCR reaction was performed on a LightCycler instrument with 1 cycle of denaturation for 10 min at 95°C and 45 cycles of amplification at 95° for 10 sec, 60°C for 10 sec and 72°C for 5 sec. Cooling to 40°C took 30 sec.
The log phase is used for quantification
A PCR can be divided into three phases. The first is the background phase, which lasts until the signal of the amplified product exceeds the background signal. The second is the exponential growth phase (the log phase), which finally ends in the plateau phase. The plateau phase is reached if reaction by-products accumulate and inhibit the reaction, if product re-annealing takes over and starts competing with the hybridization of the primers, or if the enzyme is heat-inactivated over time and thereby becomes limiting (10). The amount of product can be determined from the log phase. In the log phase the amount of product increases logarithmically with a maximal efficiency of 2 and a minimum efficiency of 1. The number of cycles required to produce a signal above background fluorescence can be converted to the starting concentration of the unknowns from the standard curve. The crossing point value (Cp) is the point where the log line intersects a horizontal threshold line (discarding background fluorescence). The amount of target is the same in all samples at this point of intersection (10). The amplification course of the log phase is described by the following equation:
Tn=T0 (E)n (1)
Where Tn is the amount of target at n cycles, T0 the initial
amount of target, and E the efficiency of amplification (10). If the copy number of target at the crossing point is K, and the cycle number to obtain K is Cp, then by equation 1:
K=T0 (E)Cp (2) Ù logK=log T0 + Cp logE (3)
Cp is the value measured and T0 the initial concentration of the
standard determined by the investigator. Rearranging to the form y=ax+b gives:
Cp=-(1/logE) log T0 + (logK/logE) (4)
The standard curve is described by this equation with the log of the initial template copy number plotted horizontally and the cycle number at the crossing point vertically. By equation 4:
Slope=-1/logE (5) Ù logE = -1/Slope (6) Ù E=10-1/Slope (7)
Where E is the efficiency and “Slope” is the slope of the standard curve. To obtain reliable results it is important to achieve equivalent PCR efficiencies for the standard curve and the samples. The sample efficiency was determined in a series of template dilutions.
RESULTS AND DISCUSSION
The
β2
-microglobulin values were highly
reproducible
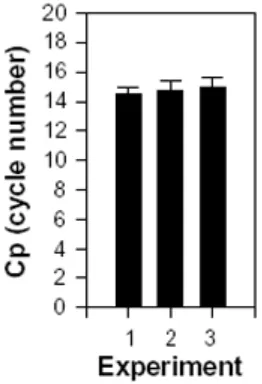
The reproducibility of the method used for the initial detection of the HHV-6B-specific transcript B6 was determined in three independent but identical experiments using internal control-primers for β2-microglobulin. In each experiment, the relative
amount of β2-microglobulin was determined with 13 separate
measurements on each cDNA from infected T cells (Fig. 2).
Fig. 2: Reproducibility of internal control. As an internal control, β2
-microglobulin was amplified in three independent but identical experiments with 13 separate measurements on each cDNA. The number of cycles (Cp) demanded to amplify the initial amount of target above background is used as a measure for the relative amount of target. The standard deviation is indicated on each bar.
The determination by real-time PCR with β2-microglobulin as
an internal control was highly reproducible. In addition, when comparing the amount of β2-microglobulin in uninfected cells
with the amount found in infected cells, no difference was observed (data not shown).
In conclusion, β2-microglobulin turned out to be useful as an
Optimal PCR conditions
Matrix experiments to systematically define the optimal conditions for two primers and two probes with respect to concentrations, temperatures and MgCl2 will define the best
conditions for the reactions. However, such experiments are large and fairly expensive. We have had success with an approach where our primers are designed with an expected annealing temperature around 60°C. Of notice, the concentration of MgCl2 in real-time PCR using the LightCycler
technology is higher than that used in conventional PCR. The probes designed by TIB MOLBIOL (Berlin, Germany) are carefully selected to have similar characteristics. For practical purposes we chose to optimize on only one of the probes. For the quantification of B6, we found the optimal conditions to be 0.2 µM probe B6 LC, the annealing temperature 60°C and 4.5 mM MgCl2.
Similar PCR efficiencies were obtained
The efficiency is obtained by plotting the crossing point (Cp) values against the log of the initial template concentration (Fig. 3). Sample and standard efficiencies are equal if they have the same slope. In addition, they should be constant over the concentration range studied, that is, linearity should be obtained on semi-log plots.
Fig. 3: PCR amplification efficiency. The crossing point (Cp) values plotted against the log of the initial template concentrations. From the formula E = 10 -1/Slope the efficiency is calculated to 2.0, in that the slope of the line is -3.304.
As shown in Fig. 3, the efficiency of the standard amplification was found to be constant over the concentration range studied. That is, linear plots were obtained with an efficiency of 2.0, indicating an exponential increase of the product. Likewise, a linear plot with a comparable efficiency was obtained in a number of sample dilutions (data not shown).
Viral mRNA can be detected in attomol amounts
In initial experiments, the relative amount of the HHV-6B-specific transcript B6 was determined at 0h, 1h, 3h, 8h, 22h, and 48h after infection (Fig. 4). Surprisingly transcripts could
be detected as early as 1h after infection. Based on further experiments (9) B6 was characterized as belonging to the group of genes expressed immediately after infection. As can be seen from Fig. 4, the increase in mRNA amount is pronounced early after infection.
Fig. 4: Detection of B6 mRNA. The relative amount of B6 mRNA was determined at the indicated time points after infection. The amount of β2
-microglobulin was constant in all test materials whereas the amount of B6 mRNA increased over time.
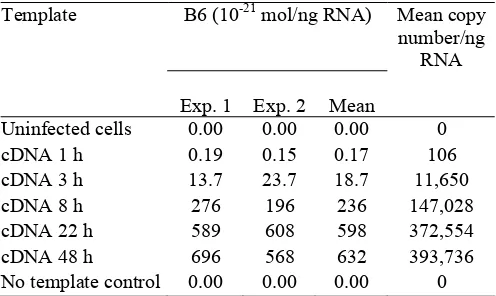
To make a relative quantification of the transcripts, specific probes were designed for B6 (Fig. 1) in addition to a synthetic oligonucleotide encompassing the B6 primers annealing sites. The quantification was performed in two separate experiments with separately prepared standard curves but with the same batch of samples. Concentrations were reproducibly determined below the attomol range in duplicate experiments (Table 1).
Table 1: Quantification of the amount of B6 mRNA present per ng total RNA at different time points following HHV-6B (PL1) infection of Molt-3 cells.
B6 (10-21 mol/ng RNA)
Template
Exp. 1 Exp. 2 Mean
Mean copy number/ng
RNA
Uninfected cells 0.00 0.00 0.00 0
cDNA 1 h 0.19 0.15 0.17 106
cDNA 3 h 13.7 23.7 18.7 11,650
cDNA 8 h 276 196 236 147,028
cDNA 22 h 589 608 598 372,554
cDNA 48 h 696 568 632 393,736
No template control 0.00 0.00 0.00 0
as a novel sensitive measurement of virus titers in supernatants, an approach that would be faster and more specific than the conventional read-out of cytopathic effects in cell culture systems.
ACKNOWLEDGMENTS
We thank P. Lusso for the PL-1 strain of HHV-6B and Z. Berneman and his laboratory for cell lines and advice. This work was supported by grant 9903024 from the Danish Medical Research Council and the Novo Nordic Research Foundation.
REFERENCES
1. Salahuddin SZ, Ablashi DV, Markham PD, Josephs SF, Sturzenegger S, Kaplan M et al. Isolation of a new virus, HBLV, in patients with lymphoproliferative disorders.
Science 1986; 234(4776):596-601.
2. Josephs SF, Salahuddin SZ, Ablashi DV, Schachter F, Wong-Staal F, Gallo RC. Genomic analysis of the human B-lymphotropic virus (HBLV). Science 1986; 234(4776):601-603.
3. Ablashi DV, Salahuddin SZ, Josephs SF, Imam F, Lusso P, Gallo RC et al. HBLV (or HHV-6) in human cell lines.
Nature 1987; 329(6136):207.
4. Lusso P, Salahuddin SZ, Ablashi DV, Gallo RC, di M, V, Markham PD. Diverse tropism of HBLV (human herpesvirus 6). Lancet 1987; 2(8561):743.
5. Dominguez G, Dambaugh TR, Stamey FR, Dewhurst S, Inoue N, Pellett PE. Human herpesvirus 6B genome sequence: coding content and comparison with human herpesvirus 6A. J Virol 1999; 73(10):8040-8052.
6. Isegawa Y, Mukai T, Nakano K, Kagawa M, Chen J, Mori Y et al. Comparison of the complete DNA sequences of human herpesvirus 6 variants A and B. J Virol 1999; 73(10):8053-8063.
7. Lusso P, Malnati MS, Garzino-Demo A, Crowley RW, Long EO, Gallo RC. Infection of natural killer cells by human herpesvirus 6. Nature 1993; 362(6419):458-462. 8. Yamanishi K. Human Herpesvirus 6 and Human
Herpesvirus 7. In: David M.Knipe, Peter M.Howley, Diane E.Griffin, Robert A.Lamb, Malcolm A.Martin, Bernard Roizman et al., eds. Fields Virology. Philadelphia: Lippincott Williams & Wilkins. 2001: 2785-2801.
9. Øster B, Höllsberg P. Viral gene expression patterns in human herpesvirus 6B-infected T cells. J Virol 2002; 76(15):7578-7586.
PROTOCOLS
Cell culture, virus, and T-cell infection
1. Grow Molt-3 T cells in Dulbecco’s Modified Eagle Medium (DMEM) supplemented with 10% heat inactivated fetal bovine serum, glutamine (0.292 g/L), 10 mM HEPES, streptomycin (0.2 g/L), and penicillin (0.2 i.e./L) at 0.6×10⁶ Molt-3
T cells/ml.
2. Resuspend 8×10⁶ Molt-3 T cells per ml virus (HHV-6B) supernatant.
3. Dilute the infected cells to 4×10⁶ cells/ml with supplemented DMEM.
4. Expand with fresh supplemented DMEM when needed (if the medium changes color from red to orange/dark yellow). 5. Isolate RNA at the preferred time points after infection from 2×10⁶ infected Molt-3 T cells using High Pure RNA
Isolation Kit (Roche Diagnostics Scandinavia AB, Hvidovre Denmark) as described by the manufacturer. 6. Determine the concentration of total RNA by absorbance measurements.
cDNA synthesis
1. Mix 1 µg of total RNA with 100 pmol of p(dT)15 primer for cDNA synthesis (Roche, Hvidovre, Denmark).
2. Denature the RNA at 65°C for 10 min. Put on ice immediately after.
3. Prepare a mixture of 1 × Expand Reverse Transcriptase buffer (first strand), DTT in a final concentration of 10 mM, dNTP-mix, disodiumsalt solution with dATP, dCTP, dGTP, and dTTP at a final concentration of 1 mM, 20 U RNase inhibitor, and 50 U Expand Reverse Transcriptase enzyme.
4. Add the nucleotide/buffer/enzyme mixture to each tube containing denatured total RNA and p(dT)15 primer in a final
volume of 20 µl.
5. Incubate the tubes at 42°C for 45 min. 6. Stop the reaction at 95°C for 2 minutes. 7. Put on ice and freeze at –70°C.
Quantitative real-time PCR
1. Optimize MgCl2 concentration, annealing temperature, and amount of target.
2. Dilute the standard (synthetic oligonucleotide or cloned fragment) in water in ten-fold dilutions in a range spanning the sample concentrations immediately before use. Keep the dilutions on ice.
3. Prepare a reaction mixture for all samples containing all ingredients (except from the template) with 2.5 mM MgCl2, 0.5
µM forward primer, 0.5 µM reverse primer, 0.2 µM Probe LC Red, 0.2 µM Probe FL, and 2 µl LightCycler – FastStart DNA Master Hybridization Probes.
4. Mix 5 µl of each cDNA/diluted oligonucleotide with 15 µl reaction mixture immediately before analysis.