It is likely that the obesity epidemic is a ‘systems effect’. That is, there are good reasons to believe that it has emerged from interactions between the variables that char-acterise human physiology and psychology, and those that characterise urban environments.1,2 Interactions of this kind are dominant in such human–urban systems and can give rise to unexpected and unwanted policy outcomes.3In these circumstances it is not useful to look for the main cause of a management problem. Instead it is necessary to develop hypotheses about significant causal links between key system variables. In particular, it is necessary to move beyond thinking in terms of ‘causal chains’ to develop an ability to see ‘causal loops’.
Causal loops are prevalent in complex systems and give rise to ‘feedback’ behaviour, where the effects of a change act to amplify or oppose the original change. Feedback can generate stubborn management problems. To attack such problems, managers and policy makers must have ways to (a) investigate the causal structure of complex systems, (b) identify possible feedback mechanisms and the behav-iours they drive, and (c) identify ‘leverage points’ where
Abstract: Obesity has reached epidemic propor-tions in many countries and persists despite con-tinuing efforts to find solutions. Such ‘stubborn problems’ often signal the influence of ‘feedback systems’. In the case of the obesity epidemic, this possibility can be investigated using available system analysis tools. The investigation must begin with a study of the interplay between the full range of human and environmental factors. This paper outlines the nature of feedback and briefly dis-cusses some of its management implications. A practical way to initiate a ‘systems approach’ to the obesity problem is suggested and four princi-ples to guide the management of complex human– environment systems are presented.
Barry Newell
A,C, Katrina Proust
A,
Robert Dyball
Aand Phil McManus
BAFenner School of Environment and Society, The Australian National University
BSchool of Geosciences, University of Sydney
CCorresponding author. Email: [email protected]
pressure on selected system variables (or the severing of selected causal links) will produce the desired outcomes. These are the elements of a ‘systems approach’.
Feedback and its effects
The ‘behaviour’ of a human–urban system, the way that its variables change over time, emerges from interactions between these variables.4–6When a change in the value of a system variable is amplifiedby the system, the effect is called ‘positive feedback’. The term ‘positive’ indicates only that changes are reinforced – it does not mean that the effects are necessarily good. Positive feedback effects are sometimes called runaway effects, bandwagon effects or vicious circles. They can lead to exponential growth or collapse.
When a change is opposed by the system the effect is called ‘negative feedback’. Negative feedback effects work to hold system variables at established levels, thus stabilising the system. Note that the term ‘negative’ indi-cates only that changes are resisted – it does not mean that the effects are necessarily bad. The various homeostasis mechanisms that maintain stable conditions inside the human body are all examples of ‘good’ negative feedback.
These effects can be illustrated using ‘causal loop dia-grams’ (the commentary associated with each of the fol-lowing three figures explains how to approach a causal diagram). Figure 1 provides an example of a systems effect that is commonly called ‘policy resistance’ – a major cause of stubborn problems. The diagram can be read as follows: a desire for a high level of outdoor activity leads to an increase in the amount of open space preserved in the neighbourhood. Open space increases the popularity of the area. Increased popularity leads to a demand for addi-tional housing. Finally, the demand for new housing leads to development pressures that can result in a reductionin the availability of open space. In this case, a possible lever-age point involves breaking one of the links in the feed-back loop – for example, the policy resistance can be removed if the pressure to develop open space is resisted.
Seeing obesity as a systems problem
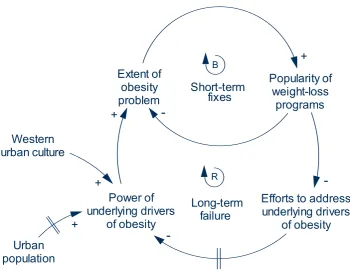
underlying drivers of obesity. This reduced focus allows urban population and lifestyle factors to increase the power of the drivers, which further increase the number of obese people. Over time the positive feedback loop shifts the balance point maintained by the negative feedback loop. Thus, the overall extent of the obesity problem increases slowly in response to the steady growth of urban populations and the excesses of Western urban cultures.
Complex systems have a large number of ‘parts’ that inter-act, via a network of feedback loops, to influence and con-strain one another’s behaviour. A human–urban system comprises the city’s inhabitants plus the ecological, cul-tural, social and economic entities that make up their environment. Figure 3 shows a portion of the complex human–urban structure that might be expected to drive the obesity epidemic. Even though the diagram illustrates only a part of the possible structure, it is complex enough to show why a systems approach must be adopted when looking for leverage points that can help the community to tackle the epidemic. Note that, if commuting time increases, then the reinforcing loops R1 and R2 have the potential to amplify unhealthy behaviours (decreased time spent cooking and exercising). Such ‘lock-in effects’ are another major source of stubborn problems.
Taking a systems approach
There are well-developed system analysis tools that can be used to investigate the causal structure of human–environment systems. These range from influence
diagrams to sophisticated modelling techniques that allow the construction of working simulations.4,8–10It is possible, however, for an interdisciplinary group to make significant progress working with no more than influence diagrams. Influence diagrams can be thought of as causal loop dia-grams (as presented here) without polarities assigned to the arrows. They are easier to produce than causal loop dia-grams and so support an unconstrained approach that helps participants to capture their current understanding and intuitions. This freedom also helps to weaken the influence of conceptual barriers between disciplines.11
As a first step toward the construction of an influence diagram it is valuable to generate lists of the variables that might be relevant to the target problem. The initial ver-sions of such lists should be compiled in ‘brain-storming’ sessions involving people from a wide range of disciplines and sectors. See Table 1 for a starting list of variables that are likely to be relevant to the obesity problem. The vari-ables listed include (a) cultural and social factors, (b) the beliefs that constitute community and individual world-views (mental models), and (c) individual actions that might affect system behaviour.
The lists should be merged and the variables sorted into groups according to their status as (a) system variables, (b) external drivers of the system, and (c) irrelevant to the problem.4Diagrams can then be constructed showing the influence links that are likely to exist between the
Extent of open
space in
community
Pressure to
develop open
space
Popularity of
neighbourhood
+
Demand for
new housing
+
-+
BDesire for
outdoor activities
+
Competition
for space
Figure 1. A causal loop diagram illustrating policy resistance.
Figure 3).
Influence diagrams can provide the starting point for more extensive studies of the dynamics of human–urban systems. Our experience has shown, however, that the process of con-structing and discussing influence diagrams can itself help a group to develop a greatly enhanced understanding of the behaviour of their system of interest. Such an endeavour, carried out collaboratively by public-health researchers, policy makers, and providers could provide valuable new insights into the drivers of the obesity epidemic.
Principles for managing complex human–environment systems
Recent work by Newell and Proust has led to a focus on four principles that can help guide attempts to manage in complex human–environment systems.9,10 These princi-ples, expressed in a form appropriate to the obesity problem, can be used to summarise the above discussion:
Principle 1: Feedback effects are important drivers of behaviour in human–urban systems.
Principle 2: Any action taken in a human–urban system will have multiple outcomes, some wanted and some unwanted. The unwanted outcomes will usually be delayed and therefore may go unrecognised.
parts taken in isolation from one another.
Principle 4: The design of effective policies for the man-agement of human–urban systems requires an integrative approach that crosses existing professional and institu-tional boundaries.
Principles 1 and 2 capture generic aspects of system behaviour as observed in a wide range of situations. The phenomenon of policy resistance, as discussed above, is typical. Principles 3 and 4 capture two characteristics of systems that must be taken in to account in any manage-ment intervention. They are intended to counter the natural tendency of managers and policy-makers to focus on sub-problems and to institute policies intended to solve each sub-problem separately.
Conclusion
Feedback system concepts are a natural and necessary component of an integrative approach to the obesity epi-demic. Public health policies that are informed by these concepts, and the above system principles, have a good chance of proving effective in the face of this highly stub-born problem.
Extent of
obesity
problem
Popularity of
weight-loss
programs
Power of
underlying drivers
of obesity
+
-+
B
R
Efforts to address
underlying drivers
of obesity
-Short-term
fixes
Long-term
failure
Urban
population
+
Western
urban culture
+
Figure 2. A causal loop diagram illustrating fixes that fail.
Seeing obesity as a systems problem
Commuting distance
Time spent commuting
Levels of stress
Extent of obesity problem
+
Desire for wholesome food cooked at home
Time spent cooking at
home
+ Benefits of home-cooked
food
Time spent exercising
Desire for exercise Number of
motor vehicles per family
-Extent of urban sprawl
+
+
+
Level of individual
fitness
-City noise levels
+ +
+
Number of families with
dogs
+
R1
B1 Time spent
in reflection Desire for
relaxation
+
+
+
R2
Community affluence
+
Ability to handle stress
-Hours at work
+
+
-+
+ +
Figure 3. Causal structure proposed for a part of the human–urban system that produces obesity.
This diagram summarises possible systemic effects. To keep the diagram simple a number of influence links have been omitted. For example, the three driving variables shown at the top of the diagram (extent of urban sprawl, community affluence, number of families with dogs) are themselves parts of more extensive feedback loops. There are three feedback loops related to eating (R1), relaxation (B1) and exercise regimes (R2). The variable ‘number of families with dogs’ is included to stress the need for initial system analyses to include as wide a range of variables as possible.
Table 1. Variables that can affect an individual’s body weight
A. Variables conducive to healthy body weight
Cultural and social Worldviews Individual actions
Availability of information about Belief in the importance of a healthy lifestyle Building in time to achieve a balanced
healthy living lifestyle
Access to healthy food Understanding of healthy eating regimes Consuming healthy foods Opportunities for physical activity Understanding of the benefits of time Participation in physical activities
spent exercising
Neighbourhood design to support Belief that outdoor activities are essential Walking and cycling rather than driving walking and cycling
Local employment opportunities Belief in the value of local employment Acceptance of lower-paid work with reduced travel overheads
B. Variables detrimental to healthy body weight
Cultural and social Worldviews Individual actions
Time pressure; availability of Belief in competing demands on time; Buying and using labour-saving devices labour-saving devices inclination to save time
Population growth; urban sprawl Belief that growth is essential and has Dependence on motor vehicles;
work-no limits places beyond the local community
Consumerism Belief in market-based commodities and Succumbing to unhealthy, unnecessary services, seen as preferable to purchases
self-sufficiency
Inducements to unhealthy Belief in eating as reward and pastime; Acceptance of diets high in fat, sugar, salt eating traditions acceptance of fast-food culture and alcohol; consumption of excessive
portions
Characteristics of The Entertained Desire to be entertained; lack of belief in Excessive TV watching; lack of
comments.
References
1. Kearns A, Beaty M, Barnett G. A social-ecological perspective on health in urban environments.N S W Public Health Bull
2007; 18(3-4): 48–50.
2. National Obesity Taskforce. Healthy Weight 2008 – Australia’s future. Canberra: National Obesity Taskforce, 2003.
3. Tenner E. Why things bite back. London: Fourth Estate, 1997. 4. Sterman JD. Business dynamics: systems thinking and
modeling for a complex world. Boston: Irwin McGraw-Hill, 2000.
5. Richardson GP. Feedback thought in social science and systems theory. Philadelphia: University of Pennsylvania Press, 1991.
6. Jervis R. System effects: complexity in political and social life. Princeton: Princeton University Press, 1997.
7. Senge PM. The fifth discipline: the art and practice of the learning organization. Sydney: Random House, 1992.
Harbour Advisory Committee. Darwin: Darwin Harbour Advisory Committee, 2004. At
http://www.nt.gov.au/nreta/water/dhac/publications/pdf/finalre port20050307.pdf, accessed 19 October 2007.
9. Proust K, Newell B. Catchment and community: Towards a management-focused dynamical study of the ACT water system. Canberra: ACTEW Corporation, 2006. At
http://www.water.anu.edu.au/pdf/publications/Catchment%20a nd%20Community.pdf, accessed 19 October 2007.
10. Proust K, Dovers S, Foran B, Newell B, Steffen W, Troy P.
Climate, energy and water: accounting for the links. Canberra: Land & Water Australia, 2007. At
http://www.lwa.gov.au/downloads/publications_pdf/ER071256. pdf, accessed 19 October 2007.