NSW PUBLIC HEALTH
BULLETIN
Year in review: communicable disease
surveillance, NSW, 2007
In this issue, we present our annual review of notifiable
dis-eases among New South Wales (NSW) residents. Readers
interested in the details of notifications for specific diseases
are referred to in Tables 2–6 where diseases are reported by:
year of onset; month of onset; Area Health Service (AHS);
and age group and sex.
Trends
Among the 46 706 notifications of medical conditions by
doctors, hospital staff and laboratory staff in NSW residents
in 2007, highlights included:
Conditions most frequently reported
• Chlamydia trachomatis infections: 12 447 cases (181
per 100 000 population) with the highest crude rates by
geographical area in the South Eastern Sydney
Illawarra (Randwick region), Sydney South West
(Camperdown region), Hunter New England (Tamworth
region) and Greater West (Broken Hill region) AHSs.
• Hepatitis C: 4259 cases (62 per 100 000 population)
with the highest crude rates in the Greater Western
(Broken Hill region), North Coast (Lismore region) and
Sydney South West (Camperdown region) AHSs.
• Hepatitis B: 2656 cases (39 per 100 000 population)
with the highest crude rates in the Sydney South West
(Camperdown and Liverpool regions) and Sydney West
(Parramatta region) AHSs.
• Salmonella infections: 2564 cases (37 per 100 000
population) with the highest crude rates in the North
Coast (Lismore region), Northern Sydney Central Coast
(Gosford region) and Sydney South West (Camperdown
region) AHSs.
• Pertussis: 2093 cases (30 per 100 000 population) with
the highest crude rates in Greater Western (Dubbo
region), Sydney West (Parramatta region) and South
Eastern Sydney Illawarra (Randwick region) AHSs.
Conditions with the most meaningful declines in the
number of notifications compared with previous years
• Measles: four cases in 2007, the lowest annual count to
date and a striking decrease compared with 2348 cases
notified in 1993. No local measles transmission
occurred in 2007 with all four cases resulting from
exposure overseas.
• Meningococcal serogroup C disease: 10 cases reported
for 2007, the lowest number of notifications since
laboratory reporting began in 1991, largely due to the
introduction of meningococcal C vaccination in late
2003.
• Gonorrhoea: 1384 cases in 2007 compared with 1736
cases in 2006, a decrease of 20%.
• Hepatitis A: a record low number of 65 cases,
decreased from 1119 in 1991, perhaps in part due to the
introduction of a commercially based vaccination in the
1990s. Travel to endemic countries was the most
commonly reported risk factor for disease acquisition
in 2007.
• Psittacosis: 34 cases, a 64% decrease compared with
2006.
• Leptospirosis: eight cases, down from 66 in 2001.
Conditions with the most meaningful increases in the
number of notifications compared with previous years
• Salmonella infections: 2564 cases, the highest annual
count to date.
1This increase is mainly due to a large
point-source outbreak affecting 319 people who ate
Vietnamese-style pork or chicken rolls from a bakery.
• Infectious syphilis, primarily affecting homosexual men
residing in metropolitan Sydney.
• Mumps: 323 cases, a steady increase from 28 cases in
2001. This increase occurred mainly in the second half
of the year in young adults in South East Sydney
Illawarra (Randwick region) AHS.
w w w. p u b l i s h . c s i r o. a u / j o u r n a l s / p h b
CONTENTS – See back page
Year in Review 2007
ISSN 1034 7674
• Legionnaire disease: 73 reported Legionella
pneumophila infections in part due to an outbreak in
Sydney central business district in January.
• Influenza with high rates of disease reported in July
and August. There were 25 reported influenza
(influenza A) outbreaks in 2007: 21 in aged-care
facilities, three in military facilities and one in a
boarding school.
• Verotoxigenic Escherichia coli (VTEC) infections:
23 cases reported, compared with 10 cases reported in
2006. All cases were investigated and no
epidemiological links were identified.
• Giardiasis: 1940 cases reported compared with 1725
reported in 2006.
Conditions least frequently reported
There were no reported cases of anthrax, avian influenza,
botulism, chancroid, diphtheria, granuloma inguinale,
lyssavirus, plague, polio, rabies, severe acute respiratory
syndrome (SARS), smallpox, tularaemia, typhus, viral
haemorrhagic fever or yellow fever in NSW in 2007.
Top five notifiable diseases
Rates for the most commonly reported notifiable diseases
for each age group and geographical area of residence at
the time of notification are presented in Fig. 1 and Table 1.
These lists indicate the relative importance of notifiable
diseases only and should not be used to indicate the spread
of all infectious diseases in NSW. It should also be noted
that these rates are heavily influenced by testing practices
and, in many instances, do not necessarily indicate the true
or relative incidence in the community. Finally, these lists
do not include the institutional gastrointestinal outbreaks
as comprehensive demographic data are not collected for
such outbreaks.
Geographical distribution of notifiable diseases
• Chlamydia trachomatis infection was the most
commonly reported infection across NSW with
highest rates observed in regional areas followed by
rural and metropolitan areas.
• Rates of hepatitis C infection were comparable across
rural, regional and metropolitan areas. Most of these
cases will represent chronic infection rather than acute
hepatitis C acquisition and as such may not accurately
reflect the recent spread of the hepatitis C epidemic.
• Arboviral infections are more commonly reported in
people residing in rural and regional areas than in
metropolitan areas, relating to the distribution of
infected mosquitoes.
• Higher rates of disease are reported for Justice Health
compared with the rest of NSW, likely related to
higher testing rates for bloodborne viruses and
sexually transmitted infections on entry into
correctional facilities. Within this population,
hepatitis C was the most commonly reported infection,
attributable to high rates of injecting drug use.
Age distribution of notifiable diseases
• Gastrointestinal and respiratory diseases are most
commonly reported in children aged under 5 years.
This is influenced by the higher testing rates in this
age group.
Table 1. The five most commonly reported notifiable
diseases by age group, NSW, 2007
Age group
Rate/100 000
Children under 5 years
1.
Salmonella
infection
146
2. Giardiasis
129
3. Influenza
97
4. Cryptosporidiosis
44
5. Pertussis
41
Children (5 to 15 years)
1.
Salmonella
infection
37
2. Giardiasis
27
3. Chlamydia*
#24
4. Pertussis
21
5. Influenza
19
Young adults (16 to 24 years)
1. Chlamydia*
818
2. Hepatitis C
53
3. Hepatitis B
48
4. Gonorrhoea
40
5. Salmonella infection
40
Adults (25 to 44 years)
1. Chlamydia*
241
2. Hepatitis C
124
3. Hepatitis B
74
4. Gonorrhoea
41
5. Giardiasis
32
Adults (45 to 64 years)
1. Hepatitis C
70
2. Pertussis
39
3. Hepatitis B
37
4. Arboviral infection
34
5. Chlamydia*
30
Older Adults (65 years)
1. Influenza
36
2. Pertussis
33
3.
Salmonella
infection
24
4. Arboviral infection
21
5. Invasive pneumococcal disease
19
* refers to
Chlamydia trachomatis
infection.
# two-thirds of the notifications reported in this age group were in
15 year olds. Where a case is reported in a child under16 years
old, the relevant public health unit contacts the treating doctor
outlining his/her obligation to notify the Department of
Community Services.
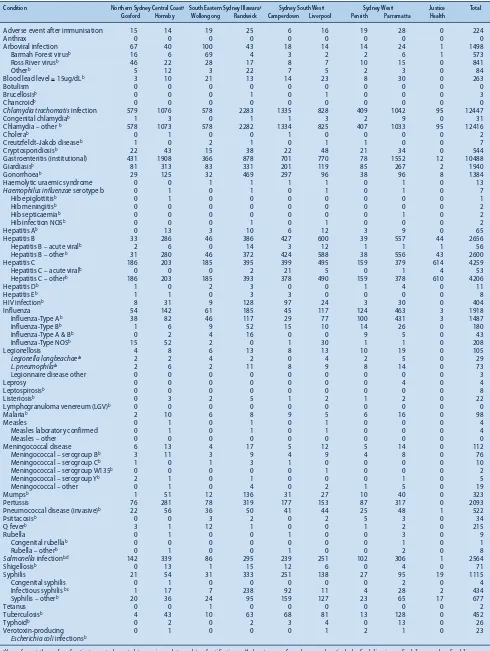
Table 2. Disease notifications by year of onset of illness
a, NSW, 1991–2007
Condition 1991 1992 1993 1994 1995 1996 1997 1998 1999 2000 2001 2002 2003 2004 2005 2006 2007
Adverse event after immunisation 9 31 23 40 28 56 70 95 16 42 111 178 219 186 107 70 224
Anthrax 0 0 0 0 0 0 0 0 0 0 0 0 0 0 0 1 0
Arboviral infection 408 343 656 381 539 1227 1806 783 1220 980 1191 665 1024 1148 1088 1917 1498 Barmah Forest virusb 6 6 25 39 271 172 185 134 249 197 401 396 451 403 448 644 573 Ross River virusb 297 324 599 331 236 1031 1598 583 952 750 717 183 494 701 584 1221 841
Otherb 105 13 32 11 32 24 23 66 19 33 73 86 79 44 56 52 84
Blood lead level ≥ 15ug/dLb Not notifiable until December 1996 710 874 691 985 513 516 338 304 234 298 263
Botulism 0 0 0 0 0 0 0 0 1 0 0 0 0 1 0 0 0
Brucellosisb 2 2 4 4 2 1 3 3 2 1 1 2 3 7 3 10 3
Chancroidb Not notifiable until December 1998 1 0 0 0 0 0 0 0 0
Chlamydia trachomatisinfection 2469 3509 4500 5823 7788 10030 11285 12057 12447 Congenital chlamydiab Not notifiable until August 1998 14 18 16 15 23 28 46 39 31 Chlamydia – otherb Not notifiable until August 1998 2455 3491 4484 5808 7765 10002 11239 12018 12416
Cholerab 1 0 1 0 1 3 1 1 2 0 1 1 0 1 0 3 2
Creutzfeldt–Jakob diseaseb Not notifiable until April 2004 6 8 10 7
Cryptosporidiosisb Not notifiable until December 1996 157 1130 121 134 195 306 203 357 849 778 544 Foodborne illness (NOS)e 2765 253 106 213 270 211 255 201 151 147 56 41 1071 550 309 507 763 Gastroenteritis (institutional) 158 406 443 296 1359 554 939 738 673 697 775 1752 3583 12784 1395 10641 10488 Giardiasisb Not notifiable until August 1998 1091 978 967 863 1028 1234 1448 1725 1940 Gonorrhoeab 392 491 382 357 428 522 636 1054 1291 1060 1364 1527 1328 1442 1579 1736 1384 Haemolytic uraemic syndrome Not notifiable until December 1996 3 6 11 9 2 7 5 9 11 11 13 Haemophilus influenzaeserotype b 212 217 124 61 29 13 17 11 13 8 7 10 6 5 7 11 7
Hib epiglottitisb 15 57 32 21 6 2 5 1 2 2 1 1 0 3 0 1 1
Hib meningitisb 48 103 53 17 11 4 3 3 3 1 1 1 0 0 2 0 2
Hib septicaemiab 11 26 24 12 8 3 1 4 6 4 2 3 1 2 4 6 2
Hib infection NOSb 138 31 15 11 4 4 8 3 2 1 3 5 5 0 1 4 2
Hepatitis Ab 1119 901 579 585 614 958 1426 927 421 201 197 149 124 137 83 95 65 Hepatitis B 1492 3169 3603 3983 4007 3504 3167 2957 3508 3972 4556 3546 2845 2812 2742 2518 2656 Hepatitis B – acute viralb 409 112 95 74 61 43 53 58 77 100 94 88 74 53 56 53 56 Hepatitis B – otherb 1083 3057 3508 3909 3946 3461 3114 2899 3431 3872 4462 3458 2771 2759 2686 2465 2600 Hepatitis C 851 3895 5896 7820 6878 7000 6926 7206 8598 8297 8654 6694 5249 4915 4364 4392 4259 Hepatitis C – acute viralb 22 26 22 16 32 18 19 112 112 222 295 152 127 59 43 55 53 Hepatitis C – otherb 829 3869 5874 7804 6846 6982 6907 7094 8486 8075 8359 6542 5122 4856 4321 4337 4206
Hepatitis Db 0 8 12 19 19 9 11 3 14 12 11 9 12 14 15 15 11
Hepatitis Eb 0 0 1 2 0 3 6 4 7 9 6 6 6 8 7 10 8
HIV infectionb 823 693 589 502 536 447 423 402 377 352 340 393 413 407 391 369 404
Influenza Not notifiable until December 2000 244 1012 861 1011 1414 617 1918
Influenza – Type Ab Not notifiable until December 2000 216 770 767 797 1055 421 1487 Influenza – Type Bb Not notifiable until December 2000 27 241 55 161 280 150 180
Influenza – Type A & Bb Not notifiable until December 2003 26 65 37 43
Influenza – Type NOSb Not notifiable until December 2000 1 1 39 27 14 9 208
Legionellosis 37 104 66 60 75 74 33 46 41 41 68 44 60 80 89 78 105
Legionella longbeachaeb 0 14 13 8 16 30 9 19 12 12 29 21 37 27 24 22 29
L. pneumophilab 16 80 34 30 35 34 18 22 22 26 38 22 23 51 64 55 73
Legionnaire disease other 21 10 19 22 24 10 6 5 7 3 1 1 0 2 1 1 3
Leprosy 1 7 5 3 3 2 0 0 1 2 4 0 2 5 1 1 4
Leptospirosisb 28 21 16 14 6 33 33 50 56 54 66 39 39 40 35 18 8
Listeriosisb 11 13 12 10 14 22 23 28 22 18 12 11 28 30 25 26 22
Lymphogranuloma venereum (LGV)b 0 0 0 0 0 0 0 0 0 0 0 0 0 1 2 1 0
Malariab 171 110 174 184 96 204 173 158 174 232 157 105 120 101 206 140 98
Measles 495 805 2348 1484 596 191 273 119 32 36 31 8 18 12 5 60 4
Measles laboratory confirmed 19 76 460 302 138 35 98 19 13 22 18 6 14 11 4 48 4
Measles – other 476 729 1888 1182 458 156 175 100 19 14 13 2 4 1 1 12 0
Meningococcal disease 128 121 153 142 113 161 218 186 221 253 234 216 202 149 140 107 112 Meningococcal – serogroup Bb 0 3 7 7 23 36 53 55 95 93 90 105 100 81 73 54 76
Meningococcal – serogroup Cb 0 4 6 9 8 35 55 55 60 64 38 54 45 24 16 13 10
Meningococcal – serogroup W135b 0 0 0 0 1 0 2 4 4 4 2 2 2 5 8 5 2
Meningococcal – serogroup Yb 0 0 1 1 0 1 0 7 1 7 2 2 5 3 3 1 5
Meningococcal – other 128 114 139 125 81 89 108 65 61 85 102 53 50 36 40 34 19
Mumpsb 8 23 13 11 14 27 29 39 33 92 28 29 35 65 111 155 323
Paratyphoidb,d 20 8 9 11 12 15 5 9 5 14 11 13 22 10 0 0 0
Pertussis 49 217 1533 1405 1369 1156 4246 2309 1415 3691 4437 2012 2772 3569 5809 4918 2093 Pneumococcal disease (invasive)b Not notifiable until December 2000 444 862 802 906 641 565 522
Psittacosisb Not notifiable until December 2000 38 155 87 81 121 94 34
Q feverb 167 213 403 267 201 287 258 236 164 132 144 310 288 223 143 175 215
Rubella 60 324 1186 233 2376 636 153 78 46 191 58 35 24 18 10 37 9
Congenital rubellab 1 0 2 4 1 5 0 0 1 0 0 0 1 1 0 0 1
Rubella – otherb 59 324 1184 229 2375 631 153 78 45 191 58 35 23 17 10 37 8 Salmonellainfectionb,d 1115 819 1001 1125 1393 1250 1721 1826 1470 1426 1671 2112 1842 2145 2184 2071 2564
Shigellosisb Not notifiable until December 2000 134 85 59 96 135 75 71
Syphilis 580 873 730 963 835 662 510 611 584 580 547 646 842 1042 841 892 1115
Congenital syphilis 1 1 0 2 6 3 3 0 3 2 1 1 3 1 5 4 4
Infectious syphilis b,c 1 3 6 29 132 72 57 45 86 81 67 128 244 302 242 232 434 Syphilis – otherb 578 869 724 932 697 587 450 566 495 497 479 517 595 739 594 656 677
Tetanus 5 2 5 4 0 1 3 3 1 3 0 0 1 1 1 2 2
Tuberculosisb 429 394 389 394 443 410 422 382 483 448 416 447 386 431 452 463 452
Typhoidb 11 3 7 1 0 3 5 1 0 3 5 14 13 35 25 31 26
Verotoxin-producing Not notifiable until December 1996 0 2 0 1 1 6 3 5 16 10 23 Escherichia coliinfectionsb
aYear of onset: the earlier of patient reported onset date, specimen date or date of notification. bLaboratory-confirmed cases only. cIncludes Syphilis primary, Syphilis secondary, Syphilis < 1
year duration and Syphilis newly acquired. dFrom 2005, all paratyphoid recorded as salmonellosis. eFoodborne illness cases are only those notified as part of an outbreak.
NOS: not otherwise specified. No case of the following diseases have been notified since 1991: Plagueb, Diphtheriab, Granuloma inguinaleb, Lyssavirusb, Poliomyelitisb, Rabies, Smallpox, Typhusb,
Table 3. Disease notifications by month of onset of illness
a, NSW, 2007
Conditions Jan. Feb. Mar. Apr. May June July Aug. Sept. Oct. Nov. Dec. Total
Adverse event after immunisation 6 3 11 11 59 39 20 23 21 13 13 5 224
Anthrax 0 0 0 0 0 0 0 0 0 0 0 0 0
Arboviral infection 97 97 163 234 196 99 83 80 89 114 127 119 1498
Barmah Forest virusb 43 35 76 125 77 29 32 27 27 34 38 30 573
Ross River virusb 45 52 76 102 113 66 42 46 61 76 84 78 841
Otherb 9 10 11 7 6 4 9 7 1 4 5 11 84
Blood lead level ≥ 15ug/dLb 7 7 26 9 24 15 38 47 36 23 20 11 263
Botulism 0 0 0 0 0 0 0 0 0 0 0 0 0
Brucellosisb 1 1 1 0 0 0 0 0 0 0 0 0 3
Chancroidb 0 0 0 0 0 0 0 0 0 0 0 0 0
Chlamydia trachomatisinfection 1039 1196 1203 913 1080 958 1011 970 927 1138 1157 855 12447
Congenital chlamydiab 2 2 3 3 3 2 4 3 3 0 3 3 31
Chlamydia – other b 1037 1194 1200 910 1077 956 1007 967 924 1138 1154 852 12416
Cholerab 0 0 1 0 0 1 0 0 0 0 0 0 2
Creutzfeldt–Jakob diseaseb 1 0 0 3 0 2 1 0 0 0 0 0 7
Cryptosporidiosisb 37 42 25 32 33 16 18 15 22 35 157 112 544
Foodborne illness (NOS)e 77 67 395 21 38 21 30 15 34 38 27 0 763
Gastroenteritis (institutional) 154 221 423 438 562 873 1794 1471 1543 1679 935 395 10488
Giardiasisb 161 191 245 151 185 159 147 149 122 122 190 118 1940
Gonorrhoeab 144 119 133 118 132 116 87 91 96 125 98 125 1384
Haemolytic uraemic syndrome 2 1 1 1 0 0 1 0 1 1 2 3 13
Haemophilus influenzaeserotype b 0 0 0 0 0 1 1 2 0 1 2 0 7
Hib epiglottitisb 0 0 0 0 0 0 0 0 0 0 1 0 1
Hib meningitisb 0 0 0 0 0 1 0 0 0 0 1 0 2
Hib septicaemiab 0 0 0 0 0 0 1 1 0 0 0 0 2
Hib infection NOSb 0 0 0 0 0 0 0 1 0 1 0 0 2
Hepatitis Ab 9 11 3 3 4 5 8 6 2 3 5 6 65
Hepatitis B 242 204 268 224 224 219 232 215 205 210 240 173 2656
Hepatitis B – acute viralb 9 4 4 3 8 7 2 1 5 1 11 1 56
Hepatitis B – otherb 233 200 264 221 216 212 230 214 200 209 229 172 2600
Hepatitis C 372 344 422 323 399 330 331 384 357 378 346 273 4259
Hepatitis C – acute viralb 4 9 3 4 7 3 8 7 4 2 2 0 53
Hepatitis C – otherb 368 335 419 319 392 327 323 377 353 376 344 273 4206
Hepatitis Db 2 0 1 2 2 0 2 0 1 1 0 0 11
Hepatitis Eb 0 0 4 0 0 0 1 1 0 1 0 1 8
HIV infectionb 34 45 32 34 47 23 31 35 27 31 35 30 404
Influenza 37 33 37 51 26 90 583 754 179 66 39 23 1918
Influenza-Type Ab 29 18 30 30 15 68 526 601 102 35 24 9 1487
Influenza-Type Bb 3 12 5 8 5 10 27 38 29 22 13 8 180
Influenza-Type A & Bb 3 0 2 10 3 6 4 6 5 3 1 0 43
Influenza-Type NOSb 2 3 0 3 3 6 26 109 43 6 1 6 208
Legionellosis 14 12 8 13 7 10 7 2 4 4 12 12 105
Legionella longbeachaeb 3 5 3 6 1 2 3 0 1 1 2 2 29
L. pneumophilab 11 7 5 7 6 8 4 1 3 3 8 10 73
Legionnaire disease other 0 0 0 0 0 0 0 1 0 0 2 0 3
Leprosy 1 1 1 0 0 0 0 0 0 0 0 1 4
Leptospirosisb 1 1 3 0 0 0 0 1 1 0 1 0 8
Listeriosisb 3 2 1 3 1 1 2 2 1 0 4 2 22
Lymphogranuloma venereum (LGV)b 0 0 0 0 0 0 0 0 0 0 0 0 0
Malariab 9 9 10 5 8 6 5 12 10 12 7 5 98
Measles 0 1 1 0 1 0 1 0 0 0 0 0 4
Measles laboratory confirmed 0 1 1 0 1 0 1 0 0 0 0 0 4
Measles – other 0 0 0 0 0 0 0 0 0 0 0 0 0
Meningococcal disease 7 0 10 5 7 9 13 21 9 12 8 11 112
Meningococcal – serogroup Bb 6 0 4 2 2 5 8 17 8 7 7 10 76
Meningococcal – serogroup Cb 1 0 3 2 2 0 0 0 1 0 1 0 10
Meningococcal – serogroup W135b 0 0 1 0 0 1 0 0 0 0 0 0 2
Meningococcal – serogroup Yb 0 0 0 0 0 2 1 0 0 1 0 1 5
Meningococcal – other 0 0 2 1 3 1 4 4 0 4 0 0 19
Mumpsb 15 4 5 11 29 17 15 27 38 56 59 47 323
Pertussis 122 136 100 112 167 174 211 180 177 268 255 191 2093
Pneumococcal disease (invasive)b 25 18 30 36 35 61 85 78 48 43 38 25 522
Psittacosisb 5 3 3 5 5 1 0 2 1 5 3 1 34
Q feverb 23 18 14 14 20 15 15 15 16 21 24 20 215
Rubella 0 2 1 0 1 4 0 0 0 0 1 0 9
Congenital rubellab 0 0 0 0 0 1 0 0 0 0 0 0 1
Rubella – otherb 0 2 1 0 1 3 0 0 0 0 1 0 8
Salmonellainfectionb,d 233 314 510 317 186 126 108 114 115 155 202 184 2564
Shigellosisb 4 4 9 7 8 4 6 12 3 4 4 6 71
Syphilis 93 93 107 78 105 97 78 118 83 85 98 80 1115
Congenital syphilis 0 1 1 0 0 0 0 0 0 0 1 1 4
Infectious syphilis b,c 40 38 29 33 41 43 35 41 27 30 49 28 434
Syphilis – otherb 53 54 77 45 64 54 43 77 56 55 48 51 677
Tetanus 0 0 0 0 0 0 1 0 0 0 0 1 2
Tuberculosisb 54 45 49 38 27 46 31 36 37 41 28 20 452
Typhoidb 2 6 3 6 2 1 3 2 0 0 1 0 26
Verotoxin - producing 1 1 1 1 1 0 0 0 0 5 8 5 23
Escherichia coliinfectionsb
aYear of onset: the earlier of patient reported onset date, specimen date or date of notification. bLaboratory-confirmed cases only. cIncludes Syphilis primary, Syphilis
secondary, Syphilis < 1 year duration and Syphilis newly acquired. dIncludes all paratyphoid cases. eFoodborne illness cases are only those notified as part of an outbreak.
NOS: not otherwise specified. No case of the following diseases have been notified since 1991: Plagueb, Diphtheriab, Granuloma inguinaleb, Lyssavirusb, Poliomyelitisb, Rabies,
Table 4. Disease notifications by Area Health Service of residence (2005 AHS boundaries), crude rates per 100 000 population,
NSW, 2007
Condition Greater Southernf Greater Westernf Hunter New Englandf North Coastf
Albury Goulburn Broken Hill Dubbo Bathurst Newcastle Tamworth Port Macquarie Lismore
Adverse event after immunisation 7.12 8.14 2.22 4.83 5.79 2.57 1.68 1.39 2.46
Anthrax 0 0 0 0 0 0 0 0 0
Arboviral infection 22.11 64.13 66.71 84.07 15.62 57.46 38.05 76.72 74.85
Barmah Forest virusb 2.62 50.25 4.45 9.66 2.31 20.24 9.51 31.24 39
Ross River virusb 19.12 12.92 62.26 73.44 12.73 36.88 27.42 44.09 31.98
Otherb 0.37 0.96 0 0.97 0.58 0.34 1.12 1.39 3.87
Blood lead level ≥ 15ug/dLb 3 1.91 11.12 71.5 4.63 3.77 0.56 0.69 1.05
Botulism 0 0 0 0 0 0 0 0 0
Brucellosisb 0 0 0 0 0.58 0 0 0 0
Chancroidb 0 0 0 0 0 0 0 0 0
Chlamydia trachomatisinfection 176.6 126.3 231.3 143 206.6 229 232.2 123.6 217.2
Congenital chlamydiab 0.37 0.96 2.22 0 0.58 0.34 0 0.35 0.7
Chlamydia – other b 176.2 125.4 229 143 206 228.7 232.2 123.2 216.5
Cholerab 0 0 0 0 0 0 0 0 0
Creutzfeldt–Jakob diseaseb 0 0 0 0 0 0.17 0 0 0
Cryptosporidiosisb 19.49 6.7 4.45 16.43 19.1 7.21 35.26 9.37 17.22
Giardiasisb 17.62 15.31 8.89 42.52 16.78 28.65 33.02 19.09 5.97
Gonorrhoeab 5.25 1.91 0 3.87 6.37 12.87 5.6 2.43 14.76
Haemolytic uraemic syndrome 0 0 0 0 0.58 0.86 0.56 0 0
H.influenzaeserotype b 0.37 0 0 0 0 0.17 0 0.35 0
Hib epiglottitisb 0 0 0 0 0 0 0 0 0
Hib meningitisb 0.37 0 0 0 0 0 0 0.35 0
Hib septicaemiab 0 0 0 0 0 0.17 0 0 0
Hib infection NOSb 0 0 0 0 0 0 0 0 0
Hepatitis Ab 0 0 0 0.97 0.58 0.17 0 0.35 1.76
Hepatitis B 13.49 11.01 22.24 9.67 1.16 8.4 10.63 5.9 12.65
Hepatitis B – acute viralb 0.75 1.44 0 0.97 0 1.37 0 0 0.7
Hepatitis B – otherb 12.74 9.57 22.24 8.7 1.16 7.03 10.63 5.9 11.95
Hepatitis C 38.98 55.04 77.82 68.6 61.34 55.07 50.93 48.25 76.25
Hepatitis C – acute viralb 0.37 1.44 6.67 4.83 0.58 0.69 1.68 0 0
Hepatitis C – otherb 38.61 53.6 71.15 63.77 60.76 54.38 49.25 48.25 76.25
Hepatitis Db 0 0 0 0 0 0 0 0 0
Hepatitis Eb 0 0 0 0 0 0 0 0 0
HIV infectionb 0.75 1.44 0 1.93 1.16 3.09 0.56 1.39 1.41
Influenza 14.98 35.9 22.24 19.33 37.04 37.22 45.33 15.27 58.32
Influenza-Type Ab 13.87 33.5 22.24 16.43 34.72 32.42 40.85 14.23 21.43
Influenza-Type Bb 0.37 1.44 0 2.9 1.74 4.8 3.36 0 1.05
Influenza-Type A & Bb 0.37 0.96 0 0 0 0 0.56 0 1.05
Influenza-Type NOSb 0.37 0 0 0 0.58 0 0.56 1.04 34.79
Legionellosis 1.12 2.39 0 0 0 0.85 2.24 1.38 1.05
L. longbeachaeb 0.37 0.48 0 0 0 0.34 1.12 0.69 0
L. pneumophilab 0 1.91 0 0 0 0.51 0.56 0.69 1.05
Legionnaire disease other 0.75 0 0 0 0 0 0.56 0 0
Leprosy 0 0 0 0 0 0 0 0 0
Leptospirosisb 0 0 0 0.97 0 0.17 0.56 0.69 1.05
Listeriosisb 0 0 2.22 0 0 0.86 0 0 0
Lymphogranuloma venereum (LGV)b 0 0 0 0 0 0 0 0 0
Malariab 1.12 2.87 0 0 0.58 2.4 1.12 1.39 0.7
Measles 0 0 0 0 0 0 0 0 0
Measles laboratory confirmed 0 0 0 0 0 0 0 0 0
Measles – other 0 0 0 0 0 0 0 0 0
Meningococcal disease 1.49 2.87 0 2.9 1.16 1.54 1.68 0.69 2.1
Meningococcal – serogroup Bb 0.75 2.39 0 2.9 1.16 1.03 1.12 0.69 1.05
Meningococcal – serogroup Cb 0.37 0 0 0 0 0.17 0 0 0.7
Meningococcal – serogroup W135b 0 0.48 0 0 0 0 0 0 0
Meningococcal – serogroup Yb 0 0 0 0 0 0 0 0 0
Meningococcal – other 0.37 0 0 0 0 0.34 0.56 0 0.35
Mumpsb 0.75 0 0 0 1.16 0.86 0.56 0 0
Pertussis 23.99 26.32 13.34 55.08 10.42 34.31 35.81 16.66 32.33
Pneumococcal disease (invasive)b 7.87 6.7 15.57 14.49 6.94 10.98 9.51 9.03 7.03
Psittacosisb 1.5 0.48 2.22 1.93 1.74 0.86 0 0.35 0.7
Q feverb 1.5 6.22 6.67 44.45 4.63 3.6 31.9 5.55 9.49
Rubella 0 0 0 2.9 0 0 0.56 0 0
Congenital rubellab 0 0 0 0 0 0 0 0 0
Rubella – otherb 0 0 0 2.9 0 0 0.56 0 0
Salmonellainfectionb,d 31.86 26.8 15.57 27.06 27.2 32.59 43.65 27.08 76.6
Shigellosisb 0 1.44 0 0.97 0 0.51 0.56 1.04 2.81
Syphilis 3.37 3.83 31.13 15.46 9.26 4.29 4.48 9.37 4.22
Congenital syphilis 0 0 0 0 0.58 0 0 0 0
Infectious syphilisb,c 0.37 0.96 2.22 0 1.74 2.06 1.12 0.69 1.76
Syphilis – otherb 3 2.87 28.91 15.46 6.94 2.23 3.36 8.68 2.46
Tetanus 0 0 0 0 0 0 0 0 0.35
Tuberculosisb 1.12 2.87 0 0 0.58 2.74 0.56 1.39 1.41
Typhoidb 0.37 0 0 0 0 0 0 0 0
Verotoxin-producing Escherichia coliinfectionsb 1.12 0.48 0 0 0 1.54 2.24 0 0.35
aYear of onset: the earlier of patient reported onset date, specimen date or date of notification. bLaboratory-confirmed cases only. cIncludes Syphilis primary, Syphilis secondary, Syphilis
< 1 year duration and Syphilis newly acquired. dIncludes all paratyphoid cases. fAHS further divided into the geographical region covered by their component Public Health Unit. gRate is based on a denominator of 8000 persons. hIncludes cases with unknown PHU. NOS: not otherwise specified. No case of the following diseases have been notified since 1991:
Plagueb, Diphtheriab, Granuloma inguinaleb, Lyssavirusb, Poliomyelitisb, Rabies, Smallpox, Typhusb, Viral haemorrhagic fever, Yellow fever.
Table 4.
continued
Condition Northern Sydney Central Coastf South Eastern Sydney Illawaraf Sydney South Westf Sydney Westf Justice
Gosford Hornsby Wollongong Randwick Camperdown Liverpool Penrith Parramatta Health
Adverse event after immunisation 4.84 1.73 5.08 3.07 1.14 1.93 5.98 3.63 0
Anthrax 0 0 0 0 0 0 0 0 0
Arboviral infection 21.63 4.96 26.74 5.28 3.42 1.68 4.41 3.12 12.5
Barmah Forest virusb 5.17 0.74 18.45 0.49 0.57 0.24 0.63 0.78 12.5
Ross River virusb 14.85 2.73 7.49 2.09 1.52 0.84 3.15 1.95 0
Otherb 1.61 1.49 0.8 2.7 1.33 0.6 0.63 0.39 0
Blood lead level ≥ 15ug/dLb 0.97 1.24 5.61 1.59 2.66 2.77 2.52 3.89 0
Botulism 0 0 0 0 0 0 0 0 0
Brucellosisb 0 0 0 0.12 0 0.12 0 0 0
Chancroidb 0 0 0 0 0 0 0 0 0
Chlamydia trachomatisinfection 186.9 133.3 154.6 280.1 253.8 99.9 128.8 135.1 1188
Congenital chlamydiab 0.32 0.37 0 0.12 0.19 0.36 0.63 1.17 0
Chlamydia – other b 186.6 132.9 154.6 279.9 253.6 99.54 128.2 134 1188
Cholerab 0 0.12 0 0 0.19 0 0 0 0
Creutzfeldt–Jakob diseaseb 0.32 0 0.53 0.12 0 0.12 0.31 0 0
Cryptosporidiosisb 7.1 5.33 4.01 4.66 4.18 5.79 6.61 4.41 0
Giardiasisb 26.15 38.77 22.19 40.6 38.21 14.36 26.76 34.62 25
Gonorrhoeab 9.36 15.48 8.56 57.53 56.46 11.58 11.97 12.45 100
Haemolytic uraemic syndrome 0 0 0.27 0.12 0.19 0.12 0 0.13 0
H.influenzaeserotype b 0 0.12 0 0.12 0 0.12 0 0.13 0
Hib epiglottitisb 0 0.12 0 0 0 0 0 0 0
Hib meningitisb 0 0 0 0 0 0 0 0 0
Hib septicaemiab 0 0 0 0 0 0 0 0.13 0
Hib infection NOSb 0 0 0 0.12 0 0.12 0 0 0
Hepatitis Ab 0 1.61 0.8 1.23 1.14 1.45 0.94 1.17 0
Hepatitis B 10.66 35.42 12.3 47.35 81.17 72.39 12.28 72.23 550
Hepatitis B – acute viralb 0.65 0.74 0 1.72 0.57 1.45 0.31 0.13 12.5
Hepatitis B – otherb 10.01 34.68 12.3 45.63 80.6 70.94 11.97 72.1 537.5
Hepatitis C 60.05 25.15 49.47 48.46 75.85 59.72 50.06 49.15 7675
Hepatitis C – acute viralb 0 0 0 0.25 3.99 0.6 0 0.13 50
Hepatitis C – otherb 60.05 25.15 49.47 48.21 71.86 59.12 50.06 49.02 7625
Hepatitis Db 0.32 0 0.53 0.37 0 0 0.31 0.52 0
Hepatitis Eb 0.32 0.12 0 0.37 0.57 0 0 0 0
HIV infectionb 2.58 3.84 2.41 15.7 18.44 2.9 0.94 3.89 0
Influenza 17.43 17.59 16.31 22.69 8.55 14.12 39.04 60.04 37.5
Influenza-Type Ab 12.27 10.16 12.3 14.35 5.51 9.29 31.49 55.89 37.5
Influenza-Type Bb 0.32 0.74 2.41 6.38 2.85 1.21 4.41 3.37 0
Influenza-Type A & Bb 0 0.25 1.07 1.96 0 0 2.83 0.65 0
Influenza-Type NOSb 4.84 6.44 0.53 0 0.19 3.62 0.31 0.13 0
Legionellosis 1.3 0.99 1.6 1.6 1.52 1.57 3.15 2.47 0
L. longbeachaeb 0.65 0.25 1.07 0.25 0 0.48 0.63 0.65 0
L. pneumophilab 0.65 0.74 0.53 1.35 1.52 1.09 2.52 1.82 0
Legionnaire disease other 0 0 0 0 0 0 0 0 0
Leprosy 0 0 0 0 0 0 0 0.52 0
Leptospirosisb 0 0 0 0 0 0 0 0 0
Listeriosisb 0 0.37 0.53 0.61 0.19 0.24 0.31 0.26 0
Lymphogranuloma venereum (LGV)b 0 0 0 0 0 0 0 0 0
Malariab 0.65 1.24 1.6 0.98 1.71 0.6 1.89 2.07 0
Measles 0 0.12 0 0.12 0 0.12 0 0 0
Measles laboratory confirmed 0 0.12 0 0.12 0 0.12 0 0 0
Measles – other 0 0 0 0 0 0 0 0 0
Meningococcal disease 1.94 1.6 1.07 2.08 0.95 1.45 1.57 1.82 0
Meningococcal – serogroup Bb 0.97 1.36 0.8 1.1 0.76 1.09 1.26 1.04 0
Meningococcal – serogroup Cb 0.32 0 0.27 0.37 0.19 0 0 0 0
Meningococcal – serogroup W135b 0 0 0 0 0 0.12 0 0 0
Meningococcal – serogroup Yb 0.65 0.12 0 0.12 0 0 0 0.13 0
Meningococcal – other 0 0.12 0 0.49 0 0.24 0.31 0.65 0
Mumpsb 0.32 6.32 3.21 16.68 5.89 3.26 3.15 5.19 0
Pertussis 24.54 34.81 20.86 39.13 33.65 18.46 27.39 41.11 0
Pneumococcal disease (invasive)b 7.1 6.94 9.63 6.13 7.79 5.31 7.87 6.22 12.5
Psittacosisb 0 0 0.8 0.25 0 0.24 1.57 0.39 0
Q feverb 0.97 0.12 3.21 0.12 0 0 0.31 0.26 0
Rubella 0 0.12 0 0 0.19 0 0 0.39 0
Congenital rubellab 0 0 0 0 0 0 0 0.13 0
Rubella – otherb 0 0.12 0 0 0.19 0 0 0.26 0
Salmonellainfectionb,d 45.84 41.99 22.99 36.19 45.43 30.28 32.12 39.68 12.5
Shigellosisb 0 1.61 0.27 1.84 2.28 0.72 0 0.52 0
Syphilis 6.78 6.69 8.29 40.85 47.72 16.65 8.5 12.32 237.5
Congenital syphilis 0 0.12 0 0 0 0 0 0.26 0
Infectious syphilisb,c 0.32 2.11 1.87 29.2 17.49 1.33 1.26 3.63 25
Syphilis – otherb 6.46 4.46 6.42 11.65 30.23 15.32 7.24 8.43 212.5
Tetanus 0 0 0.27 0 0 0 0 0 0
Tuberculosisb 1.29 5.33 2.67 7.73 12.93 9.77 4.09 16.6 0
Typhoidb 0 0.25 0 0.25 0.57 0.48 0 1.69 0
Verotoxin-producing Escherichia 0 0.12 0 0 0 0.12 0.63 0.13 0
coliinfectionsb
aYear of onset: the earlier of patient reported onset date, specimen date or date of notification. bLaboratory-confirmed cases only. cIncludes Syphilis primary, Syphilis secondary, Syphilis
< 1 year duration and Syphilis newly acquired. dIncludes all paratyphoid cases. fAHS further divided into the geographical region covered by their component Public Health Unit. gRate is based on a denominator of 8000 persons. hIncludes cases with unknown PHU. NOS: not otherwise specified. No case of the following diseases have been notified since 1991:
Plagueb, Diphtheriab, Granuloma inguinaleb, Lyssavirusb, Poliomyelitisb, Rabies, Smallpox, Typhusb, Viral haemorrhagic fever, Yellow fever.
Table 5. Disease notifications by Area Health Service of residence (2005 AHS boundaries)
Condition Greater Southernf Greater Westernf Hunter New Englandf North Coastf
Albury Goulburn Broken Hill Dubbo Bathurst Newcastle Tamworth Port Macquarie Lismore
Adverse event after immunisation 19 17 1 5 10 15 3 4 7
Anthrax 0 0 0 0 0 0 0 0 0
Arboviral infection 59 134 30 87 27 335 68 221 213
Barmah Forest virusb 7 105 2 10 4 118 17 90 111
Ross River virusb 51 27 28 76 22 215 49 127 91
Otherb 1 2 0 1 1 2 2 4 11
Blood lead level ≥ 15ug/dLb 8 4 5 74 8 22 1 2 3
Botulism 0 0 0 0 0 0 0 0 0
Brucellosisb 0 0 0 0 1 0 0 0 0
Chancroidb 0 0 0 0 0 0 0 0 0
Chlamydia trachomatisinfection 471 264 104 148 357 1335 415 356 618
Congenital chlamydiab 1 2 1 0 1 2 0 1 2
Chlamydia – other b 470 262 103 148 356 1333 415 355 616
Cholerab 0 0 0 0 0 0 0 0 0
Creutzfeldt–Jakob diseaseb 0 0 0 0 0 1 0 0 0
Cryptosporidiosisb 52 14 2 17 33 42 63 27 49
Gastroenteritis (institutional) 120 583 247 38 60 1929 167 65 583
Giardiasisb 47 32 4 44 29 167 59 55 17
Gonorrhoeab 14 4 0 4 11 75 10 7 42
Haemolytic uraemic syndrome 0 0 0 0 1 5 1 0 0
Haemophilus influenzaeserotype b 1 0 0 0 0 1 0 1 0
Hib epiglottitisb 0 0 0 0 0 0 0 0 0
Hib meningitisb 1 0 0 0 0 0 0 1 0
Hib septicaemiab 0 0 0 0 0 1 0 0 0
Hib infection NOSb 0 0 0 0 0 0 0 0 0
Hepatitis Ab 0 0 0 1 1 1 0 1 5
Hepatitis B 36 23 10 10 2 49 19 17 36
Hepatitis B – acute viralb 2 3 0 1 0 8 0 0 2
Hepatitis B – otherb 34 20 10 9 2 41 19 17 34
Hepatitis C 104 115 35 71 106 321 91 139 217
Hepatitis C – acute viralb 1 3 3 5 1 4 3 0 0
Hepatitis C – otherb 103 112 32 66 105 317 88 139 217
Hepatitis Db 0 0 0 0 0 0 0 0 0
Hepatitis Eb 0 0 0 0 0 0 0 0 0
HIV infectionb 2 3 0 2 2 18 1 4 4
Influenza 40 75 10 20 64 217 81 44 166
Influenza-Type Ab 37 70 10 17 60 189 73 41 61
Influenza-Type Bb 1 3 0 3 3 28 6 0 3
Influenza-Type A & Bb 1 2 0 0 0 0 1 0 3
Influenza-Type NOSb 1 0 0 0 1 0 1 3 99
Legionellosis 3 5 0 0 0 5 4 4 3
Legionella longbeachaeb 1 1 0 0 0 2 2 2 0
L. pneumophilab 0 4 0 0 0 3 1 2 3
Legionnaire disease other 2 0 0 0 0 0 1 0 0
Leprosy 0 0 0 0 0 0 0 0 0
Leptospirosisb 0 0 0 1 0 1 1 2 3
Listeriosisb 0 0 1 0 0 5 0 0 0
Lymphogranuloma venereum (LGV)b 0 0 0 0 0 0 0 0 0
Malariab 3 6 0 0 1 14 2 4 2
Measles 0 0 0 0 0 0 0 0 0
Measles laboratory confirmed 0 0 0 0 0 0 0 0 0
Measles – other 0 0 0 0 0 0 0 0 0
Meningococcal disease 4 6 0 3 2 9 3 2 6
Meningococcal – serogroup Bb 2 5 0 3 2 6 2 2 3
Meningococcal – serogroup Cb 1 0 0 0 0 1 0 0 2
Meningococcal – serogroup W135b 0 1 0 0 0 0 0 0 0
Meningococcal – serogroup Yb 0 0 0 0 0 0 0 0 0
Meningococcal – other 1 0 0 0 0 2 1 0 1
Mumpsb 2 0 0 0 2 5 1 0 0
Pertussis 64 55 6 57 18 200 64 48 92
Pneumococcal disease (invasive)b 21 14 7 15 12 64 17 26 20
Psittacosisb 4 1 1 2 3 5 0 1 2
Q feverb 4 13 3 46 8 21 57 16 27
Rubella 0 0 0 3 0 0 1 0 0
Congenital rubellab 0 0 0 0 0 0 0 0 0
Rubella – otherb 0 0 0 3 0 0 1 0 0
Salmonellainfectionb,d 85 56 7 28 47 190 78 78 218
Shigellosisb 0 3 0 1 0 3 1 3 8
Syphilis 9 8 14 16 16 25 8 27 12
Congenital syphilis 0 0 0 0 1 0 0 0 0
Infectious syphilis b,c 1 2 1 0 3 12 2 2 5
Syphilis – otherb 8 6 13 16 12 13 6 25 7
Tetanus 0 0 0 0 0 0 0 0 1
Tuberculosisb 3 6 0 0 1 16 1 4 4
Typhoidb 1 0 0 0 0 0 0 0 0
Verotoxin-producing Escherichia coliinfectionsb 3 1 0 0 0 9 4 0 1
aYear of onset: the earlier of patient reported onset date, specimen date or date of notification. bLaboratory-confirmed cases only. cincludes Syphilis primary, Syphilis secondary, Syphilis
< 1 year duration and Syphilis newly acquired. dincludes all paratyphoid cases. fAHS further divided into the geographical region covered by their component public health unit. gRate is based on a denominator of 8000 persons. hIncludes cases with unknown PHU. NOS: not otherwise specified. No case of the following diseases have been notified since 1991:
Plagueb, Diphtheriab, Granuloma inguinaleb, Lyssavirusb, Poliomyelitisb, Rabies, Smallpox, Typhusb, Viral haemorrhagic fever, Yellow fever.
Table 5.
continued
Condition Northern Sydney Central Coastf South Eastern Sydney Illawaraf Sydney South Westf Sydney Westf Justice Total
Gosford Hornsby Wollongong Randwick Camperdown Liverpool Penrith Parramatta Health
Adverse event after immunisation 15 14 19 25 6 16 19 28 0 224
Anthrax 0 0 0 0 0 0 0 0 0 0
Arboviral infection 67 40 100 43 18 14 14 24 1 1498
Barmah Forest virusb 16 6 69 4 3 2 2 6 1 573
Ross River virusb 46 22 28 17 8 7 10 15 0 841
Otherb 5 12 3 22 7 5 2 3 0 84
Blood lead level ≥ 15ug/dLb 3 10 21 13 14 23 8 30 0 263
Botulism 0 0 0 0 0 0 0 0 0 0
Brucellosisb 0 0 0 1 0 1 0 0 0 3
Chancroidb 0 0 0 0 0 0 0 0 0 0
Chlamydia trachomatisinfection 579 1076 578 2283 1335 828 409 1042 95 12447
Congenital chlamydiab 1 3 0 1 1 3 2 9 0 31
Chlamydia – other b 578 1073 578 2282 1334 825 407 1033 95 12416
Cholerab 0 1 0 0 1 0 0 0 0 2
Creutzfeldt–Jakob diseaseb 1 0 2 1 0 1 1 0 0 7
Cryptosporidiosisb 22 43 15 38 22 48 21 34 0 544
Gastroenteritis (institutional) 431 1908 366 878 701 770 78 1552 12 10488
Giardiasisb 81 313 83 331 201 119 85 267 2 1940
Gonorrhoeab 29 125 32 469 297 96 38 96 8 1384
Haemolytic uraemic syndrome 0 0 1 1 1 1 0 1 0 13
Haemophilus influenzaeserotype b 0 1 0 1 0 1 0 1 0 7
Hib epiglottitisb 0 1 0 0 0 0 0 0 0 1
Hib meningitisb 0 0 0 0 0 0 0 0 0 2
Hib septicaemiab 0 0 0 0 0 0 0 1 0 2
Hib infection NOSb 0 0 0 1 0 1 0 0 0 2
Hepatitis Ab 0 13 3 10 6 12 3 9 0 65
Hepatitis B 33 286 46 386 427 600 39 557 44 2656
Hepatitis B – acute viralb 2 6 0 14 3 12 1 1 1 56
Hepatitis B – otherb 31 280 46 372 424 588 38 556 43 2600
Hepatitis C 186 203 185 395 399 495 159 379 614 4259
Hepatitis C – acute viralb 0 0 0 2 21 5 0 1 4 53
Hepatitis C – otherb 186 203 185 393 378 490 159 378 610 4206
Hepatitis Db 1 0 2 3 0 0 1 4 0 11
Hepatitis Eb 1 1 0 3 3 0 0 0 0 8
HIV infectionb 8 31 9 128 97 24 3 30 0 404
Influenza 54 142 61 185 45 117 124 463 3 1918
Influenza-Type Ab 38 82 46 117 29 77 100 431 3 1487
Influenza-Type Bb 1 6 9 52 15 10 14 26 0 180
Influenza-Type A & Bb 0 2 4 16 0 0 9 5 0 43
Influenza-Type NOSb 15 52 2 0 1 30 1 1 0 208
Legionellosis 4 8 6 13 8 13 10 19 0 105
Legionella longbeachaeb 2 2 4 2 0 4 2 5 0 29
L. pneumophilab 2 6 2 11 8 9 8 14 0 73
Legionnaire disease other 0 0 0 0 0 0 0 0 0 3
Leprosy 0 0 0 0 0 0 0 4 0 4
Leptospirosisb 0 0 0 0 0 0 0 0 0 8
Listeriosisb 0 3 2 5 1 2 1 2 0 22
Lymphogranuloma venereum (LGV)b 0 0 0 0 0 0 0 0 0 0
Malariab 2 10 6 8 9 5 6 16 0 98
Measles 0 1 0 1 0 1 0 0 0 4
Measles laboratory confirmed 0 1 0 1 0 1 0 0 0 4
Measles – other 0 0 0 0 0 0 0 0 0 0
Meningococcal disease 6 13 4 17 5 12 5 14 0 112
Meningococcal – serogroup Bb 3 11 3 9 4 9 4 8 0 76
Meningococcal – serogroup Cb 1 0 1 3 1 0 0 0 0 10
Meningococcal – serogroup W135b 0 0 0 0 0 1 0 0 0 2
Meningococcal – serogroup Yb 2 1 0 1 0 0 0 1 0 5
Meningococcal – other 0 1 0 4 0 2 1 5 0 19
Mumpsb 1 51 12 136 31 27 10 40 0 323
Pertussis 76 281 78 319 177 153 87 317 0 2093
Pneumococcal disease (invasive)b 22 56 36 50 41 44 25 48 1