*Corresponding author:Jeet Ganatra
K. J. Somaiya Institute of Engineering and Information Technology, University of Mumbai, Mumbai, India ISSN: 0976-3031
Research Article
MINING FREQUENT PATTERNS USING CUSTOMER EXPERIENCE
*Jeet Ganatra, Mihir Thakkar, Kunal Shah and Vaishali Gaikwad
K. J. Somaiya Institute of Engineering and Information Technology,
University of Mumbai, Mumbai, India
ARTICLE INFO ABSTRACT
Classification and patterns exploration from user data is very crucial for business support and decision making. Timely identification of newly emerging trends is needed in business process. The patterns obtained observing the sales from inventory data point out the market trends and can be used in predicting that has great opportunities in decision making, strategic planning and also in market competition. Some of the algorithms already in use have some limitations. Closed and maximal pattern mining algorithms encounter limitations at mining large patterns, since the process will need to generate an explosive number of smaller frequent patterns. The disadvantage of Naive Bayes classifier when used independently makes a very strong assumption on the shape of the data distribution, i.e. any two characteristics are unrelated given the output class. Hence, the objective of the proposed system discussed in this paper is proposing better methods of decision making for improving sales and services. Identifying the reasons of dead stock, slow-moving and fast-moving products are some of the important mechanisms to be carried out in order to obtain a strong business support, investment and surveillance. Our system proposes an algorithm that can be used for mining patterns of customer data and predicts the factors affecting the sale of products, no matter how huge the customer data is. This system combines two algorithms that are K-mean and Most Frequent Pattern (MFP) algorithm. The experimental results showed that the proposed hybrid k-mean plus MFP algorithm can generate more useful patterns from the large stock of data. The final step is to provide a sentiment analysis by using the Naive Bayes Classifier based on customer reviews and feedback.
INTRODUCTION
Data Mining is essentially used today by companies with a strong consumer focus—retail, financial, communication, and
marketing organizations, to “drill down” into their records for
transactional data and determine costing, customer preferences and product positioning, impact on sales, customer satisfaction and corporate profits. Using data mining a retailer can use
‘point-of-sale’ records of the customer purchases and use them
to develop products and promotions to appeal more customers of the same segment.
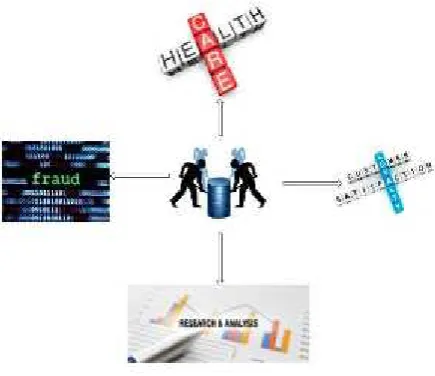
Some of the essential applications of data mining in our day-to-day lives are as follows:
Healthcare: Data mining is known to hold great potential in improving health systems. It uses data and analytics to identify best practices that can be used to improve care and reduce the costs. Researchers use number of data mining approaches. Mining can be used to assume the volume of patients in every category. Processes are
developed in such a manner that makes sure the patients receive appropriate care at the right place and at the right time. Data mining also helps the healthcare insurers to detect fraud and abuses.
Market Basket Analysis: Market basket analysis is a the technique that tends to be based upon a theory that if an individual buys a certain group of items he/she is more likely to buy another group of items. This technique may allow the retailer to know the purchase tendency of a buyer. This information may help the retailer to know the
buyer’s desires and change the store’s layout
accordingly.
CRM: Customer Relationship Management is mainly all about acquiring and retaining customers, also improving
customers’ loyalty and implementing consumer focused
approach. To maintain a proper relationship with a consumer a business needs to collect the data and analyze the information. This is where data mining plays its role. Using data mining technologies the collected data can be used for required analysis. Thus resulting in the vendors
International Journal of
Recent Scientific
Research
International Journal of Recent Scientific Research
Vol. 8, Issue, 3, pp. 15790-15795, March, 2017
Copyright © Jeet Ganatra et al, 2017, this is an open-access article distributed under the terms of the Creative Commons Attribution License, which permits unrestricted use, distribution and reproduction in any medium, provided the original work is properly cited.
Article History:
Received 17thDecember, 2016 Received in revised form 21th January, 2017
Accepted 28thFebruary, 2017 Published online 28thMarch, 2017
Key Words:
Data mining, Clustering, K-means, MFP, Naïve Bayes Classifier, Sentiment Analysis
DOI: http://dx.doi.org/10.24327/ijrsr.2017.0803.0005
understands where to focus in order to retain the customers.
Criminal Investigation: Criminology is a process that aims to determine crime features and characteristics. Actually crime analysis includes exploring and identifying crimes and their relationships with criminals. The increasing number of criminal datasets and also the complexity of the relationships between these kinds of data have made criminology an appropriate field for applying data mining techniques. This can be done by converting the text based crime reports into word processing files. The information thus obtained can be used to perform crime matching process.
Corporate Surveillance: Corporate surveillance is the
observing or tracking of an individual’s or group’s
behavior by a corporation. The data collected is then regularly shared with the government agencies. It can be used by the business to tailor their products required by their consumers. The data can be used for direct marketing requirements, such as the targeted advertisements on Google and Yahoo, where ads are targeted to the user of the search engine by studying their search history and emails.
Data mining consist of various algorithms to accomplish different tasks. The vital purpose of these algorithms is to fit a model to the data obtained. A data mining model on the basis of its nature can be either predictive or descriptive. A predictive model is the one that makes prediction about values of data using known results found from different customer data and various other historical data. The predictive models include categorization, regression, time series analysis and prediction. A descriptive model on the other hand identifies patterns or relationships in data. It explores the properties of the data being examined for the pattern analysis. It does not predict new values of the properties like predictive models. The descriptive models are the ones that consist of clustering, summarization, association rules and sequence discovery.
Classification involves the predictive learning that differentiates a data item into one of several predefined classes. It constitutes examining the characteristics of an item and assigning to it a predefined class. Classification is divided into a two-step process. In the first step a model is built describing a predefined
set of data classes and secondly, the model is used for classification.
For future predictions, data mining techniques like clustering and associations can be used to find significant patterns, Clustering generates groups of related patterns, and association provides a way to get generalized rules of dependent variables. Based on these rules, patterns from stock data are obtained. We can even find the frequent patterns for many applications. For different items in the market some may be fast selling items, some will be slow selling items and some will be dead stock i.e. rarely selling items This is a useful approach to distinguish the selling frequency of items on the basis of the known attributes Data mining techniques are thus best used for the analysis of such type of classification, that are useful pattern extraction and predictions.
Opinion mining involves Sentiment analysis, that is usually used by advertisers, movie creators and various other that wish
to record their customers’ reaction on a specific topic. Though
surveys are considered to be the easiest way to gather opinions, there are considerable numbers of drawbacks that involve great handicaps of the marketing research. A number of issues emerge as a result of this approach. Some of them are the management of a survey for each product or feature that they posses, the format, the classification and timing of the survey, and the need of reliance on the good will of people to take the survey. All the above mentioned problems need high
maintenance for the marketing research group’s view. Now, we
propose to overcome the above mentioned problems with our proposed system.
Section II, i.e. Literature Survey discusses the various papers studied before implementing the proposed system, the advantages and disadvantages of the methodologies used in each. Section III, Proposed System, introduces the algorithms used in our system and gives an overview of the same. Section IV is the detailed study of the methodologies used, namely K-Mean Algorithm, Most Frequent Patterns (MFP) and Naive Bayes Classifiers with their architecture respectively. Section V thus concludes why the proposed system is better than the ones already in use.
LITERATURE SURVEY
In paper [1],Aurangzeb Khan, Khairullah Khan and Baharum B. Baharudin [2009] have discussed the approach of Hybrid Clustering Association Algorithm. This paper has proposed an algorithm for mining patterns of huge stock data to assume the factors affecting the sale of products. In the first phase, the stock data is divided into three different clusters on the basis of sold quantities of the particular product i.e. Dead-Stock (DS), Slow-Moving (SM) and Fast-Slow-Moving (FM) using K-means algorithm. The only drawback of this proposed algorithm is that data in its original format never confirms to the required shape for data mining. It needs to be altered, consolidated, and aggregated so that the mining process can effectively perform on it.
Christos Troussas, Maria Virvou, Kurt Junshean Espinosa, Kevin Llaguno and Jaime Caro[2013], presented an approach of Sentiment analysis using Naive Bayes classifier for language learning. Sentiment analysis is increasingly used by advertisers, movie creators and many other organizations that wish to
acquire their customers’ reaction on a particular topic.
Furthermore, we present important features that achieve a significant gain over a unigram baseline. The disadvantage of this approach is that a sentiment is often represented in subtle or complex way in a text. The major challenge in sentiment analysis is the effort to improve the accuracy of identifying an
individual’s emotions. Ideally, proof from various modes of
interaction should be merged by a computer system so that it
can generate as valid hypotheses as possible about users’
sentiments and emotions.
D. V. S. Shalini, M. Shashi and A. M. Sowjanya[2011] have discussed the procedure of hybrid clustering in mining the patterns of stock data. Hybrid clustering association mining approach is proposed to classify stock data and find compact form of associated patterns of sale. From the experimental results it is clear that proposed approach is very efficient for mining patterns of customer data with less computational time .By these patterns they have predicted the factors affecting the sales. The drawback of this approach is that data mining can use the history of various transactions that can be used to predict the customer behavior and future trends.
Girish Punj and David Stewart [1993] have reviewed the applications of cluster analysis in marketing problems and have recommended a two stage cluster analysis methodology and
preliminary identification of clusters via Ward’s minimum
variance method. The issues and problems faced by cluster analysis are related to its use and validation.
Agrawal et al. [1993], in his study, described that in the near past the exploratory analysis in particular of large sets of market basket data has become topic of relevant research due to different publications on data mining and knowledge in databases and generated association rules from market basket data, which describe approximately relevant 19 interrelations
like “If a consumer buys fruit juice, then, in 40% of the cases
there are chances that he also buys mineral water”.
Piatetsky-Shapiro et al.[1996] surveyed an increasing number of industrial uses of data mining. The authors have resolved the existing data mining tools, described some illustrative applications like marketing, investment, assembling, fraud detection etc. and discussed the problems for deploying successful application and their adoption by business users. They also highlighted upon the fact of extensive realization of the potential value of data mining and an increasing number of researchers and developers in this area.
Peter Spiller and Gerald Lohse[2015], in their paper, present a classification of online retail stores based upon convenience sample of 137 Internet retail stores. Cluster and factor study identified five distinct Web catalog interface categories which give a better understanding of the strategies pursued in Internet-based marketing.
Proposed System
In this work, we have proposed an algorithm for mining patterns of huge customer data to show factors affecting the sale of products.
In first phase, the customer data is divided into three different clusters categorically using k-means algorithm on the basis of quantities of each category of items sold i.e. Dead-Stock (DS), Slow-Moving (SM) and Fast-Moving (FM).
The second phase proposes the MFP algorithm, i.e. the Most Frequent Pattern algorithm that is used to find frequencies of property values of the corresponding items.
MFP provides frequent patterns of item attributes in each category of products.
MFP is considerably similar to Apriori algorithm that is used for strong association among the patterns but it provides most visible patterns of associated objects.
From the experimental results of sample data, it was illustrated that the proposed algorithm of k-mean and association of MFP can generate more useful patterns from large customer data.
We also propose to perform sentiment analysis based on the reviews and feedback provided by the customer.
The output of the K-Means and MFP algorithm combined with the output of Sentiment Analysis can be used to provide much more accurate results and suggestions to the organization to provide them with business solutions.
System Architecture of proposed System
We have two approaches for our proposed system. Our first proposed approach is a two phased model. First we generate clusters using K-Mean algorithm, and then MFP is designed for counting frequencies of items under their specified attributes. K-Means clustering is considered to be simple and one of the efficient clustering algorithms. It is easy to implement.
Means enable easy interpretation of the clustering. The computational cost is fast and efficient.
MFP (Most Frequent Pattern) is an algorithm that has no candidate generation and neither does it consider candidate test. It uses compact data structure. This process enables the elimination of repeated database scan.
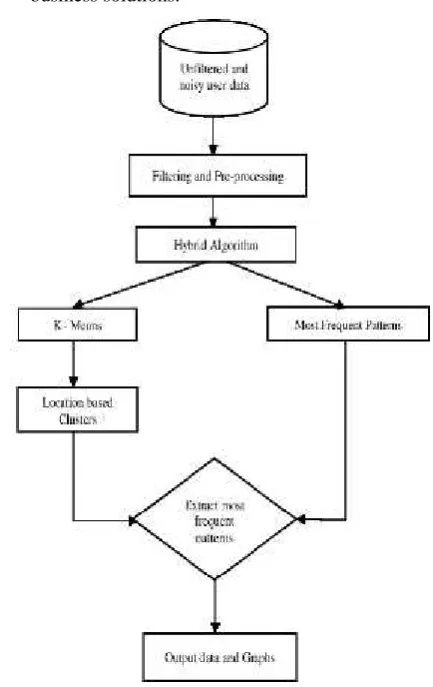
Figure 2 describes the architecture of our proposed system i.e. Hybrid Algorithm, the step-wise division of the phases and their functioning individually.
We gather data from customer.
Pre-processing and filtering of noise can be done on dataset which we take from customer.
Clustering of data set is created using K-means algorithm.
Once we get cluster of data set we apply MFP for generating frequent pattern.
Once we get frequent pattern accordingly suggestion give to user.
Our second proposed approach is performing sentiment analysis. First, we collect reviews and feedback of the customer based on our product. Then, we perform sentiment analysis on the collected data using Naïve Bayes Classifier.
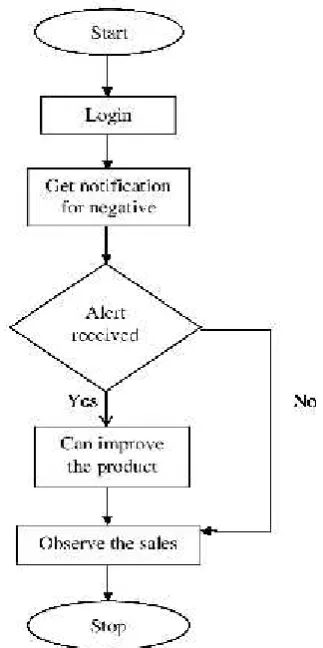
Figure 3 is the flow chart of the working of Sentiment Analysis.
First step is to login into the system.
If the reviews are positive no improvement in the product is required.
In case of a negative review the user will receive a notification alerting him about the same.
On the basis of the reviews the distributors will make improvements in their product.
Final step is to observe the sales.
K-MEANS
K-means is a typical clustering algorithm and has used for classification of data for decades. Proximity is usually measured by some sort of distance; the most commonly being used is the Euclidean distance. If the variables used are huge, then K-Means computes faster than hierarchical clustering only if we keep the value of k small. Even the clusters produced by K-Means are tighter than those produced by the hierarchical clustering, especially if the clusters are globular.
The main idea is to define k centroids, one for each cluster. So, the better choice is to place them as far away as possible from each other. The next step in the process is to consider each point belonging to a given data set and connect it to the nearest possible centroid. When no point is pending, the first step is completed and an early grouping is done. At this point, it is the need to re-calculate k new centroids as centers of the clusters that results from the previous step. After these k new centroids, the next step is new binding that has to be done between the same data points and the nearest new centroid.
The algorithm is composed of the following steps:
1. First, place k points into the space characterized by the objects that are being clustered. These points represent initial group of centroids
2. Next step is to assign each object to the group that has the closest centroid to it.
3. After all objects have been assigned, we need to recalculate the positions of the k centroids
4. Then repeat Step 2 and 3 until we conclude that the centroids no longer move
Most Frequent Patterns (MFP)
Association rule mining is one of the most important and well defined techniques used for extract correlations, frequently observed patterns, associations or causal structures obtained among sets of items in the transaction databases or some other repositories. Association rules are widely used in a number of various areas such as risk management, telecom, market analysis, inventory control, and stock data.
The algorithm is as follows–
Data: Datasets (DS)
Output: Matrix Most Frequent Pattern (MFP): MFP (DS)
Begin
For each item Xi in DS a. for each attribute
i. count the occurrences for Xi C=Count (Xi)
ii. Find attribute name of C that has maximum count Mi=Attribute (Ci)
Next [End of inner loop]
i. MFP=Combine (Mi)
Next [End of outer loop]
Naive Bayes Classifier
Bayesian classifiers are based around the Bayes rule. It can be understood as a way of looking at conditional probabilities that enables us to flip the condition around in a convenient way. A conditional probability is a probability that an event X will occur, given the evidence Y. That is normally written P(X | Y). Thus, having the probability of the opposite result and also of the two components individually allows us to find this probability, i.e.: P(X | Y) = P(X) P(Y | X) / P(Y). This restatement can be very helpful when we are trying to estimate the probability of something based on examples of it occurrence. In our case, we are trying to predict the probability that a document is either positive or negative, given its contents. It can be restated, so that it is in terms of the probability of that document occurring if it has been predetermined to be positive or negative. Having examples of positive and negative opinions from our data set above makes Bayesian classifiers a convenient process.
The aspect that provides this process a “naive” Bayesian one is
that we make a huge assumption about how we can find the probability of the document occurring; it is equal to the product of the probabilities of each word within its occurrence. This implies that there is no link between one word and another word. Independence assumption it is called. It is possible to guess the probability of a word occurring, given a positive or negative sentiment just by looking through a series of examples of positive and negative sentiments and counting how often it occurs/repeats in each class. This is what makes this supervised learning, the requirement for preclassified examples to train on.
Acknowledgement
We wish to express our sincere gratitude to Mrs. Vaishali Gaikwad, our Project Guide for providing us an opportunity to do our project work in the Data Mining domain. We sincerely thank Mr. Uday Rote, HOD of IT Department and Mr. Harsh Namdeo Bhor, Project Coordinator for their guidance and encouragement in carrying out this project work. We also wish to express our gratitude to the officials and other staff members of K. J. Somaiya Institute of Engineering and Information Technology, who rendered their help during the period of our project work.
CONCLUSION
The problem of pattern discovery from customer data mining is addressed. Hybrid clustering association mining approach is proposed to classify customer data and find compact form of associated patterns of sale. From the experimental results it is clear that proposed algorithm is very efficient for mining patterns of huge customer data with less computational time and predicting the factors affecting the sale of products. We also present the sentiment analysis for language learning using Naive Bayes Classifier. Additionally, we present important features that achieve a significant/vital increment over a unigram baseline. In addition, we explore a different method of data representation and report significant improvements over the unigram models. Our data is a random sample of streaming customer feedback and reviews and were not collected by using
specific queries. The advantage of thus using this size of our hand-labeled data allows us to perform cross validation experiments and check for any variance in performance of the classifier across the folds. Finally, we present our experimental results, which show that the accuracy in analyzing the sentimental state of customers, using the Naive Bayes Classifier,is really high.
References
1. Aurangzeb Khan, Khairullah Khan and Baharum B.
Baharudin, “Frequent Patterns Minning Of Stock Data Using Hybrid Clustering Association Algorithm” 2009
International Conference on Information Management and Engineering, 3-5 April, 2009, 978-0-7695-3595-1/09 $25.00 ©2009 IEEE
2. Christos Troussas, Maria Virvou, Kurt Junshean
Espinosa, Kevin Llaguno and Jaime Caro, “Sentiment
analysis of Facebook statuses using Naive Bayes
classifier for language learning ” Information,
Intelligence, Systems and Applications (IISA), 2013 Fourth International Conference, 10-12 July, 2013, 978-1-4799-0771-7 ©2013 IEEE
3. D. V. S. Shalini, M. Shashi and A. M. Sowjanya,
“Mining Frequent Patterns of Stock Data Using Hybrid Clustering” India Conference (INDICON), 2011 Annual
IEEE, 16-18 December, 2011, 978-1-4577-1109-1 ©2011 IEEE
4. Gokhan Sılahtaroğlu and Hale Donertasli, “Analysis and prediction of Ε-customers' behavior by mining
clickstream data” 2015 IEEE International Conference
on Big Data, 29 October-1 November, 2015, 978-1-4799-9926-2 ©2015 IEEE
5. Girish Punj, David Stewart, “Cluster Analysis in
Marketing Research: Review and Suggestions for
Application”, 1993
6. R. Agrawal, T. Imielinski, A. Swami: "Database Mining: A Performance Perspective", IEEE Transactions on Knowledge and Data Engineering, Special issue on Learning and Discovery in Knowledge-Based Databases, 5(6), December 1993.
7. Usama Fayyad, Gregory Piatelsky-Shapiro, Padhraic
Smyth,”Knowledge Discovery and Data Mining: Towards a Unifying Framework”, 1996
8. Peter Spiller and Gerald Lohse,”A Classification of
Online Retail Stores”, 2015
9. Abubakar, Felix “Customer satisfaction with supermarket retail shopping”, 2002.
10. M. Braglia, A. Grassi, R. Montanari “Multi Attribute
classification method for spare parts Inventory
management” 2004.
11. Association Analysis of Customer Services from the Enterprise Customer Management System- ICDM-2006. 12. Terry Harris, “Optimization creates lean green supply
chains”, 2008.
13. G. Grahne, and J. Zhu. Fast Algorithms for Frequent Itemset Mining Using FP-Trees. IEEE Transactions on Knowledge and Data Engineering. 17(10), pp. 1347–
1362, 2005, vol. 17, no. 10, pp. 1347–1362, October, 2005.
Inference. ACM SIGKDD Explorations Newsletter, 2(2), pp. 66–75, 2000.
15. J.-F. Boulicaut, A. Bykowski, and C. Rigotti. Free-sets: A Condensed Representation of Boolean data for the Approximation of Frequency Queries. Data Mining and Knowledge Discovery, 7(1), pp. 5–22, 2003.
16. C. Lucchese, S. Orlando, and R. Perego. Fast and memory efficient mining of frequent closed itemsets. IEEE TKDE Journal, 18(1), pp. 21–36, January 2006. 17. B. Negrevergne, T. Guns, A. Dries, and S. Nijssen.
Dominance Programming for Itemset Mining. IEEE ICDM Conference, 2013.