Navigating public health chemicals policy
in Australia: a policy maker's
and practitioner's guide
Adam Capon
A,B,C, Wayne Smith
Band James A. Gillespie
AA
Menzies Centre for Health Policy, The University of Sydney B
Environmental Health Branch, Health Protection NSW C
Corresponding author. Email: [email protected].
Abstract: Chemicals are ubiquitous in everyday life. Environmental health practitioners rely on a complex web of regulators and policy bodies to ensure the protection of public health, yet few understand the full extent of this web. A lack of understanding can hamper public health response and impede policy development. In this paper we map the public health chemicals policy landscape in Australia and conclude that an understanding of this system is essential for effective environmental health responses and policy development.
There are over 39 000 chemicals on the world market today,1 with the potential for this number to increase significantly through new manufacturing techniques such as nano-technologies. These chemicals are widespread, occurring in everything from the food we eat, to the clothes we wear, to the cars we drive. The regulation of an item that permeates through every facet of our lives is by its nature complex. This complexity is difficult to navigate, particularly when public health practitioners are faced with an adverse health effect from a chemical product.2Knowledge of the range of
chemical regulators and policy bodies allows for proper engagement with the system.
In an attempt to prevent adverse health effects occurring governments produce policies designed to minimise the exposure of the population to chemicals. Environmental health practitioners are often called upon to design or review these policies for the protection of the public’s health, but without having a fundamental understanding of the regula-tors who can enact this protection it is difficult to ensure the policy developed will be effective and functional.
The following describes the complex web of regulators and policy makers in Australia that underpins the development of comprehensive, well-informed chemicals policy and appropriate practitioner response.
Making the chemical policy web
The current fragmented system of chemical regulation in Australia grew out of Australian federalism. In 1901 the Australian Constitution assigned a limited list of powers to the Commonwealth Government. The regulation of chemicals was not among them, leading to each state developing a unique approach to chemical issues and fragmenting chemical issues across different portfolios.3
The rise of the environmental movement in the 1960s and 1970s saw the establishment of the first state-based envi-ronmental protection agencies and national ministerial councils. Strong nationalisation of chemical policy issues in the form of targeted ministerial councils and national regulators only emerged in the 1990s out of the Hawke Government’s ‘New Federalism’ and attempts to develop national regulatory strategies through the Council of Australian Governments (COAG). This period saw the establishment of national regulators in agricultural and
ISSN 1034 7674
NSW PUBLIC HEALTH
BULLETIN
veterinary medicines, therapeutic goods, food, industrial chemicals, as well as various other agencies and ministerial councils. However, since much of the legislative power to implement and monitor controls rests with the states and territories, these agencies were limited in their ability to impose national uniformity of policy.
A third wave of reform began in 2005 with the then Prime Minister’s direction to reduce unnecessary regulatory bur-den on business.4COAG set about establishing a high-level taskforce to develop an integrated, national chemicals policy. The main aim of these reforms was to develop uniform regulation between states on chemical issues. These reforms are ongoing and while they are designed to develop uniformity within areas of chemical regulation (such as therapeutics), there is limited development of uniformity between areas of chemical regulation.
Current structure of chemicals policy
The current structure of public health chemicals policy in Australia remains highly fragmented with 12 distinct
segments (Figure 1). Some correspond to industrial sec-tors: therapeutic goods, agricultural and veterinary pro-ducts, food products and a general category of industrial chemicals. Others developed out of responses to distinct regulatory problems: defective products, exposure stan-dards, acute exposure, transportation of chemicals, land use planning, water, importation and public health policy.
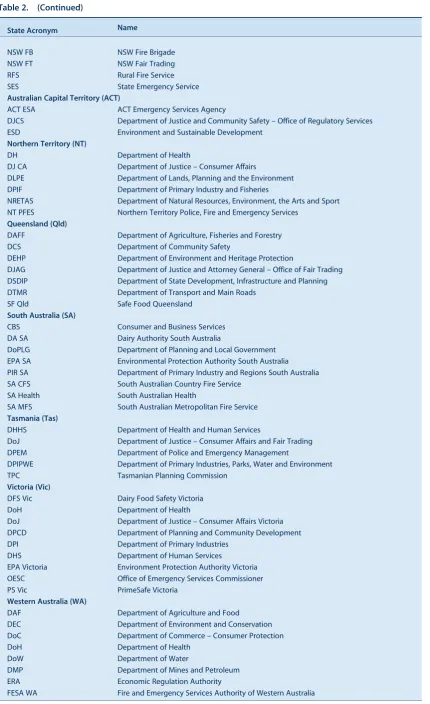
Tables 1a and 1b stratify 10 of these areas with their agencies and functions at federal and state level. Table 2 provides a list of acronyms used in this paper.
Chemicals policy in Australia has the Standing Committee on Chemicals (SCOC) at its centre (Figure 1). The SCOC consists of representatives from the various standing councils and federal government agencies. It heads a regulatory hierarchy in each segment led by a standing council of federal and state ministers, which works towards more uniform national policy responses.5These standing councils are generally supported by committees of senior state and federal bureaucrats and any federal government
SCOC
SCPEM /SCoH
SCEW SCoPI
CAF SCOTI LGFFR
SPF
SCoH AHMAC PS
NCCTG AHPPC NHEMS
enHealth
ACCS ACMS
SUSMP
NEPM WG
NChEM WG
CAANZ
PSCC FRSC
ISC PISC NASPT
TGA
DoHA
NICNAS/ DoHA
NEPC
NTC
ACCC
ACBPS/AQIS
FSANZ
APVMA
NSW EPA/DPI
NSW FA
NHMRC
NSW HEALTH
NSW PLANNING/
NSW EPA
LOCAL
GOVERNMENT
LOCAL
GOVERNMENT
LOCAL GOVERNMENT NSW
EPA
AGRICULTURAL ANDVETERINARYPRODUCTS
FOOD
PRODUCTS
DEFECTIVE PRODUCT
S
TRA
NS
POR
TATIO
N O
F
CH
EM
ICAL
S
INDUSTRIAL CHEMICALS
NSW EPA/NSW
WorkCover
Standing Council
State Regulator (NSW example) Federal Regulator
Local Government
Issue
ACU
TEEXP OSURE
TO CHEMICALS
CH
EM IC
AL
E XP
OS
U
RE
ST AN
DA
RD S A
ND G
U ID
E LIN
E S
W ATER
NS
W
EP A
AFP, A
CC, ACBPS
AND AQIS
PUBLICHEALTH CHEMICAL
POLICY
I
M PO
R
TA TIO
N O
F G
OO D
O R CH
EM IC
AL
THER
APEUTIC GOODS
NSW HEALTH
L
A
N
D
U
S
E
P
L
A
N
N
I
N
G
A
N
D
M A N
A
G
E
M
E
N
T
O
F
C
H
E
M
I
C
A
L
S
GOVE
RN
MENT LOCAL NSW H
ealth/SES/ RFS
MP
ES/Pol ice/NSW FB
/ NSWFAIR
TRADING
Figure 1. The web of government bodies responsible for public health chemicals regulation and policy in Australia.
See Table 2 for a list of acronyms used in this figure.
agencies with regulatory responsibility for the area of chemicals policy in question.
Segmented areas of chemicals regulation and policy
Therapeutic products, emergency management and public health chemical policy: the Standing Council on Health and the Therapeutic Goods Administration
The ministerial Standing Council on Health (SCoH) pro-vides overall leadership in the regulation of therapeutic goods and public health issues arising from chemicals (Figure 2), drawing advice from the Australian Health Ministers’ Advisory Council (AHMAC). For public health policy the AHMAC take advice from six key subcommit-tees, of which the Australian Health Protection Principal Committee (AHPPC) is the most important in terms of chemicals policy. The AHPPC includes federal and state Chief Medical/Health Officers, with representatives from other technical agencies, and provides advice and makes recommendations regarding environmental health policy and environmental threats and emergencies. It draws this advice from the Environmental Health Committee
(enHealth) and the National Health Emergency Manage-ment Subcommittee (NHEMS).
The National Coordinating Committee on Therapeutic Goods (NCCTG), a sub-committee of AHMAC, has overall responsibility for the Scheduling Policy Frame-work (SPF), a frameFrame-work that sets out the national system for applying access restrictions on all poisons (including therapeutics) that pose a potential risk to public health and safety.6 Chemicals are ‘scheduled’ according to the degree of risk and the level of control required to protect consumers. A chemical may be referred to one of two committees to determine at what level it is to be scheduled – the Advisory Committee on Medicines Scheduling (ACMS) and the Advisory Committee on
Chemicals Scheduling (ACCS). These committees
provide advice to the Commonwealth Parliamentary Secretary for Health and Ageing (PS) (or their delegate), who has the final decision regarding the scheduling of the chemical in question;7 this decision will be made after extensive public consultation. A record of this decision is included in the Standard for the Uniform Scheduling of Medicines and Poisons (SUSMP). Each state then
State and territory control NHMRC
Parliamentary Secretary for Health
and Ageing (or delegate)
Therapeutic Goods Administration (TGA)
Department of Health and Ageing
National Coordinating Committee on Therapeutic
Goods (NCCTG)
Advisory Committee on Medicines Scheduling (ACMS) Advisory
Committee on Chemicals Scheduling (ACCS)
Standard for the Uniform Scheduling of Medicines and Poisons (SUSMP) Minister for Health and Ageing
Standing Council on Health (SCoH)
Australian Health Ministers’ Advisory Council (AHMAC)
Australian Health Protection Principal Committee (AHPPC)
National Health Emergency Management Subcommittee
(NHEMS)
Environmental Health Committee
(enHealth)
Scheduling Policy Framework
Assessment and approval of drugs (Australian Register of
Therapeutic Goods)
Figure 2. Government bodies responsible for therapeutic goods and public health chemicals
in Australia.
develops its own regulations around purchasing, packag-ing, labelling and enforcement of the SUSMP.
Products for which therapeutic claims are made are regulated by the Therapeutic Goods Administration (TGA) and associated state government agencies. The TGA assesses therapeutic goods for listing or registration on the Australian Register of Therapeutic Goods (ARTG), undertakes monitoring activities, and provides technical and administrative support to those committees involved in the scheduling of chemicals.
Agricultural and veterinary products: the Standing Council on Primary Industries and the Australian Pesticides and Veterinary Medicines Authority
The regulation of agricultural and veterinary chemicals follows a similar model (Figure 3) with the ministerial Standing Council on Primary Industries (SCoPI) develop-ing policy and direction for the national regulator, the Australian Pesticides and Veterinary Medicines Authority (APVMA).
The SCoPI is supported by the Primary Industries Standing Committee (PISC). Sitting under the PISC is the National Agvet System Policy Taskforce (NASPT) which is tasked with developing a new national framework for the regula-tion of agricultural and veterinary chemicals.
The APVMA is the regulator responsible for the assess-ment and registration of agricultural and veterinary chemical products in Australia. Through the National Registration Scheme the APVMA registers and regulates the manufacture and supply of all pesticides and veterinary medicines used in Australia, up to the point of retail sale.
The APVMA also assesses agricultural and veterinary chemicals or products for potential impacts on human health, the environment, trade and efficacy.
The APVMA contracts the Office of Chemical Safety (OCS) in the Department of Health and Ageing to under-take public health assessments. As part of this assessment, the product may also be classified as a poison, at which point the product is referred to either the ACMS or ACCS for scheduling. The APVMA will set Maximum Residual Levels. These are the highest concentrations of agricultural and veterinary chemical residues permitted in food or animal feed and are set ensuring consumption of foods with these residues does not constitute an undue hazard to human health. The APVMA approves the labelling of a product. They also have the power to refuse an application if they are not satisfied that the product will not be harmful to human beings, and may also put conditions on its manufacture and supply.8The APVMA also run a Chemi-cal Review Program and an Adverse Experience Reporting Program.
The control of use of pesticides and veterinary medicines beyond the point of retail sale is the responsibility of state and territory governments (Table 1a).
Food products: the Legislative and Governance Forum on Food Regulation and Food Standards Australia New Zealand
The Legislative and Governance Forum on Food Regula-tion (LGFFR) is responsible for the development of do-mestic regulatory policies for food and the development of domestic policy guidelines for setting food standards (Figure 4).
Assessment and registration Policy
APVMA
State and territory legislation Primary Industries Standing Committee (PISC)
National Agvet System Policy Taskforce (NASPT)
Management of use
Standing Council on Primary Industries (SCoPI)
Figure 3. Government bodies responsible for agricultural and veterinary products
in Australia.
Agvet: agricultural and veterinary.
APVMA: Australian Pesticides and Veterinary Medicines Authority.
Under the LGFFR is the Food Regulation Standing Committee (FRSC) which is responsible for coordinating policy advice to the LGFFR.
Sitting below the FRSC is the Implementation Sub-Committee (ISC) which develops and supervises the im-plementation and enforcement of food regulations and standards across the jurisdictions.
Food Standards Australia New Zealand (FSANZ) is the national food regulator responsible for developing and maintaining the Food Standards Code and ensuring the protection of public health and safety around food issues. The Food Standards Code regulates the use of ingredients, the composition of some foods, and the presence of con-taminants from food contact materials and environmental sources. FSANZ is also responsible for the labelling of both packaged and unpackaged food. It sets maximum levels for chemicals in food, which includes incorporating pesticide Maximum Residual Levels set by APVMA into food law.
In developing or reviewing any food regulatory measures, FSANZ must have regard to any policy guidelines set by the LGFFR. The implementation and enforcement of the Foods Standards Code is the responsibility of the ISC, and state and local governments.
Defective products: Legislative and Governance Forum on Consumer Affairs and the Australian Competition and Consumer Commission
Policy direction around consumer protection stems from the Legislative and Governance Forum on Consumer Affairs (CAF), the ministerial council of federal and state ministers for consumer affairs (Figure 5). Under the CAF sits Consumer Affairs Australia New Zealand (CAANZ), consisting of heads of state and federal consumer affairs departments. In turn, the CAANZ receives policy advice from three advisory committees and the Product Safety Consultative Committee (PSCC). The PSCC provides
advice and recommendations on product safety specific policy, education and compliance matters. It also provides advice to the Australian Competition and Consumer Com-mission (ACCC) on proposed product safety regulations, bans, standards and responses to emerging issues.9
The ACCC is the national regulator of consumer products and administers the Commonwealth Competition and Consumer Act 2010. This Act sets out the Australian Consumer Law.
The powers that the ACCC has over product safety are of most relevance here. Under the Act the Assistant Treasurer has powers to recall or ban products that do not meet certain standards, are defective, or create an imminent risk of death, serious illness or serious injury. The ACCC can undertake assessments of the chemical hazards in products, which may be in conjunction with the National Industrial
Chemicals Notification and Assessment Scheme
(NICNAS).
The Australian Consumer Law is designed to create a consistent approach to the banning or recalling of products in Australia. As such, state and territory governments are limited in their approaches to recall or ban a product, which will occur at the national level. State and territories have the ability to impose interim bans and consult with the national regulator about product safety issues.
Legislative and Governance Forum on Consumer Affairs (CAF)
Consumer Affairs Australia New Zealand (CAANZ)
Product Safety Consultative Committee (PSCC) ACCC
Figure 5. Government bodies responsible for defective
products in Australia.
ACCC: Australian Competition and Consumer Commission.
Policy
Standard setting
Implementation
Food Regulation Standing Committee (FRSC) Legislative and Governance Forum on Food Regulation (LGFFR)
FSANZ
Implementation Sub-Committee (ISC)
Local council legislation State and territory
legislation
Figure 4. Government bodies responsible for food products in Australia.
Industrial chemicals: National Industrial Chemicals Notification and Assessment Scheme
Industrial chemicals has developed as a residual category. If a chemical does not fit into any other Australian regulatory scheme, it will fall under the Industrial Chemi-cals portfolio. As such, the Department of Health and Ageing, of which NICNAS is a part, has representation on the SCOC.
NICNAS is the Australian regulator of industrial cals. It undertakes assessment of all new industrial chemi-cals on the Australian market and is also considering the assessment of over 38 000 existing chemicals on the Australian Inventory of Chemical Substances, which may not have undergone assessment under modern guide-lines, through the Inventory Multi-tiered Assessment and Prioritisation Program.10NICNAS also provides advice to other agencies regarding individual chemical contamina-tion of products, and maintains strong links with the ACCC in this regard.
Although NICNAS has no authority to ban or phase out a chemical, it does have the power to prescribe conditions of use of a chemical which can be adopted and implemented through relevant state and territory legislation; it may also make recommendations to the PS for referral to the ACCS for inclusion of the chemical on the SUSMP.
Environmental health chemicals policy and chemical exposure standards: the Standing Council on Environment and Water and the National Environment Protection Council
The Standing Council on Environment and Water (SCEW) addresses broad national policy issues relating to environ-mental management and protection. Incorporated within the SCEW is the National Environment Protection Council
(NEPC), a statutory ministerial council that has the power to create National Environment Protection Measures (NEPMs). NEPMs are broad framework-setting statutory instruments that may consist of goals, standards, protocols and guidelines. They provide guidance on issues such as air and water quality, land contamination and hazardous waste. State and federal health agencies also have an active role in the development of NEPMs through enHealth which has membership on the various NEPM Working Groups (NEPM WG).11 State and territory governments have agreed to implement the NEPMs within their jurisdictions.
Importation regulation: Australian Quarantine and Inspection Service and Australian Customs and Border Protection Service
The Australian Quarantine and Inspection Service (AQIS) administer the Imported Food Inspection Scheme. Under this scheme, food is inspected according to the level of risk it may pose to the population as determined by FSANZ. Testing may include targeted hazardous contaminants, pesticides and antibiotics, microbiological contaminants, natural toxicants, metal contaminants and food additives.12 In addition to the routine testing of imported food, AQIS conducts survey testing of imported food. It receives this direction from the ISC.
The powers of the Australian Customs and Border Pro-tection Service (ACBPS) stem from the Commonwealth Customs Act 1901, the Commonwealth Customs Tariff Act 1995and related legislation. However, ACBPS also administers legislation on behalf of other government agencies. In terms of products inappropriately contaminat-ed with chemicals the ACBPS has the power to hold, seize, test and in certain circumstances recall products. This will often be undertaken in consultation with NICNAS, OCS, TGA, AQIS, APVMA, ACCC and the Australian Federal Police depending on the type of chemical or product (personal communication, D Hunt, 15 September 2010).
Additional Standing Councils relevant to chemicals regulation and policy
There are a number of other Standing Councils, regulators and policy bodies that deal with a range of issues relating to chemicals including water, transport, land use planning and acute exposure to chemicals and the emergency management of chemical-related incidents pertaining to them (Tables 1a and 1b) (Figure 1).
Conclusion
This paper describes the system of chemical regulators and government policy bodies responsible for protecting public health in Australia. Understanding this system should be paramount to any policy maker or public health
State and territory implementation
Standing Council on Environment and Water (SCEW)/ National Environment Protection Council (NEPC)
National Environment Protection Council Committee (NEPCC)
enHealth NEPM Working Groups
(NEPM WG)
NEPMs
Figure 6. Government bodies responsible for the
development of National Environment Protection Measures (NEPMs) in Australia.
enHealth: Environmental Health Committee.
worker in the area of chemical exposure as it is essential for effective environmental health responses and policy development, and will lead to greater efficacy in environ-mental health outcomes.
Acknowledgments
The authors gratefully acknowledge Dr Sarah Potter for her input.
References
1. National Industrial Chemicals Notification and Assessment Scheme. Existing Chemicals. Available at: http://www.nicnas. gov.au/Industry/Existing_Chemicals.asp (Cited 22 November 2012).
2. Capon A, Sheppeard V. Consumer product safety and chemical contamination.Public Health Bulletin SA2010; 7(1): 43–8. 3. Rae A. Federalism in the Regulation of Chemical Pollutants
in Australia.Prometheus2003; 21: 247–64. doi:10.1080/ 08109020308128
4. Regulation Taskforce. Rethinking Regulation: Report of the Taskforce on Reducing Regulatory Burdens on Business, Report to the Prime Minister and the Treasurer, Canberra. 2006. Available at: http://www.regulationtaskforce.gov.au/__data/ assets/pdf_file/0007/69721/regulation-taskforce.pdf (Cited 10 September 2012).
5. Department of Innovation Industry Science and Research. Standing Committee on Chemicals. 2010. Available at:
http://www.innovation.gov.au/INDUSTRY/
CHEMICALSANDPLASTICS/SCOC/Pages/default.aspx (Cited 10 September 2012).
6. National Coordinating Committee on Therapeutic Goods. Scheduling Policy Framework for Medicines and Chemicals. Available at: http://www.tga.gov.au/scheduling-policy-frame work.doc (Cited 10 September 2012).
7. Therapeutic Goods Administration. Advisory committees on medicines and chemicals scheduling. Available at:
http://www.tga.gov.au/about/committees-acmcs.htm (Cited 12 September 2012).
8. Productivity Commission. Chemicals and Plastics Regulation. Melbourne: Commonwealth of Australia; 2008.
9. Commonwealth of Australia. SCOCA Standing Advisory Committees and Consultative Committees – Structure and Operation. Commonwealth of Australia; 2009.
10. National Industrial Chemicals Notification and Assessment Scheme. Inventory Multi-tiered Assessment and Prioritisation. Available at: http://nicnas.gov.au/industry/existing_chemicals/ chemicals_On_AICS.asp (Cited 25 October 2012).
11. Department of Health and Ageing. Environmental Health Committee (enHealth). Available at: http://www.health.gov.au/ internet/main/publishing.nsf/Content/ohp-environ-enhealth-committee.htm (Cited 10 September 2012).
Table 1a. Areas of chemical regulation stratified by level of government in Australia Area Tier of government Industrial Chemicals Agricultural and V eterinary Products Therapeutic Goods F ood Products Chemical Exposure Standards Federal (Ministerial council) SCoPI S CoH L GFFR SCEW Federal (Ministerial council support body) PISC AHMAC FRSC NEPC NEPCC Federal (Minister responsible) Health & Ageing Agriculture, Fisheries & Forestry Health & Ageing H ealth & Ageing Federal (Secretariat) DoHA DAFF DoHA DoHA NEPCSC Federal (Main regulatory body and responsibility) NICNAS (DoHA) Assess industrial chemicals and cosmetics APVMA (Statutory Authority) Assess and register agricultural and veterinary chemicals and p roducts. Adverse Experience Reporting P rogram and product recall function TGA (DoHA) Assess and register medicines, ensuring quality, safety, efficacy and availability FSANZ (Statutory Authority) Develop a nd maintain Food Standards C ode. Assess chemicals in foods NEPC (Statutory Council) Develop N EPMs. A ssess and report on the effectiveness of NEPM implementation State (regulatory responsibility) Operationalise recommendations around industrial chemicals through poisons scheduling, environmental protection processes and in safety of consumer goods Control use of pesticides and veterinary medicines beyond the p oint of retail sale through legislative initiatives, codes of practice manuals, or standard operating procedures Determine p lace of purchase, packaging and labelling of drug or poison. State and territory governments classify the vast majority of drugs a nd poisons in accordance with the S USMP Investigate contaminated foods, enforce and interpret the Food Standards C ode Implement NEPMs State Regulators NSW NSW FT, NSW EPA, NSW H ealth NSW EPA/DPI NSW H ealth NSW FA NSW EPA ACT DJCS, ACT Health, ESD ESD ACT Health ACT Health ESD NT DJ CA, DH, NRETAS D PIF DH DH NRETAS Qld DJAG, Qld H ealth, D EHP DAFF, Qld H ealth Qld H ealth Qld H ealth, S F Q ld DEHP SA CBS, S A H ealth, EPA SA SA Health, PIR SA SA Health SA Health, P IR SA, DA SA EPA SA Tas DoJ, DHHS, DPIPWE D PIPWE DHHS DHHS, DPIPWE DPIPWE Vic DoJ, DoH, EPA V ictoria DPI DoH DoH, PS Vic, DFS Vic EPA Victoria WA DoC, DoH, DEC DAF, D oH DoH DoH D EC See Table 2 for a lis t o f acronyms used in this table .
Table 2. List of acronyms used in this paper
Federal Acronym Name
ACCS Advisory Committee on Chemicals Scheduling
ACMS Advisory Committee on Medicines Scheduling
ACC Australian Crime Commission
ACCC Australian Competition and Consumer Commission
ACBPS Australian Customs and Border Protection Service
AFP Australian Federal Police
AHMAC Australian Health Ministers’ Advisory Council
AHPPC Australian Health Protection Principal Committee
APVMA Australian Pesticides and Veterinary Medicines Authority
AQIS Australian Quarantine and Inspection Service
ARTG Australian Register of Therapeutic Goods
CAANZ Consumer Affairs Australia New Zealand
CAF Legislative and Governance Forum on Consumer Affairs
DAFF Department of Agriculture, Fisheries and Forestry
DoHA Department of Health and Ageing
DSEWPC Department of Sustainability, Environment, Water, Population and Communities
DTI Department of Transport and Infrastructure
enHealth Environmental Health Committee
FRSC Food Regulation Standing Committee
FSANZ Food Standards Australia New Zealand
IGC-ACC Inter-Governmental Committee of the Australian Crime Commission
ISC Implementation Sub-Committee
LGFFR Legislative and Governance Forum on Food Regulation
NASPT National Agvet System Policy Taskforce
NCCTG National Coordinating Committee on Therapeutic Goods
NChEM WG National Chemicals Environmental Management Working Group
NEPC National Environment Protection Council
NEPCC National Environment Protection Council Committee
NEPCSC National Environment Protection Council Service Corporation
NEPMs National Environment Protection Measures
NEPM WG National Environment Protection Measures Working Group
NHEMS National Health Emergency Management Subcommittee
NHMRC National Health and Medical Research Council
NICNAS National Industrial Chemicals Notification and Assessment Scheme
NTC National Transport Commission
OCS Office of Chemical Safety
PISC Primary Industries Standing Committee
PS Parliamentary Secretary for Health and Ageing
PSCC Product Safety Consultative Committee
SCOC Standing Committee on Chemicals
SCEW Standing Council on Environment and Water
SCoH Standing Council on Health
SCPEM Standing Council on Police and Emergency Management
SCoPI Standing Council on Primary Industries
SCOTI Standing Council on Transport and Infrastructure
SPF Scheduling Policy Framework
SUSMP Standard for the Uniform Scheduling of Medicines and Poisons
TGA Therapeutic Goods Administration
State Acronym Name New South Wales (NSW)
DPI Department of Primary Industries
MPES Ministry for Police and Emergency Services
NSW EPA NSW Environment Protection Authority
NSW FA NSW Food Authority
(Continued)
Table 2. (Continued)
State Acronym Name
NSW FB NSW Fire Brigade
NSW FT NSW Fair Trading
RFS Rural Fire Service
SES State Emergency Service
Australian Capital Territory (ACT)
ACT ESA ACT Emergency Services Agency
DJCS Department of Justice and Community Safety – Office of Regulatory Services
ESD Environment and Sustainable Development
Northern Territory (NT)
DH Department of Health
DJ CA Department of Justice – Consumer Affairs
DLPE Department of Lands, Planning and the Environment
DPIF Department of Primary Industry and Fisheries
NRETAS Department of Natural Resources, Environment, the Arts and Sport
NT PFES Northern Territory Police, Fire and Emergency Services
Queensland (Qld)
DAFF Department of Agriculture, Fisheries and Forestry
DCS Department of Community Safety
DEHP Department of Environment and Heritage Protection
DJAG Department of Justice and Attorney General – Office of Fair Trading
DSDIP Department of State Development, Infrastructure and Planning
DTMR Department of Transport and Main Roads
SF Qld Safe Food Queensland
South Australia (SA)
CBS Consumer and Business Services
DA SA Dairy Authority South Australia
DoPLG Department of Planning and Local Government
EPA SA Environmental Protection Authority South Australia
PIR SA Department of Primary Industry and Regions South Australia
SA CFS South Australian Country Fire Service
SA Health South Australian Health
SA MFS South Australian Metropolitan Fire Service
Tasmania (Tas)
DHHS Department of Health and Human Services
DoJ Department of Justice – Consumer Affairs and Fair Trading
DPEM Department of Police and Emergency Management
DPIPWE Department of Primary Industries, Parks, Water and Environment
TPC Tasmanian Planning Commission
Victoria (Vic)
DFS Vic Dairy Food Safety Victoria
DoH Department of Health
DoJ Department of Justice – Consumer Affairs Victoria
DPCD Department of Planning and Community Development
DPI Department of Primary Industries
DHS Department of Human Services
EPA Victoria Environment Protection Authority Victoria
OESC Office of Emergency Services Commissioner
PS Vic PrimeSafe Victoria
Western Australia (WA)
DAF Department of Agriculture and Food
DEC Department of Environment and Conservation
DoC Department of Commerce – Consumer Protection
DoH Department of Health
DoW Department of Water
DMP Department of Mines and Petroleum
ERA Economic Regulation Authority
Trends in notifiable blood lead levels
in NSW, 1998
–
2008
Evan J. Freeman
A,B,D, Siranda Torvaldsen
B,
Adam Capon
Cand Glenda L. Lawrence
BA
NSW Public Health Officer Training Program, NSW Ministry of Health
B
School of Public Health and Community Medicine, The University of New South Wales
C
Environmental Health Branch, Health Protection NSW D
Corresponding author. Email: [email protected]
Abstract: Aim:In the absence of published state-wide notification data, the aim of this study was to analyse trends in notifiable blood lead levels (hereafter referred to as lead poisoning) in NSW from 1998 to 2008, to help inform lead poisoning notification policy. Methods: NSW blood lead poisoning notification data for 1998–2008 were extracted from the Notifiable Diseases Database and analysed by age, gender and Area Health Service of residence. Results:There were 6000 lead poisoning notifications from 1998 to 2008, with an average annual notification rate of 11.8 per 100 000 population for 1998–2003. This rate declined to an average of 4.0 per 100 000 popula-tion in the period 2004–2008. Males accounted for 92% of notifications, and males aged 20–59 years had average notification rates between 20 and 27 per 100 000 population. Children aged 0–4 years had notification rates of 9.3 per 100 000 population in girls and 13.6 per 100 000 population in boys.Conclusion:Notification rates have fallen dramatically, however children aged 0–4 years and men are disproportionately represented in lead poisoning notifications.
Lead is a naturally occurring mineral found within the Earth’s crust in many parts of the world.1Lead poisoning occuring after exposure to lead has been of public health importance worldwide for centuries.2In 2009 the Austra-lian National Health and Medical Research Council made a public statement that there is no safe level of lead exposure,
and recommended that all Australians have blood lead levels less than 10mg/dL.3
The routes of lead exposure include ingestion, inhalation and skin contact. Once lead is absorbed into the blood-stream it spreads throughout the body, where it can affect the nervous, haematopoietic, endocrine, renal, skeletal and reproductive systems.1,4 The potential health outcomes from lead poisoning vary between individuals and are due to the route of exposure, the dose absorbed, the duration of exposure and the person’s age.1,3,4 Children and pregnant women are considered the most sensitive to lead exposure; children absorb 40–70% of ingested lead compared to 10–20% in adults,5 while women exposed before or during pregnancy transfer lead to the foetus via the placenta, and after pregnancy to the infant in breastmilk.3
Acute lead poisoning occurs at blood lead levels of 70mg/dL or higher, and is considered a clinical emergency.3 At these levels, signs and symptoms range from stomach pain and vomiting to encephalopathy and death. The long-term consequences of exposures in children include reduction in intellectual development even when blood lead levels are less than 10mg/dL.6 Treatment for lead poisoning is limited to the use of chelating agents that bind to lead in the blood and assist excretion in urine. Chelating agents can be used in adults with levels above 50mg/dL,7 whereas chelation in children with levels less than 45mg/dL does not improve long-term behavioural or cognitive outcomes.8 There is also concern that chelation therapy will redistribute lead to susceptible organs, including the brain, where it may be reabsorbed.9
Lead mining and smelter activities that cause lead-rich emissions to be blown into residential areas and deposited as dust in and around houses and gardens are the most common sources of contamination of human environ-ments.1In the past lead was used in applications including face powders, and for preserving wine,2 while more recently lead and lead alloys have been used in everyday products such as paint, car batteries and plastic coatings.3 In Australia, lead was added to petrol to improve engine combustion performance from the 1930s until 2002, despite public health concerns about lead exposure.10 The use of leaded petrol resulted in widespread contami-nation of dust and soil in urban and industrial areas, causing increased blood lead levels in people exposed, particularly children.11 Improved awareness about the
effects of lead and the introduction of legislation in Australia has resulted in the reduction and removal of lead from car fuels and paints.12,13
In New South Wales (NSW) active screening for lead poisoning has been conducted for children and for workers exposed to lead since the early 1990s. In December 2011, the mandatory notification of blood lead concentrations 15mg/dL or above was changed, under the NSW Public Health Act 1991*, to the lower level of 10mg/dL or above.14
The aim of this study was to describe trends in notifications of lead poisoning in NSW from 1998 to 2008 to help inform public health policy.
Methods
In NSW the notification of lead poisoning is mandatory for hospitals, clinicians and laboratories. Notifications are based on the results of a confirmatory venous blood sample to determine the lead concentration, which is measured in micrograms per decilitre (mg/dL). Between 1998 and 2008, a blood lead concentration of 15mg/dL or more was classified as lead poisoning and was notifiable to the then NSW Department of Health.15 Notified cases were then investigated by local public health units.16The investigat-ing public health unit staff entered demographic informa-tion and blood lead levels of the cases into the Notifiable Diseases Database (NDD), which was used for the collec-tion of notifiable disease case informacollec-tion in NSW until the implementation of the Notifiable Conditions Information Management System in 2010. Data from active surveil-lance programs conducted in occupational settings and child blood lead screening programs were included in routine NDD data. Active surveillance programs included blood lead screening in children in the north Lake Mac-quarie area from 1993 to 2006, and continuous surveillance in children in Broken Hill since 1991.
All notifications of lead poisoning in NSW for the period 1998–2008 were extracted from the NDD using the Health Outcomes Information Statistical Toolkit (HOIST). The data were analysed using SASÒ(version 9.1.3, SAS Insti-tute, Cary, NC, USA) and Microsoft Excel. Population estimates were obtained from the Australian Bureau of Statistics. Due to changes in Area Health Service bound-aries, area of residence was defined by the NSW Health pre-2005 (former) Area Health Services (n¼17).
As a major source of lead notifications ceased operation in 2003, analysis by time period was divided into time period 1 (1998–2003) and time period 2 (2004–2008). Data were analysed by gender, age group, (former) Area Health Service, blood lead concentration and occupation. Occu-pational variables were identified from a predetermined
list in the NDD; some of these served as a proxy for sources of lead exposure (e.g. lead smelter worker or miner).
Results
There were 6000 lead poisoning notifications in NSW for the period 1998–2008, with an average annual notification rate of 8.2 per 100 000 population. The highest annual notification rate was in 1998 (23.0 per 100 000 population, n¼1400). Notification rates declined each year, with the exception of 2000 (Figure 1).
Gender and age
Males accounted for 92% (n¼5538) of all notifications with a notification rate of 15.2 per 100 000 population for the period 1998–2008. The highest notification rate for males was 43.0 per 100 000 population in 1998; by 2004, annual notification rates in males had decreased to below 10.0 per 100 000 population (Figure 1). For females, the notification rate began at below 5.0 per 100 000 population in 1998 and steadily declined to below 1.0 per 100 000 population in 2008 (Figure 1).
People notified with lead poisoning between 1998 and 2008 ranged in age from 0 to 87 years. Men aged 25–34 had the highest notification rate of 27.1 per 100 000 population, while the lowest notification rates were in 10–14-year old boys and girls. The gender differences become more noticeable at 15 years of age (Figure 2). Seventy-eight percent of notifications (n¼4701) were observed in men aged 20–59 years, who had an annual notification rate of almost 70.0 per 100 000 population in 1998, which declined to 10.0 per 100 000 population in 2004.
The 0–4-year age group accounted for 9.3% of notifi-cations (n¼559), of which 60% were in boys. The notifi-cation rate in girls aged 0–4 years was 9.3 per 100 000 population, and for the same age group of boys, 13.6 per 100 000 population (Figure 2). The highest annual
50 45 40 35 30 25 20 15 10 5 0
1998 1999 2000 2001 2002 2003
Year of notification
Rate per 100
000 population
2004 2005 2006 2007 2008 Total Female Male
Figure 1. Annual lead poisoning notification rates per 100 000
notification rate for boys aged 0–4 years was 30.0 per 100 000 population in 1999.
Blood lead concentrations
Blood lead concentrations were recorded for 96.6% (n¼5795) of notifications. Forty-three percent (n¼2503) of blood lead concentrations were in the lowest notifiable range (15–19mg/dL), while 54% (n¼3011) were in the 20–49mg/dL range, 2% (n¼125) were in the 50–69mg/dL range, and 1% (n¼56) were 70mg/dL or above. Figure 3 shows a further breakdown of notification rates by year, stratified by blood lead concentrations, in men aged 20–59 years, and demon-strates the downward trend in notification rates of blood lead concentrations in all years except 2000.
Geographic distribution of notifications
Sixty-two percent (n¼3732) of lead poisoning notifica-tions were in locanotifica-tions outside of Sydney. The highest notification rates in 1998–2003 were 227.4 per 100 000 population in the former Far West Area Health Service, and 52.1 per 100 000 population in the former Hunter Area Health Service (Table 1). Over the period of analysis, lead poisoning notifications declined by 50% or greater in most Area Health Services: the former Macquarie Area Health Service increased by 230%, and the former Mid West Area Health Service increased by 39% (Table 1). From 1998 to 2008, 68.9% of lead poisoning notifications in children aged 0–4 years were in the former Far West Area Health Service which had a notification rate of 104.5 per 10 000 population. The former Hunter Area Health Service accounted for 14% (1.9 per 10 000 population), while 12.3% of notifica-tions in the 0–4-year age group were from Sydney (0.24 per 10 000 population).
Occupation
Occupational information was recorded for 37% of all adult notifications. Women had occupation recorded in 10% (n¼29) of cases, while 40% of men had occupa-tion recorded. Occupaoccupa-tions with the highest proporoccupa-tions of notifications were lead smelter employees (37%; n¼735) and miners (23%; n¼453). For the period 1998–2002 (with the exception of 1999), smelter work-ers had the highest frequency of notifications, after which (with the exception of 2005) miners had the highest number of notifications (Figure 4). Other occu-pational categories identified with high notification rates included contractors (13%) and factory workers (10%).
9.3
1.0
0.1 0.2 0.7 0.8 1.1 0.8 0.9 0.8 0.9 0.6 0.2 0.2 13.6
1.8 0.5
5.6 21.0
27.1 27.1 26.7 25.2
20.6 20.1
15.1
10.1
3.0
0 5.0 10.0 15.0 20.0 25.0 30.0
0–4 5–9 10–14 15–19 20–24 25–29 30–34 35–39 40–44 45–49 50–54 55–59 60–64 65⫹ Female
Male
Rate per 100
000 population
Age group (years)
Figure 2. Average annual lead poisoning notification rates per 100 000 population, for males and
females and by age group, NSW, 1998–2008.
Source: Notifiable Diseases Database (since 2010, the Notifiable Conditions Information Management System), NSW Ministry of Health.
0 5 10 15 20 25 30
1998 1999 2000 2001 2002 2003 2004 2005 2006 2007 2008
Rate per 100
000 population
Year of notification
15–19 µg/dL 20–24 µg/dL
25–29 µg/dL 30–34 µg/dL
Figure 3. Annual lead poisoning notification rates per 100 000
population for four blood lead concentrations, in men aged 20–59 years, NSW, 1998–2008.
Source: Notifiable Diseases Database (since 2010, the Notifiable Conditions Information Management System), NSW Ministry of Health.
Discussion
There was a 70% reduction in lead poisoning notifications in NSW from 1998 to 2008, with fewer than 250 notifica-tions each year since 2004. Men of working age and children aged 0–4 years are disproportionately represented
in lead poisoning notifications, with rates among men more than three times higher than among women. Populations in the former Far West, Hunter and Macquarie Area Health Services of NSW had the highest notification rates for lead poisoning.
The interpretation of this study is limited by data quality, with more than half of adult cases missing occupational data. Because the source of lead exposure was not avail-able, occupation was used as a proxy for the source of exposure. In future, a review of case files from lead poisoning investigations and the recent inclusion of a variable for exposure site in the new notification data management system will help describe sources, without the need to use proxies. There is also likely to be a selection bias due to active surveillance programs, and greater awareness of public health practitioners in geographical areas, age groups and occupations at high risk. Screening has been important for understanding the epidemiology of lead exposure, because the acute symptoms of lead poisoning are not present at lower blood lead concentra-tions.1,3However, the likely selection bias for children and men means that women will tend to be under-represented in notification data. The reporting of more robust
0 50 100 150 200 250
1998 1999 2000 2001 2002 2003 2004 2005 2006 2007 2008
Notifications
Year of notification
Smelter worker Miner
Figure 4. Annual notifications of lead poisoning in lead
smelter workers and miners, NSW, 1998–2008.
Source: Notifiable Diseases Database (since 2010, the Notifiable Conditions Information Management System), NSW Ministry of Health.
Table 1. Average annual lead poisoning notifications and rates per 100 000 population, in NSW, by former Area Health Service
(AHS), categorised by two time periods (TP1: 1998]2003 and TP2: 2004]2008) and the percentage reduction in notifications
between time periods
1998]2003 2004]2008
Area Health Service of residence
n Rate % Male n Rate % Male Total % change
TP 1]TP 2
Central Coast 70 4.0 87 26 1.7 100 96 -63
Central Sydney 240 8.2 84 70 2.7 90 310 -71
Far West 664 227.4 76 80 35.4 63 744 -89
Greater Murray 42 2.7 95 27 2.0 89 69 -36
Hunter 1713 52.1 96 224 7.7 94 1937 -87
Illawarra 197 9.3 98 58 3.1 97 255 -71
Macquarie 72 11.5 99 240 46.4 96 312 þ230
Mid North Coast 35 2.2 91 9 0.6 78 44 -74
Mid West 33 3.2 94 46 5.3 87 79 þ39
New England 45 4.2 96 13 1.5 100 58 -71
Northern Rivers 57 3.6 86 30 2.1 77 87 -47
Northern Sydney 129 2.8 92 48 1.2 98 177 -63
South Eastern Sydney 153 3.3 90 79 2.0 97 232 -48
South Western Sydney 578 12.3 97 172 4.2 99 750 -70
Southern 27 2.4 93 22 2.1 95 49 -19
Wentworth 126 6.7 94 62 3.9 94 188 -51
Western Sydney 432 10.3 96 144 3.8 94 576 -67
Overseas 1 – 100 1 – 100 2 –
Not stated 12 – 83 23 – 96 35 –
Total 4626 11.8 92 1374 4 93 6000 -70
information about testing, including the reason for testing (i.e. occupational vs. childhood screening or clinical sus-picion) would help clarify the extent of this selection bias.
Notification rates of lead poisoning in NSW have been linked to occupational activities. For more than 100 years, mining and, formerly, smelting, have occurred in Broken Hill (former Far West Area Health Service),17and smelt-ing has occurred in the north Lake Macquarie area (former Hunter Area Health Service).18There are marked differ-ences in the ages of notified cases in these two locations. In the former Hunter Area Health Service, 90% of cases were in adults aged 20–59 years, whilst in the former Far West Area Health Service, children aged 0–4 years accounted for 52% (n¼385) of notified cases. In comparison, the former Hunter Area Health Service had 4% (n¼78) of notifications in the 0–4-year age group. An explanation for this difference is the location of Broken Hill city, which is in the immediate vicinity of the active mine site with above ground historical waste disposal, and regional soils that have natural lead deposits. These sources produce ongoing exposure from lead-laden dust in and around houses where children play.19
Occupational exposures are also likely to account for the differences in notification rates between men and women which became more evident from the age of 15 years. In the former Hunter Area Health Service, lead poisoning notifications reduced following the closure of the Lake Macquarie smelter in 2003.20Increased lead mining activ-ity in the former Macquarie Area Health Service (Cobar) since 200321 has resulted in miners being the most fre-quently notified occupation. Other occupations and hob-bies that have been associated with lead exposures include battery making and recycling, soldering, stained glass manufacture and lead-based paint abatement.3,22
Since 1991 the blood lead screening of children in Broken Hill has underpinned education and risk reduction inter-ventions provided to individuals and their families.23,24 These interventions resulted in almost 75% of children aged 1–4 years recording blood lead levels below 10mg/dL by 2007.25In the north Lake Macquarie area, the positive influence of public health action allowed active surveil-lance to stop after mean blood lead levels in children decreased to less than 5mg/dL in 2006,183 years after the closure of the smelter.
From December 2011, the notifiable blood lead level in NSW has been reduced to 10mg/dL in line with the current National Health and Medical Research Council recommendation.3A review conducted by the Centers for Disease Control and Prevention in the United States concluded that there is sufficient evidence for adverse health effects in children and adults at blood lead concen-trations below 5mg/dL.26Both of these recommendations
have implications for public health policy and practice in NSW.
Conclusion
Active surveillance practices for lead poisoning in NSW have enhanced our knowledge of this condition, particu-larly in the former Hunter and Far West Area Health Services. Encouragingly, a large reduction in notifications and the concentrations of blood lead samples was observed from 1998 to 2008. Despite these reductions, there remains an over-representation of children and miners in more recent years of analysis. Importantly, these findings sup-port ongoing primary prevention, improved surveillance measures and the mandatory notification of lead poisoning, which remain essential to addressing lead poisoning in NSW.
Acknowledgment
This work was completed while Evan Freeman was an employee of the NSW Public Health Officer Training Program, funded by the NSW Ministry of Health. He undertook this work while based at the Environmental Health Branch, Health Protection NSW.
References
1. Agency for Toxic Substances and Disease Registry (ATSDR). Toxicological Profile for Lead. U.S. Department of Health and Human Services: Agency for Toxic Substances and Disease Registry. October 2007. Available at: http://www.atsdr.cdc.gov/ ToxProfiles/tp13.pdf (Cited 4 February 2013).
2. Lewis J, editor. Lead poisoning: a historical perspective. United States Environment Protection Agency; 1985. Available at: http://www.epa.gov/aboutepa/history/topics/perspect/lead.html (Cited 4 February 2013).
3. National Health and Medical Research Council. Information Paper. Blood lead levels for Australians. August 2009. Available at: http://www.nhmrc.gov.au/_files_nhmrc/publications/ attachments/gp2-lead-info-paper.pdf (Cited 4 February 2013).
4. Health Protection Agency (HPA). Lead. Toxicological Over-view. United Kingdom 2007. Available at: http://www.hpa.org. uk/webc/HPAwebFile/HPAweb_C/1194947332124 (Cited 5 February 2013).
5. Gracia RC, Snodgrass W. Lead toxicity and chelation therapy.
Am J Health Syst Pharm2007; 64(1): 45–53. doi:10.2146/
ajhp060175
6. Needleman HL, Gunnoe C, Leviton A. Deficits in psychologic and classroom performance of children with elevated dentine lead levels.N Engl J Med1979; 300: 689–95. doi:10.1056/ NEJM197903293001301
7. Association of Occupational and Environmental Clinics (AOEC). Medical management guidelines for lead-exposed adults. Revised 24 April 2007. Available at: www.aoec. org/documents/positions/MMG_FINAL.pdf (Cited 2 February 2013).
8. Dietrich KN, Ware JH, Salganik M, Radcliffe J, Rogan WJ, Rhoads GG et al. Effect of chelation therapy on the neuro-psychological and behavioral development of lead-exposed children after school entry.Pediatrics2004; 114(1): 19–26.
doi:10.1542/peds.114.1.19
9. Goyer RA, Cherian MG, Jones MM, Reigart JR. Role of chelating agents for prevention, intervention, and treatment of exposures to toxic metals.Environ Health Perspect1995; 103(11): 1048–52. doi:10.1289/ehp.951031048
10. Markowitz G, Rosner D. ‘‘Cater to the children’’: the role of the lead industry in a public health tragedy, 1900–1955.Am J Public
Health2000; 90(1): 36–46. doi:10.2105/AJPH.90.1.36
11. Gulson B, Mizon K, Taylor A, Korsch M, Stauber J, Davis JM et al. Changes in manganese and lead in the environment and young children associated with the introduction of methyl-cyclopentadienyl manganese tricarbonyl in gasoline – preliminary results.Environ Res2006; 100(1): 100–14.
doi:10.1016/j.envres.2005.03.013
12. Australian Government. National phase out of leaded petrol. Available at: http://www.environment.gov.au/atmosphere/ airquality/publications/qa.html (Cited 2 February 2013).
13. Taylor MP, Schniering CA, Lanphear BP, Jones AL. Lessons learned on lead poisoning in children: one-hundred years on from Turner’s declaration.J Paediatr Child Health2011; 47(12): 849–56. doi:10.1111/j.1440-1754.2010.01777.x
14. NSW Government. Public Health Amendment (Notifiable Lead Level) Regulation 2011 under the Public Health Act 1991. Available at: http://www.legislation.nsw.gov.au/sessionalview/ sessional/sr/2011-672.pdf (Cited 4 February 2013).
15. Communicable Diseases Branch. Lead poisoning. Notifiable Diseases Manual. Sydney: NSW Department of Health; 2002.
16. Birdsey R. The Lead Reference Centre.N S W Public Health Bull 1997; 8(11–12): 89–90. doi:10.1071/NB97034
17. NSW Department of Environment and Heritage. Broken Hill Complex – regional history. Available at: http://www.environment. nsw.gov.au/bioregions/BrokenHillComplex-RegionalHistory. htm (Cited 4 February 2013).
18. Hunter New England Area Health Service. Environmental Health Centre Annual Report 2005–2006. Sydney: NSW Health; 2006.
19. Boreland F, Lesjak M, Lyle D. Evaluation of home lead remediation in an Australian mining community.Sci Total
Environ2009; 408(2): 202–8. doi:10.1016/
j.scitotenv.2009.10.013
20. Hunter New England Population Health. Community Informa-tion Paper. North Lake Macquarie Blood Lead Monitoring Service. Summary of Results (July 2005–June 2006). Available at: http://www.hnehealth.nsw.gov.au/__data/assets/pdf_file/ 0012/62022/EHCBloodLeadTesting2006.pdf (Cited 4 February 2013).
21. CBH Resources Limited. Company profile 2010. Available at: http://www.cbhresources.com.au/operations/endeavor-mine. htm (Cited 1 November 2011).
22. Landrigan PJ, Todd AC. Lead poisoning.West J Med1994; 161(2): 153–9.
23. Kardamanidis K, Lyle D, Boreland F. Addressing decreasing blood lead screening rates in young children in Broken Hill,
NSW.N S W Public Health Bull2008; 19(9–10): 180–2.
doi:10.1071/NB08040
24. Boreland F, Lesjak M, Lyle D. Managing environmental lead in Broken Hill: a public health success.N S W Public Health Bull 2008; 19(9–10): 174–9. doi:10.1071/NB07099
25. Population Health Division. The health of the people of New South Wales – Report of the Chief Health Officer, 2008. Sydney: NSW Department of Health; 2008.
26. Centers for Disease Control and Prevention. Low lead level exposure harms children: a renewed call for primary
prevention – Report of the Advisory Committee on Childhood Lead Poisoning Prevention. 4 January 2012. Available at: http:// www.cdc.gov/nceh/lead/ACCLPP/Final_Document_011212. pdf (Cited 4 February 2013).
*ThePublic Health Act 2010(NSW) (http://www.health.nsw.gov.au/phact/)
ThePublic Health Act 2010(NSW) was passed by the NSW Parliament in December 2010 and commenced on 1 September 2012. The Public Health
Regulation 2012 was approved in July 2012 and commenced, along with thePublic Health Act 2010(NSW), on 1 September 2012. The objectives of
the Regulation are to support the smooth operation of the Act. The Act carries over many of the provisions of thePublic Health Act 1991(NSW) while
Improving participation by Aboriginal
children in blood lead screening
services in Broken Hill, NSW
Susan L. Thomas
A,C, Frances Boreland
Band David M. Lyle
BA
NSW Public Health Officer Training Program, NSW Ministry of Health
B
Broken Hill University Department of Rural Health, The University of Sydney
C
Corresponding author: Email: [email protected]
Abstract:Lead poses a health risk to young chil-dren with detrimental effects on their intellectual development. Attendance rates for Aboriginal children at routine blood lead screening and at follow-up appointments in Broken Hill, NSW, have declined in recent years. This study sought to identify strategies to improve the participation of Aboriginal children aged 1–4 years in blood lead screening services in Broken Hill.Methods: Atten-dance rates during the period 2000–2010 were determined using the Broken Hill Lead Manage-ment database. From June to August 2011, Aborigi-nal community members, service providers and public health staff were invited to interviews and focus groups to explore barriers, enablers and sug-gestions for improving participation. Results: In 2009, 27% of Aboriginal children aged 1–4 years attended blood lead screening and 29% of these children with blood lead levels over 15mg/dL attended follow-up appointments. Barriers to par-ticipation in lead screening services included com-munity perceptions, reduced service capacity, socio-economic and interorganisational factors. Enablers included using a culturally acceptable model, linking lead screening with routine health checks and using the finger-prick method of testing. Conclusions:The final report for the study included recommendations to improve participation rates of Aboriginal children including using social market-ing, formalising collaboration between health services, supporting disadvantaged families and employing an Aboriginal Health Worker.
Exposure to lead poses a health risk particularly to young children with detrimental effects on their intellectual development.1 The mining town of Broken Hill, New South Wales (NSW), was built around one of the world’s largest silver-lead-zinc ore deposits and has been mined continuously since 1884. In 1991 a survey of pre-school aged children in Broken Hill found lead was a significant public health issue; a state government-funded Lead Man-agement Program was established in 1994 to reduce blood lead levels in children aged 1–4 years.2The program which included blood lead screening began as an adequately resourced, stand-alone service until 2001, when it was integrated into existing child health services and its dedi-cated funding finished at the end of 2006. Services are currently offered by the Broken Hill Child and Family Health Services and Maari Ma Health Aboriginal Corpora-tion (Maari Ma). In 2004, 80% of Aboriginal children attended screening services. After 2004 attendance rates for Aboriginal children began declining and reached a low of 27% in 2009, below that of the general population (37%).3
There is no known threshold defining ‘safe’ levels of exposure to lead, but the National Health and Medical Research Council currently recommends interventions at a community level when appreciable numbers of children have blood lead levels exceeding 10mg/dL.1Forty percent of Aboriginal children aged 1–4 years screened in 2010 were above 10mg/dL.3 Blood lead levels 15mg/dL and above are notifiable to NSW Health.* In 2010, 21% of Aboriginal children screened had blood lead levels requir-ing notification.3Aboriginal people continue to experience socio-economic disadvantage which places them at greater risk of exposure to behavioural and environmental health risk factors,4and this should be taken into consideration in the planning and provision of relevant services.
In 2011, we undertook a study to gain a better understand-ing of the decline in screenunderstand-ing rates in Aboriginal children aged 1–4 years and to identify strategies to improve their participation in blood lead screening services in Broken Hill. The study was undertaken on behalf of the Far West Local Health District.
*In December 2011, the mandatory notification level changed to 10mg/dL or
above.
Methods
The study took place in two phases. The first involved reviewing data from the Broken Hill Lead Management Program, set up as part of the original lead program to record children’s test results. The second phase used qualitative methods to explore emerging themes.5 Semi-structured interviews and focus groups with Aboriginal parents and carers of young children, service providers and public health staff were used to gain a better under-standing of:
• the perceptions of the health risks of lead for children • the reason for the downward trend in Aboriginal
children’s attendance at screening programs
• how these declining attendance rates might be improved.
Broken Hill Lead Management database
De-identified data from the Broken Hill Lead Management database from 2000 to 2010 were reviewed. Records for Aboriginal children aged 1–4 years of age were extracted. Duplicates and those with missing blood lead values were excluded, leaving a data set of 864. Attendance rates for annual screening were calculated for children recorded as having attended blood lead screening at least once in a calendar year. Australian Bureau of Statistics Census data for 2001 and 2006 were used to calculate screening rates.6 Attendance rates for follow-up visits by children whose blood lead levels were 15mg/dL and above from 2004 to 2010 were also calculated.
Lead Health Program Testing Schedule
Attendance at follow-up appointments was measured against the protocol outlined in the Lead Health Program Testing Schedule and Interventions (available on request from Broken Hill Child and Family Health Services). Children were grouped according to whether or not their follow-up visits were in accordance with recommendations in the protocol. Children with a blood lead level between 11 and 20mg/dL are requested to return at 6-month intervals for follow-up testing. Children with levels between 21 and 39mg/dL are requested to return at 3-month intervals and those with levels 40–49mg/dL at 1-month intervals. Case management including education and home assessment to
identify the pathway of lead ingestion is offered to all families of children with blood lead levels over 10mg/dL.
Interviews and focus groups
Participants with a range of relevant experience, skills and knowledge were invited to interviews and focus groups (Table 1). Aboriginal parents or carers of young children were invited to informal interviews at an Aboriginal pre-school and an Aboriginal playgroup. Interviews were conducted while participants were involved in the routine functions of the centre (e.g. playing with children, helping with morning tea). Service managers were invited to individual interviews in order to explore planning and management strategies. Two interviews were conducted at their place of work and one was by telephone. Three focus groups were conducted with health professionals to facilitate discussion and the exchange of ideas and to reflect on blood lead screening services for Aboriginal families. Participants included lead screening staff, a health promotion officer, an early childhood health nurse, a practice nurse, research staff and an epidemiologist.
Interviews with community members lasted approximately 10 minutes while other interviews and focus groups were 40–60 minutes. Informed consent was obtained from all participants. Confidentiality and privacy were ensured as contributions used in the report were de-identified. Inter-views were sound recorded (with the exception of inter-views with community members where written records were taken), transcribed, and analysed manually to identify barriers, enablers and strategies. The study investigators verified the resultant material.
Ethics approval was obtained from the former Greater Western Area Health Service Human Research Ethics Committee (HREC /11/GWAHS/4) and from the Aborigi-nal Health and Medical Research Council of NSW (AHMRC, 771/11).
Results
Attendance rates at blood lead screening services for Aboriginal children aged 1–4 years increased steadily from 55% in 2000 to 80% in 2004. From 2005 attendance rates gradually declined and reached a low of 27% in 2009. The screening rate began to improve in 2010, increasing to 39% (Table 2).
Table 1. Number and type of participants in interviews and focus groups undertaken in Broken Hill, NSW, 2011
Interviews
n Focus groupsn Focus group participantsn
Community members 15 0 0
Broken Hill Child and Family Health Services 1 1 4
Maari Ma Health Aboriginal Corporation 2 1 4
Broken Hill University Department of Rural Health 0 1 3
Follow-up rates for Aboriginal children aged 1–4 years whose blood lead levels were 15mg/dL and above have declined from 2004 when 79% attended follow-up appointments. In 2009, 29% returned for follow-up and in 2010, 33% returned (Table 3).
The findings from the interviews and focus groups were grouped into common themes to identify why Aboriginal children’s attendance at screening programs was declining and how attendance might be improved: barriers, enablers and strategies.
Barriers
Community members generally agreed that health risks and the importance of screening were not well promoted. Many participants recalled risks related to learning and intellectual development but had forgotten health
messages about ways to reduce the risk of lead ingestion. Many referred to the fact that there was no practical or financial help for affected families to act on recommenda-tions by health staff (e.g. fixing cracks in ceilings, planting grass over dirt yards) and that this lack of support was a significant barrier to attending screening services. Some community members commented that there were other more important priorities for many families.
Service providers described barriers related to service capacity and funding for key positions. Most agreed that community perceptions were a significant factor in pre-venting uptake of health services for Aboriginal children:
People don’t see lead as a health issue anymore because we’re not telling them it’s a health issue. (Focus group)
There was an Aboriginal Health Worker that worked with our program. That was a fantastic way to identify and communicate the lead problem with the Aboriginal community. Unfortunately that position no longer exists.(Focus group)
There was wide agreement among service providers that socio-economic barriers needed to be acknowledged and were factors contributing to the decline in attendance at screening services. Service providers commented that families felt there was nothing that could be done to help them if their child had elevated blood lead levels:
y..[families with limited resources are] living in rental houses, landlords are not going to plant lawn, they’re not going to clean the ceilings out, they’re not going to help them so there is aythis is the best I can doyI can keep my kids’ hands clean, I can keep my house clean, but when you’re living in a house and the dust is coming through the roof, the dust storms are coming through the house, how do you do it?(Focus group)
Service providers also discussed gaps in communication between health services, including no formal meetings to share information or discuss issues related to declining attendance rates and strategies. Some service providers and managers were not aware of information available from the Lead Management database. That services did not share case management of Aboriginal children with high lead levels or do joint home visits were raised as issues for Aboriginal families.
Enablers
Many community members recalled the special lead screening days held at Maari Ma and felt that these encouraged families to come for their children’s screening. They also felt that using the finger-prick testing method and assisting with transport to the centre encouraged the community to bring their children for screening.
Table 3. Number and percentage of Aboriginal children aged
1]4 years with blood lead levels 15lg/dL or more who attended
follow-up appointments in Broken Hill, NSW, 2004]2010
Year Blood lead
level$15lg/dL n
Follow-up attendance
n
Percentage followed-up
%
2004 33 26 79
2005 22 11 50
2006 20 8 40
2007 19 9 47
2008 12 5 42
2009 7 2 29
2010* 12 4 33
*2010 contains some missing data for follow-up due in 2011 Source: Broken Hill Lead Management database.
Table 2. Number and estimated percentage of Aboriginal
children aged 1]4 years, screened at least once for blood lead levels in Broken Hill, NSW, 2000]2010
Year Aboriginal
children screened n
Estimated Aboriginal population
n
%
2000 75 137 55
2001 85 137 62
2002 96 137 70
2003 98 137 72
2004 110 137 80
2005 97 137 71
2006 71 144 49
2007 81 144 56
2008 56 144 39
2009 39 144 27
2010 56 144 39
Sources: Broken Hill Lead Management database; 2001 and 2006 Australian Bureau of Statistics Census data.