Vol. 3, No. 1, pp. 69-80, Jan (2020)
Effect of Different Representations of Wind
Turbines on the SSR Analysis in the Double Cage
Induction Generator Based Wind Farm
Mohammad Kazem Salehi1
1and Roohalamin Zeinali Davarani
2,†1,2 Department of Electrical Engineering, Faculty of Electrical and Computer Engineering, Graduate University of
Advanced Technology, Kerman, Iran
In this paper different representations of a wind farm based on double-cage induction generators connected to a series-compensated line is studied and their effect on the Subsynchronous Resonance (SSR) is analyzed. For this purpose, three representation types of wind turbines in SSR studies of the wind farm are considered as 1) Single Turbine Representation (STR), 2) Multiple Turbine Representation (MTR), and 3) Full Turbine Representation (FTR). To select the acceptable representation of the wind farm in SSR analysis, the wind farm is modeled by three representation and the test system eigenvalues are obtained for different conditions of the power system and the results are compared together. For this purpose, three scenarios are considered. In the first and second scenarios, all of the Wind Turbine Generators (WTGs) have identical electrical and mechanical parameters but WTGs in the third scenario are different. In the first scenario, all wind turbines are subjected to the same wind speed, and in the second and third scenarios, each group of wind turbines is subjected to the same wind speed. In addition, the analytical results are validated by electromagnetic transient simulation using PSCAD/EMTDC software.
Article Info
Keywords:
Double cage induction generator,
Sub-synchronous resonance, Wind power plant, Wind turbine representation
Article History: Received 2018-12-02
Accepted 2019-05-17
I.
I
NTRODUCTIONWorldwide, the installed capacity of wind power plants is increasing rapidly. Technological advancements, design improvements, and costs reduction have played a significant role in increasing wind farms penetration levels in power system [1]. Many countries are going to generate 20% of their energy from renewable energy sources until 2020, which wind energy is recognized as the prime renewable source [2], [3]. The large power plants connecting to transmission and distribution networks have several basic problems [4-7]. Large wind farms are typically located in remote areas with a good wind pattern, which causes the
construction of long transmission line and consequently reduces transmission power [8], [9]. Different methods have been proposed to overcome this problem. One of these ways is the need for installing the new transmission lines, which isn’t generally economic. Using the series compensation based series capacitors is another method, which enhances the power transfer capability with the existing transmission lines. Hence, it is being increasingly considered for large wind power plants [10-13]. Furthermore, using the series capacitors in the power network lines near to wind plants may also potentially cause SSR in the wind turbine induction generators [14]. In order to model the wind farm to study the dynamic behavior of the power system, a large number of papers have used the aggregated equivalent model [5], [11], [15], [16]. However, modeling the large number of Induction Generators (IGs) in a wind farm by a single equivalent IG may not be accurate, but papers that have analyzed the SSR
†Corresponding Author: [email protected]
Tel: +98-3431623445, Fax: +98-3431623445
Faculty of Electrical and Computer Engineering, Graduate University of Advanced Technology, Kerman, Iran
A
B
S
T
R
A
C
in the wind farms have considered only the aggregated model for wind farms [10], [11], [18-28]. In addition, in the previous studies, it was assumed that all wind farms are connected at the same collector bus (an aggregated wind farm connected to a series compensated transmission line) [29-32]. In [33], to reduce the interaction between DFIG controllers and series capacitor a control criteria is explored. In [34], to investigate the effect of random wind speed on SSR analysis of DFIG a probabilistic method is proposed to assess the probabilistic stability of SSR. In [35], the authors review the articles related to the SSR analysis in the wind farm.
In this paper for different representations of wind turbines a comprehensive analysis of SSR potential in the DCIG based wind farm connected to a series compensated line is presented and the results are compared with each other. Furthermore, this paper present the potential of SSR in a realistic wind farm split into different clusters connected by cables and connected to a series-compensated line. For this purpose, Single Turbine Representation (STR), Multiple
Turbine Representation (MTR) and Full Turbine
Representation (FTR) are considered to modeling the wind turbines in SSR analysis of DCIGs. In STR, the wind farm is modeled by only a single wind turbine. In MTR, based on the wind turbines characteristics and received wind speed the wind farm is modeled by multi-wind turbines. In FTR, all of the wind turbines are separately considered in the modeling of the wind farm. To study the effect of wind farm representation on SSR phenomenon the eigenvalue analysis is carried out by the linear modal method through MATLAB software, which is validated with electromagnetic transient simulation studies using PSCAD/EMTDC. The paper is organized as follow:
The effect of series compensated transmission lines on power system stability is studied in section II. In section III the modeling of a wind farm based DCIG connected to a series compensated transmission line is presented. The obtained results from SSR analysis for different wind turbine representation are shown in section IV. Time domain simulation results are presented in Section V. Finally, Section VI concludes the paper.
II.
E
FFECT OFS
ERIESC
OMPENSATEDT
RANSMISSIONL
INES ONP
OWERS
YSTEMS
TABILITYThe power system with series compensated transmission lines can be faced with Subsynchronous Resonance (SSR). The SSR phenomenon may affect the stability of the power system by i) Self-excitation due to induction generator effect (also called IGE) ii) Subsynchronous Torsional Interaction (also called SSTI), and iii) Transient torque (also called transient SSR) [10]. In this paper, all three aspects are considered. Eigenvalue analysis is extensively utilized for the
study of torsional interaction and induction generator effect. Transient torque study is done through the electromagnetic transient simulation in PSCAD/EMTDC software. For the IGE and SSTI analysis, subsynchronous and torsional modes are of interest. The variation of Subsynchronous and the torsional modes, respectively, used to study the induction generator effect and the torsional interaction.
III.
S
YSTEMM
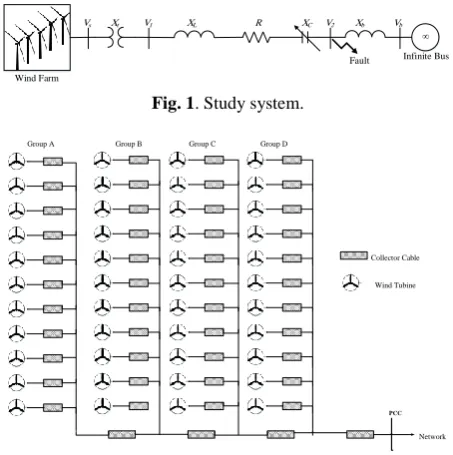
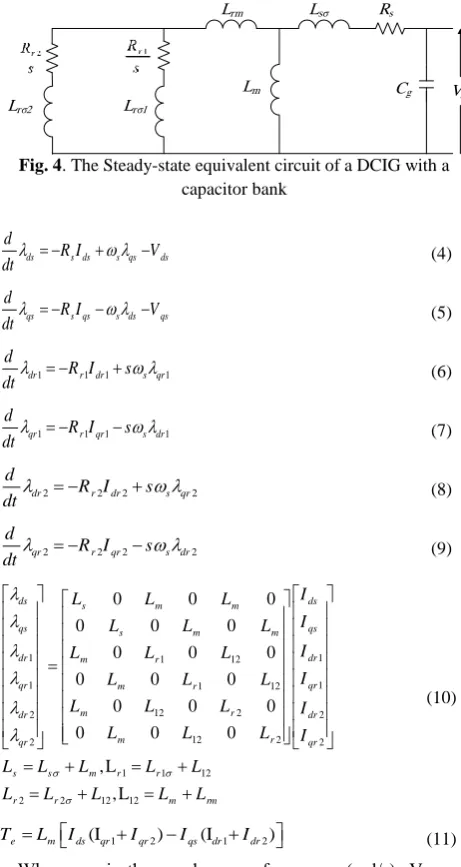
ODELINGThe study system is shown in Fig. 1. The study system includes a large wind farm based on double-cage induction generators (DCIG), which is connected to an infinite bus through a long distance series-compensated transmission line. The wind farm split into different clusters connected by cables (impedances). The single line diagram of the wind farm is shown in Fig. 2.
Fig. 1. Study system.
Fig. 2. Single line diagram of the wind farm.
In the following, the differential equations of the system are extracted.
A. WTG Torsional System Model
In order to investigate the SSR phenomenon, the turbine-generator is modeled as multi-mass. In this paper, a two-mass WTG drive train model, which shown in Fig. 3, is used. Dynamic equations of turbine generator shaft are expressed as (1)-(3) [11].
Fig. 3. Two-mass drive train model.
Wind Farm
Vs Xt V1 XL
∞ XC V2 Xb Vb
Infinite Bus Fault
R
PCC
Collector Cable
Wind Tubine
Network
Group A Group B Group C Group D
Tw
2Ht d t Tw Ktg tgDtg( t g)
dt (1)
tg t g
d
dt (2)
2 g g tg tg tg( t g) e
d
H K D T
dt (3)
In Equs (1)-(3), ωt and ωg is the angular speed of the wind
turbine and the generator, respectively, Ht and Hg is the
inertia constant of wind turbine and generator, respectively,
Ktg is the shaft stiffness between wind turbine and generator,
δtg is the torsional angle between the wind turbine and
generator, Dtg is the damping coefficient between the wind
turbine and generator, Tw is the mechanical torque, and Te is
the electromagnetic torque.
B. Double cage induction generator model
Many wind farms in the world are based on the fixed speed turbine generators. For example the Brahmanvel wind farm with capacity of 550 MW in India, Twin Groves wind farm with capacity 396 MW in Illinois, Maple Ridge wind farm with capacity 322 MW in New York, Pioneer Prairie wind farm with capacity 302 MW in Iowa and Fowler Ridge wind farm with capacity 300 MW in Indiana used fixed speed wind turbines based squirrel cage induction generator [36].
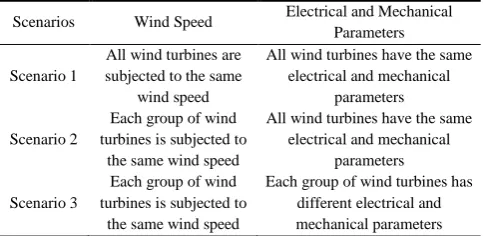
A fixed-speed wind turbine generator consists of a conventional squirrel cage induction generator that is directly connected to the grid. The slip of the induction generator varies with the power generated. However, the variations are within 1%-2% of the rated generator speed. In this type of generator, since the rotor speed cannot be controlled, variation in the wind speed causes fluctuation in the input torque that is directly translated into variable output power. The induction generator output power increases with the increase in the torque applied to its shaft by the turbine. The stand-alone fixed speed induction generators do not produce reactive power. Therefore, an external source of reactive power such as capacitor bank should be used at the generator terminal. Fixed speed induction generators are designed as a single-cage rotor or double-cage rotor, but normally the squirrel cage induction generators with rated power above 5 kW are designed by the double-cage rotor. The steady-state equivalent circuit of a DCIG equipped by capacitor bank is shown in Fig. 4. The differential equations of the DCIG in the synchronously rotating d-q reference can be extracted as (4)-(9) [37]. In addition, the induction generator flux linkage (λ) and electromagnetic torque equations, respectively, are shown as (10) and (11) [11].
Fig. 4. The Steady-state equivalent circuit of a DCIG with a capacitor bank
ds s ds s qs ds
d
R I V
dt (4)
qs s qs s ds qs
d
R I V
dt (5)
1 1 1 1
dr r dr s qr
d
R I s
dt (6)
1 1 1 1 qr r qr s dr
d
R I s
dt (7)
2 2 2 2
dr r dr s qr
d
R I s
dt (8)
2 2 2 2
qr r qr s dr
d
R I s
dt (9)
1 1 12 1
1 1 12 1
12 2
2 2
12 2
2 2
1 1 12
2 2 1
0 0 0
0 0 0
0 0 0
0 0 0
0 0 0
0 0 0
, L
ds s m m ds
qs s m m qs
dr m r dr
qr m r qr
m r
dr dr
m r
qr qr
s s m r r
r r
I
L L L
I
L L L
I
L L L
I
L L L
L L L I
L L L I
L L L L L
L L L
2, L12Lm Lrm
(10)
1 2 1 2
(I ) (I )
e m ds qr qr qs dr dr
T L I I I I (11)
Where, ωs is the synchronous frequency (rad/s); Vds and
Vqs, Ids and Iqs, are the d-q axis voltage and stator current of
DCIG respectively; Idr1 and Iqr1, Idr2 and Iqr2 are respectively
the d-q axis current of first and second rotor cage; Rs and Lsσ
respectively are the resistance and leakage inductance of stator winding; Rr1 and Rr2, Lrσ1 and Lrσ2 are the resistance and
leakage inductance of first and second rotor cage respectively; Lm is the magnetizing inductance and, Lrm is the
mutual leakage inductance between two rotor cages.
C. Transmission line model
The differential equations of the transmission line can be extracted in the d-q reference by the equations (12)-(17) [11].
Lrσ2 Lrσ1
Lrm
Lm
Lsσ Rs
g ds ds d s g qs
d
C V I I C V
dt (12)
g qs qs q s g ds
d
C V I I C V
dt (13)
d ds d s q cd bd
d
L I V RI LI V V
dt (14)
q qs q s d cq bq
d
L I V RI LI V V
dt (15)
cd d s cq
d
C V I CV
dt (16)
cq q s cd
d
C V I CV
dt (17)
Where, Vcd and Vcq, Vbd, and Vbq, Id and Iq are respectively
the voltage across the series capacitor, infinite bus voltage, and the transmission line current in the d-q reference frame. C and Cg are respectively, the series capacitor of the
transmission line, and the shunt capacitor bank at the terminal of the wind plant. In addition, L is defined as (18):
L T b
L L L L (18)
Where, LL, LT, and Lb, respectively are the inductance of
the transmission line, the transformer, and infinite bus source.
D. Equivalent model of wind turbine generators (WTGs)
Extracting the equivalent model of wind turbine generators is an important aspect during the planning of large wind power plants and their stability studies. In this section, how to determine the parameters of the equivalent model of DCIG based wind turbines are explained. In this method, it is assumed that the disturbance in a bus identically affects the performance of all wind turbines. To determine the aggregated model parameters of a wind farm, the equivalent of electrical and mechanical sections of the wind farm should be obtained. The equivalent model of a wind farm considering N number of wind turbines are expressed below:
The equivalent parameters of the torsional system such as inertia constant (Heq), shaft stiffness (Keq) and damping
coefficient (Deq), respectively, are obtained in (19), (20) and
(21). According to (19)-(21), the summation of the torsional system parameters of wind turbines indicate the equivalent wind turbine parameters.
1
Neq k
k
H H (19)
1
Neq k
k
K K (20)
1
Neq k
k
D D (21)
Where k-index represents the kth wind turbine in a wind farm.
The equivalent capacity of the wind turbines (Seq) is
obtained from the summation of each wind turbine capacity
according to (22).
1
Neq k
k
S S (22)
Where Sk is the rating capacity of the kth wind turbine.
The equivalent parameters of the double cage induction generator (Xeq) are obtained from (23).
1
Neq k k
k
X X (23)
Where, Xk is a parameter of kth generator and αk is a factor,
which is calculated from (24).
1
Nk k k
k
S S
(24)
Also, the equivalent shunt capacitors (Cgeq) at the terminal
of the equivalent induction generator is calculated from (25).
1
Ngeq gk
k
C C (25)
Where Cgk is the shunt capacitance at the kth generator
terminal.
E. Complete system model
The differential equations describing different subsystems are linearized by Taylor expansion and linear state-space model of each subsystem is stated as (26)-(28) [11].
T TT T TG G T T
X A X A X B u (26)
G GT T GG G GN N
X A X A X A X (27)
N NG G NN N N N
X A X A X B u (28)
Equations (26)-(28) represent the state space of the turbine generator mechanical system, induction generator electrical system, and transmission network, respectively. Where, A and B respectively, are the coefficients matrix of the state variables and input vectors and the subscripts T, G, and N are related to the turbine, generator, and network. In addition, XT,
XG, and XN, respectively, are the state variables vector of the
turbine generator mechanical, induction generator, and transmission network subsystems and represent as (29)-(31). Also, uT and uN, respectively, are the input of the turbine
generator mechanical and transmission network subsystems and represent as (31)-(32). In (29)-(33), is a linearization
symbolof equations.
[ , , ]
T t tg g
X (29)
1 1 2 2
[ , , , , , ]
G ds qs dr qr dr qr
X I I I I I I (30)
[ , , , , , ]
N ds qs d q cd cq
X V V I I V V (31)
[ ]
T
U T (32)
[ , ]
N bd bq
U V V (33)
farm is modeled by 11 equations. The method for obtaining the equivalent wind turbine parameters is illustrated in section 3.4. In the MTR model, several wind turbine groups are considered, and each group of the wind turbine is modeled by the equivalent wind turbine. For example, if four groups of the wind turbine is considered the wind farm is modeled by 44 equations (the wind turbine in each group have the same electrical and mechanical parameters and is subjected to the same wind speed). In addition, in the FTR model, all of the wind turbines are modeled separately.
IV.
S
MALLS
IGNALA
NALYSISIn this section, in order to SSR analysis in a double-cage induction generator based wind farm connected to the series-compensated transmission line, the wind farm is modeled by three representations STR, MTR and FTR.
To comprehensive analysis of SSR, three scenarios are considered. In the first and second scenarios, all of the WTGs are identical but WTGs in the third scenario are different. In the first scenario, all wind turbines are subjected to the same wind speed (identical aerodynamic torque), and in the second scenario, each group of wind turbines is subjected to the same wind speed (wind speed is different between groups). In the third scenario, the electrical and mechanical parameters and also the capacity are different for each group of WTGs. The considered scenarios are summarized in Table I.
TABLE I
CONDITIONS CONSIDERED FOR WTGS IN DIFFERENT SCENARIOS
Scenarios Wind Speed Electrical and Mechanical Parameters Scenario 1
All wind turbines are subjected to the same
wind speed
All wind turbines have the same electrical and mechanical
parameters Scenario 2
Each group of wind turbines is subjected to
the same wind speed
All wind turbines have the same electrical and mechanical
parameters Scenario 3
Each group of wind turbines is subjected to
the same wind speed
Each group of wind turbines has different electrical and mechanical parameters
In the following, for the mentioned scenarios, using linear modal analysis the eigenvalues of the benchmark system are
calculated and compared for different wind farm
representations. Since in this paper the effect of different wind farm representation on SSR phenomenon is studied; therefore, only the subsynchronous and torsional modes of the system are presented.
A. Small signal analysis of the Scenario 1
In the Scenario 1, a 101.2-MW wind farm is considered which consists of 44 double-cage IG-based wind turbines. In this scenario, all of the 44 generators are the same in terms of type (IG) and size (2.3 MW); and are subjected to identical
aerodynamic torque (Tw=1 pu).
Table II shows the results of the small signal analysis for
different models of the wind farm and 50% series compensation level. In the MTR model, every 11 wind turbines are considered in one group. As shown in Table II, the results are the same for all three models. It should be noted that, in the STR model one torsional mode, and in the MTR and FTR, respectively, 4 and 44 torsional modes are obtained.
TABLE II
EIGENVALUES ASSOCIATED WITH SSR IN DIFFERENT
REPRESENTATION MODELS FOR SCENARIO 1.
Modes Type STR model MTR model FTR model Subsynchronous
mode -0.364 ± j236.300 -0.364 ± j236.300 -0.364 ± j236.300 Torsional
mode(s) -0.527 ± j3.594 -0.527 ± j3.594 -0.527 ± j3.594
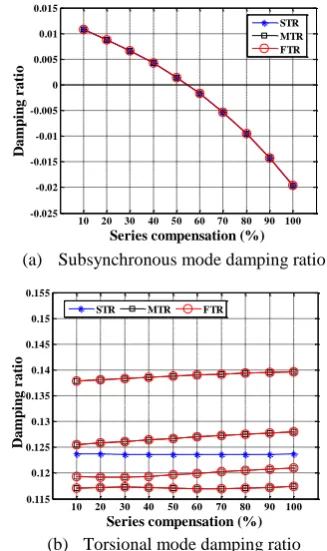
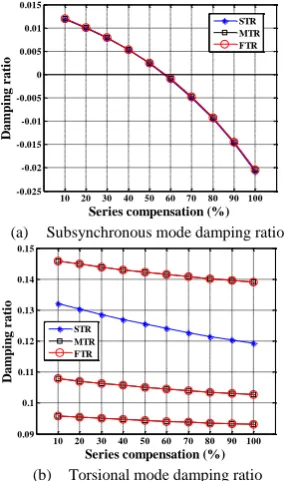
As shown in Table II, for this scenario, in MTR and FTR models, respectively, all 4 and 44 torsional modes are obtained as -0.527±j3.594. For this scenario, the damping ratio variations of the subsynchronous and torsional modes for different series compensation levels are shown in Fig. 5. It should be noted that in the real power systems the compensation level is at a maximum of 75% range and higher values are meaningless (the normal compensation level is between 55% to 65%). According to Fig. 5, for Scenario 1, the damping ratio of these two modes is the same at all series compensation levels in all three models.
(a) Subsynchronous mode damping ratio
(b) Torsional mode damping ratio
Fig. 5. Subsynchronous and torsional modes damping ratio in different representation models for Scenario 1.
B. Small signal analysis of the Scenario 2
In the Scenario 2, same as Scenario 1, 44 identical wind turbines with 2.3 MW capacity are considered. But unlike the Scenario 1, different aerodynamic torques are applied to the wind turbines. 4 groups of 11 wind turbines (group A, group
10 20 30 40 50 60 70 80 90 100 -0.025
-0.02 -0.015 -0.01 -0.005 0 0.005 0.01 0.015
Series compensation (%)
D
amp
in
g r
ati
o
STR MTR FTR
10 20 30 40 50 60 70 80 90 100 0.135
0.14 0.145 0.15 0.155 0.16
Series compensation (%)
D
amp
in
g r
ati
o
B, group C and group D) are assumed that are subjected to the different aerodynamic torques (subjected to different
wind speed). Group A produces rated output power (Tw=1
pu), group B produces 75% of its rated output power (Tw=0.75 pu), group C produces 50% of its rated output
power (Tw=0.5 pu), and group D produces 25% of its rated
output power (Tw=0.25 pu). Therefore, the generated power
of the wind farm to be reduced to 63.25 MW.
The results of the small signal analysis of the Scenario 2 are presented in Table III for a 50% series compensation level and various wind farm models. As seen from Table III, in the STR model one torsional mode equal to -0.341±j236.268 is obtained. In MTR model, 4 torsional modes equal to
-0.425±j3.609, -0.434±j3.608, -0.461±j3.608, and
-0.505±j3.608 are obtained that be associated with the 4 groups A, B, C, and D, respectively. In FTR model, 44 torsional modes are obtained such that 11 torsional modes are equal to -0.425±j3.609, 11 torsional modes are equal to -0.434±j3.608, 11 torsional modes are equal to -0.461±j3.608, and 11 torsional modes are equal to -0.505±j3.608.
TABLE III
EIGENVALUES ASSOCIATED WITH SSR IN DIFFERENT
REPRESENTATION MODELS FOR SCENARIO 2.
Modes Type STR model MTR model FTR model Subsynchronous
mode -0.341 ± j236.268 -0.342 ± j236.273 -0.342 ± j236.273 Torsional
mode(s) -0.447 ± j3.594
-0.425 ± j3.609 -0.434 ± j3.608 -0.461 ± j3.608 -0.505 ± j3.608
-0.425 ± j3.609 -0.434 ± j3.608 -0.461 ± j3.608 -0.505 ± j3.608
As shown in Table III, the subsynchronous mode is almost identical in all three models, but the torsional mode in the STR model is different from torsional modes obtained by MTR and FTR models. Also, the results of the MTR and FTR model are completely identical. In addition, the results show that when the mechanical parameters of wind turbines are the same, there is a negative correlation between wind turbine output power and torsional modes damping. Such that, in the MTR and FTR models, respectively, each group of wind turbines and each wind turbines that produce more power, has the least damping of torsional modes. Fig. 6 shows the damping ratio of the subsynchronous and the torsional modes for different series compensation levels in the Scenario 2. According to Fig. 6, the damping ratio of the subsynchronous mode is the same in all three models for the same series compensation levels, and the damping ratio of torsional modes are different for STR model than MTR and FTR models.
C. Small signal analysis of the Scenario 3
In the Scenario 3, a 112-MW wind farm is considered which includes wind turbine-generators by different electrical and mechanical parameters, and different output rated power.
For this purpose, 20 wind turbines with an induction generator of 2.3 MW, 20 wind turbines with an induction generator of 2 MW and 20 wind turbines with an induction generator of 1.3 MW are considered. In this scenario, it is assumed that each wind turbine produces the rated output power. In MTR model, the same wind turbine generators are modeled in the same group. Therefore, group A involves induction generators of 2.3 MW, group B involves induction generators of 2 MW and group C involves induction generators of 1.3 MW.
Table IV shows the system eigenvalues related to SSR in different representation models for Scenario 3. As seen from Table IV, in the STR model one torsional mode equal to -0.429±j3.392 is obtained. In MTR model, 3 torsional modes equal to -0.517±j3.603, -0.265±j2.516 and -0.434±j4.579 are obtained that be associated with the 3 groups A, B, and C, respectively. In FTR model, 60 torsional modes are obtained such that 20 torsional modes are equal to -0.517±j3.603, 20 torsional modes are equal to -0.265±j2.516, and 20 torsional modes are equal to -0.434±j4.579.
(a) Subsynchronous mode damping ratio
(b) Torsional mode damping ratio
Fig. 6. Subsynchronous and torsional modes damping ratio in different representation models for Scenario 2.
TABLE IV
EIGENVALUES ASSOCIATED WITH SSR IN DIFFERENT
REPRESENTATION MODELS FOR SCENARIO 3.
Modes Type STR model MTR model FTR model Subsynchronous
mode -0.542 ± j231.150 -0.571 ± j231.121 -0.571 ± j231.121 Torsional
mode(s) -0.429 ± j3.392
-0.517 ± j3.603 -0.265 ± j2.516 -0.434 ± j4.579
-0.517 ± j3.603 -0.265 ± j2.516 -0.434 ± j4.579
10 20 30 40 50 60 70 80 90 100 -0.025
-0.02 -0.015 -0.01 -0.005 0 0.005 0.01 0.015
Series compensation (%)
D
amp
in
g r
ati
o
STR MTR FTR
10 20 30 40 50 60 70 80 90 100 0.115
0.12 0.125 0.13 0.135 0.14 0.145 0.15 0.155
Series compensation (%)
D
amp
in
g r
ati
o
As seen from Table IV, the subsynchronous mode is close to each other in all three models, but the torsional mode in the STR model is different from torsional modes obtained by MTR and FTR models. Also, the results of the MTR and FTR model are completely identical. In addition, in this scenario, the wind turbines with an induction generator of 2 MW have the least damping of torsional modes. Fig. 7 shows the damping ratio of the subsynchronous and the torsional modes in different series compensation levels for the Scenario 3. As seen in Fig. 7, in the different representation of wind farm the damping ratio of the subsynchronous mode is the same in any series compensation levels; while that the damping ratio of torsional modes are different for STR model than MTR and FTR models.
With respect to the obtained results shown in Table II, Table III and Table IV, it is concluded when a wind farm includes of identical wind turbine-generators, and all of the wind turbines subject to the equal wind speed, the STR model is accurate for SSR analysis and there is no need for more complex model such that MTR and FTR models. But in the real condition of wind farms even the wind turbine-generators are identical, the wind turbines experienced different wind speeds. Therefore, the MTR, and FTR models should be used in SSR analysis. In addition, these results show that the FTR model of the wind farm can be replaced by MTR model in SSR analysis.
(a) Subsynchronous mode damping ratio
(b) Torsional mode damping ratio
Fig. 7. Subsynchronous and torsional modes damping ratio in different representation models for Scenario 3.
V.
S
IMULATIONIn this section, the simulation of the considered scenarios is done with PSCAD/EMTDC software to validate the small signal analysis. For system transient response, an LLLG fault
(three line to ground fault) occurs at the end of the transmission line (infinitive bus) at t=4 seconds and lasts for six cycles (100ms). In order to obtain the frequency components of the electromagnetic and the shaft torques, Fast Fourier Transform (FFT) analysis is used. The simulation results are for 50% compensation level.
A. Simulation of the Scenario 1
The results of the Scenario 1 simulation are shown in Fig. 8 and Fig. 9. These figures, respectively, show the electromagnetic torque and the shaft torque with their frequency components. Simulation results are the same for all three models, moreover these results confirm stability and oscillation frequency of the small signal analysis results (Table II). Therefore, when the wind turbines and their output power are the same, all three models have the same results and the equivalent model (STR model) is suitable for SSR analysis in a wind farm with the same wind turbines and output powers.
(a) Electromagnetic torque
(b) FFT of electromagnetic torque
Fig. 8. Electromagnetic torque and its FFT for Scenario 1.
(a) Shaft torque
10 20 30 40 50 60 70 80 90 100 -0.025
-0.02 -0.015 -0.01 -0.005 0 0.005 0.01 0.015
Series compensation (%)
D
amp
in
g r
ati
o
STR MTR FTR
10 20 30 40 50 60 70 80 90 100 0.09
0.1 0.11 0.12 0.13 0.14 0.15
Series compensation (%)
D
amp
in
g r
ati
o
STR MTR FTR
0 20 40 60
0 0.05 0.1 0.15 0.2
Frequency (Hz)
A
b
sol
u
te
magn
itu
d
e
FFT of Te
37.6 Hz 236.25 rad/s
5.98 Hz 37.573 rad/s
4 5 6 7 8 9 10
0.85 0.9 0.95 1 1.05 1.1
time (s)
Ts
h
(p
u
)
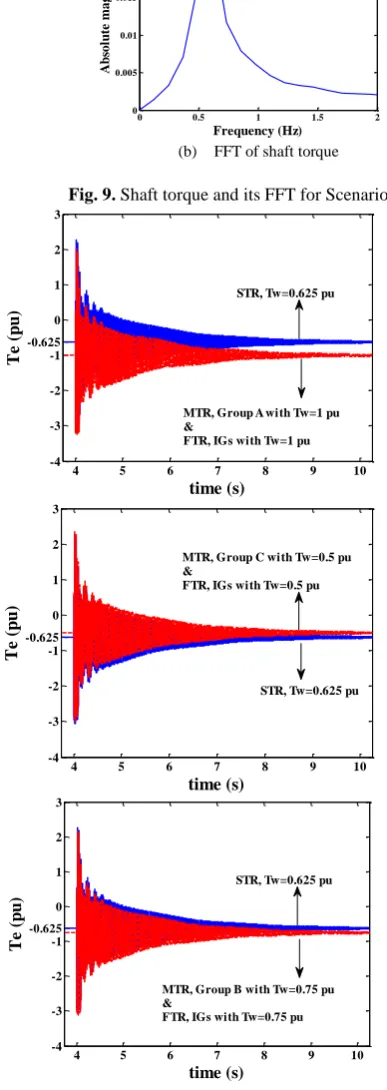
(b) FFT of shaft torque
Fig. 9. Shaft torque and its FFT for Scenario 1.
B. Simulation of the Scenario 2
For Scenario 2, the generator electromagnetic torque in different wind farm models and their frequency components are shown in Fig. 10 and Fig. 11, respectively. As shown in Fig. 10, the transient behavior of the electromagnetic torque is the same in all models, and according to Fig. 11, the frequency and amplitude of the oscillations are the same in all three models.
Fig. 10. Electromagnetic torques for Scenario 2.
Fig. 11. FFT analysis of Electromagnetic torques for Scenario 2.
In Fig. 12, the torsional torques applied to the generator shaft and the FFT are shown for different models. Fig. 12 shows the torsional torques of the STR and the MTR models are different, while the MTR and FTR have completely similar results. Fig. 12 show that a group of wind turbines with a higher output power have higher torsional oscillations amplitude and less damping. Therefore, the results of simulation and small signal analysis show that in the SSR phenomenon analysis when wind turbines have different aerodynamic torques, the modeling of all wind turbines with an equivalent turbine (STR model) is not to be accurate enough. Also, the results show that using the exact model of wind turbines (FTR model) is not necessary, and the wind turbines with the same productive power can be modeled in the same group (MTR model).
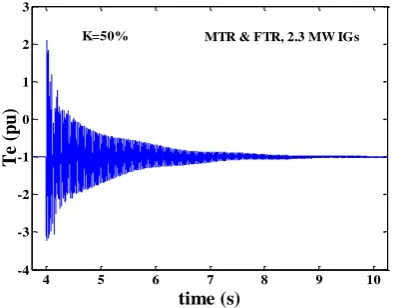
C. Simulation of the Scenario 3
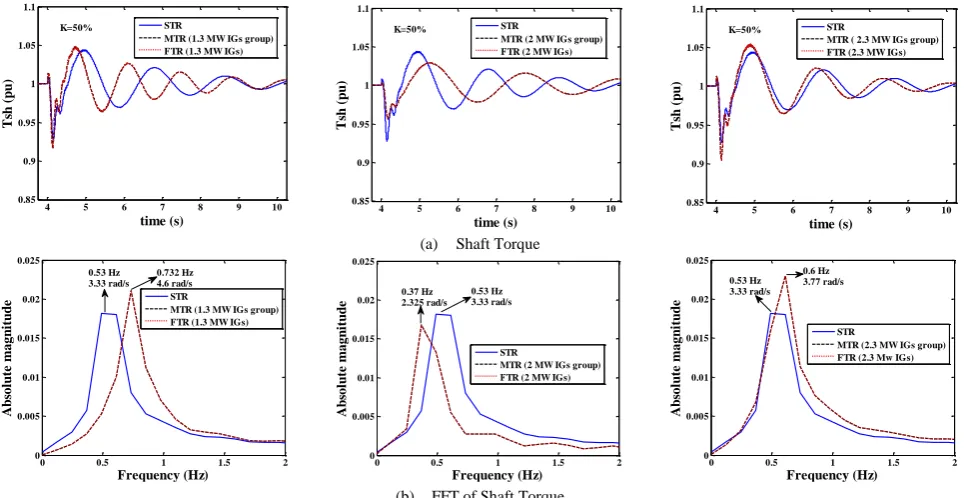
Fig. 13 and Fig. 14 respectively represent the electromagnetic torques for the different models of the wind farm for Scenario 3. Furthermore, the FFT analysis of this scenario is shown in Fig. 15. According to these two figures, the transient behavior in all three models, the amplitude and the frequency of the oscillations are the same and confirms the results of the small signal analysis (Table IV). Also, Fig. 16 shows the torques applied to the shaft of generators in different wind farm models and their FFT. According to Fig. 16, the transient behavior and the frequency of the torsional torques oscillations resulting from the simulation are
0 0.5 1 1.5 2
0 0.005 0.01 0.015 0.02 0.025
Frequency (Hz)
A
b
sol
u
te
magn
itu
d
e
FFT of Tsh 0.57 Hz
3.58 rad/s
4 5 6 7 8 9 10
-4 -3 -2 -1 -0.625 0 1 2 3
time (s)
Te
(p
u
)
MTR, Group A with Tw=1 pu &
FTR, IGs with Tw=1 pu STR, Tw=0.625 pu
4 5 6 7 8 9 10
-4 -3 -2 -1 -0.625 0 1 2 3
time (s)
Te
(p
u
)
STR, Tw=0.625 pu MTR, Group C with Tw=0.5 pu &
FTR, IGs with Tw=0.5 pu
4 5 6 7 8 9 10
-4 -3 -2 -1 -0.625 0 1 2 3
time (s)
Te
(p
u
)
STR, Tw=0.625 pu
MTR, Group B with Tw=0.75 pu &
FTR, IGs with Tw=0.75 pu
37 37.1 37.2 37.3 37.4 37.5 37.6 37.7 37.8 37.9 38 0.04
0.06 0.08 0.1 0.12 0.14 0.16 0.18 0.2 0.22 0.24
Frequency (Hz)
A
b
sol
u
te
magn
itu
d
e
STR
MTR & FTR (IGs with Tw=1 pu) MTR & FTR (IGs with Tw=0.75 pu) MTR & FTR (IGs with Tw=0.5 pu) MTR & FTR (IGs with Tw=0.25 pu)
confirmed the small signal results. Fig. 16 shows that the MTR and FTR models have led to very similar results in determining the frequency and amplitude of the oscillations. While there is a little difference between the results of the STR model and the results of MTR and FTR models. Therefore, in a wind farm with different wind turbines for the SSR phenomenon analysis, the same wind turbines modeling in a group (MTR model) gives us more accurate results.
(a) FFT of shaft torque
(a) Shaft torque
Fig. 12. Shaft torques and their FFT analysis for Scenario 2.
Fig. 13. Electromagnetic torques for STR model in Scenario 3.
Fig. 14. Electromagnetic torques for MTR model in Scenario 3.
Fig. 15. FFT analysis of Electromagnetic torques for Scenario 3.
4 5 6 7 8 9 10
0.2 0.4 0.6 0.8 1 1.2
time (s)
Ts
h
(p
u
)
Tsh1, FTR & MTR, Tw=1 pu
Tsh2, FTR & MTR, Tw=0.75 pu
Tsh3, FTR & MTR, Tw=0.5 pu
Tsh4, FTR & MTR, Tw=0.25 pu Tsh, STR, Tw=0.625 pu
0 0.5 1 1.5 2
0 0.005 0.01 0.015 0.02 0.025
Frequency (Hz)
A
b
sol
u
te
magn
itu
d
e FFT of Tsh
FFT of Tsh1 FFT of Tsh2 FFT of Tsh3 FFT of Tsh4 0.575 Hz
3.613 rad/s
4 5 6 7 8 9 10
-4 -3 -2 -1 0 1 2 3
time (s)
Te
(p
u
)
K=50% MTR & FTR, 2.3 MW IGs
4 5 6 7 8 9 10
-4 -3 -2 -1 0 1 2 3
time (s)
Te
(p
u
)
K=50% MTR & FTR, 2 MW IGs
4 5 6 7 8 9 10
-4 -3 -2 -1 0 1 2 3
time (s)
Te
(p
u
)
K=50% STR
36 36.2 36.4 36.6 36.8 37 37.2 37.4 37.6 37.8 38 0
0.05 0.1 0.15 0.2 0.25
Frequensy (Hz)
A
b
sol
u
te
magn
itu
d
e
STR
MTR & FTR, 2.3 MW IGs MTR & FTR, 2 MW IGs MTR & FTR, 1.3 MW IGs 36.86 Hz
VI.
C
ONCLUSIONSIn this paper, the effect of different representation types of wind turbines (STR, MTR and FTR models) on the SSR analysis in the double-cage IG based wind farm is studied. For this purpose, by the STR, MTR and FTR models both torsional interaction and induction generator effect are studied in different conditions of the power system. The results show that in all of these representation, the subsynchronous mode has not so much changed. Therefore, an equivalent model (STR model) for the wind farm is adequate to study the induction generator effect. Also, the increase in the series compensation level reduces the damping of this mode, and this mode becomes unstable from a series compensation level to next. Therefore, the induction generator effect is more influenced by the series compensation level and the different rated capacity and different output power of wind turbines has a little effect on the induction generator effect phenomenon. In addition, the increase in the series compensation level almost reduces the damping of torsional mode but this mode is stable for different series compensation levels. Furthermore, when all wind turbines are the same and affected by the same wind speed (the same aerodynamic torques), an equivalent model (STR model) is suitable for torsional interaction analysis. While that when wind turbines are subjected to different wind speed or the wind turbines are not the same in electrical and mechanical parameters, the STR model is not suitable to study the torsional interaction. In these conditions, the MTR model provides an accurate result of torsional interaction between the turbine generator and the series capacitor.
R
EFERENCES[1] A. Ackerman, Wind power in power systems, John Wiley and Sons, New York, 2005.
[2] A. Lara, J. Ekanayake and C. Huges, Wind energy generation modeling and control, John Wiley and Sons, Chichester, U.K., 2009.
[3] S. Sawyer, S. Teske and K. Rave, Global wind energy outlook, Available from: http://www.gwec.net/, 2014. [4] P. Ledesma and J. Usaola, “Transient stability of a fixed
speed wind farm,” Renewable Energy, Vol. 28, No. 9, pp. 1341-1355, 2003.
[5] D. J. Trudnowski, A. Gentile, J. M. Khan and E. M. Petritz, “Fixed speed wind-generator and wind-park modeling for transient stability studies,” IEEE Transactions on Power Systems, Vol. 19, No. 4, pp. 1911-1917, 2004.
[6] E. Muljadi, C. Butterfield, B. Parsons and A. Ellis, “Effect of variable speed wind turbine generator on stability of a weak grid,” IEEE Transaction on Energy Conversion, Vol. 22, No. 1, pp. 29-36, 2007.
[7] A. Khajeh and Z. Shabani, “Adaptive gain scheduling control of doubly fed induction generator based wind turbines to improve fault ride through performance,”
International Journal of Industrial Electronics, Control and Optimization, Vol. 1, No. 1, pp. 61-70, 2018.
[8] I. Erlich, J. Kretschmann, Fortmann, S. Mueller-Engelhardt and H. Wrede, “Modeling of wind turbines based on doubly-fed induction generators for power system stability studies,” IEEE Transactions on Power Systems, Vol. 22, No. 3, pp. 909-919, 2007. [9] E. L. Petersen and P. H. Madsen, “wind Farms,”
Encyclopedia of the Anthropocene, Vol. 1, pp. 407-420, 2018.
[10] A. Moharana and R. K. Varma, “Subsynchronous resonance in single cage self excited induction generator based wind farm connected to series-compensated lines,”
IET Generation, Transmission & Distribution, Vol. 5, No. 12, pp. 1221-1232, 2011.
(a) Shaft Torque
(b) FFT of Shaft Torque
Fig. 16. Shaft torques and their FFT analysis for Scenario 3.
4 5 6 7 8 9 10
0.85 0.9 0.95 1 1.05 1.1
time (s)
Ts
h
(p
u
)
STR
MTR ( 2.3 MW IGs group) FTR (2.3 MW IGs) K=50%
4 5 6 7 8 9 10
0.85 0.9 0.95 1 1.05 1.1
time (s)
Ts
h
(p
u
)
STR
MTR (2 MW IGs group) FTR (2 MW IGs) K=50%
4 5 6 7 8 9 10
0.85 0.9 0.95 1 1.05 1.1
time (s)
Ts
h
(p
u
)
STR
MTR (1.3 MW IGs group) FTR (1.3 MW IGs) K=50%
0 0.5 1 1.5 2
0 0.005 0.01 0.015 0.02 0.025
Frequency (Hz)
A
b
sol
u
te
magn
itu
d
e
STR
MTR (2.3 MW IGs group) FTR (2.3 Mw IGs) 0.6 Hz
3.77 rad/s 0.53 Hz
3.33 rad/s
0 0.5 1 1.5 2
0 0.005 0.01 0.015 0.02 0.025
Frequency (Hz)
A
b
sol
u
te
magn
itu
d
e
STR
MTR (2 MW IGs group) FTR (2 MW IGs) 0.53 Hz
3.33 rad/s 0.37 Hz
2.325 rad/s
0 0.5 1 1.5 2
0 0.005 0.01 0.015 0.02 0.025
Frequency (Hz)
A
b
sol
u
te
magn
itu
d
e STR
MTR (1.3 MW IGs group) FTR (1.3 MW IGs) 0.53 Hz
[11] A. Moharana and R. K. Varma, “SSR in double-cage induction-generator-based wind farm connected to series-compensated Transmission line,” IEEE Transactions on Power Systems, Vol. 28, No. 3, pp. 2573-2583, 2013.
[12] M. Henderson, D. Bertagnolli and D. Ramey, “Planning HVDC and FACTS in New England,” Proc. IEEE/PES PSCE, Seattle, WA, USA, pp. 1-3, 15-18 March 2009. [13] P. Kundur, Power system stability and control, Tata
McGraw-Hill, New York, 1994.
[14] K. Padiyar, Analysis of subsynchronous resonance in power system, Kluwer Academic, 1999.
[15] A. Tabesh and R. Iravani, “Small-signal dynamic model and analysis of a fixed-speed wind farm—A frequency response approach,” IEEE Transaction on Power Delivery, Vol. 21, No. 2, pp. 778–787, 2006.
[16] S. M. Chan, R. L. Cresap and D. H. Curtice, “Wind turbine cluster model,” IEEE Transactions on Power Apparatus and Systems, Vol. 103, No. 7, pp. 1692–1698, 1984. [17] J. Xu, P. K. Kanyingi, K. Wang, G. Li and X. Jiang,
“Probabilistic small signal stability analysis with large scale integration of wind power considering dependence,”
Renewable and Sustainable Energy Reviews, Vol. 69, pp. 1258-1270, 2017.
[18] A. Ostadi, A. Yazdani and R. K. Varma, “Modeling and stability analysis of a DFIG-based wind-power generator interfaced with a series-compensated line,” IEEE Transaction on Power Delivery, Vol. 24, No. 3, pp. 1504-1514, 2009.
[19] L. Fan, C. Zhu, Z. Miao and M. Hu, “Modal analysis of a DFIG-based wind farm interfaced with a series compensated network,” IEEE Transaction on Energy Conversion, Vol. 26, No. 4, pp. 1010-1020, 2011.
[20] H. A. Mohammadpour and E. Santi, “Subsynchronous resonance analysis in DFIG-based wind farms: Definitions and problem identification — Part I,” Proceeding on IEEE Energy Conversion Congress and Exposition (ECCE), Pittsburgh, P.A., U.S.A., pp. 812-819, 14-18 September 2014.
[21] A. Moharana, R. K. Varma, ‘SSR alleviation by STATCOM in induction-generator-based wind farm connected to series compensated line,” IEEE Transactions on Sustainable Energy, Vol. 5, No. 3, pp. 947-957, 2014. [22] X. Xi, H. Geng and G. Yang, “Enhanced model of the
doubly fed induction generator-based wind farm for small-signal stability studies of weak power system,” IET Renewable Power Generation, Vol. 8, No. 7, pp. 765-774, 2014.
[23] H. A. Mohammadpour, A. Ghaderi, and E. Santi, “Analysis of subsynchronous resonance in doubly-fed induction generator-based wind farms interfaced with gate – controlled series capacitor,” IET Generation, Transmission & Distribution, Vol. 8, No. 12, pp. 1998-2011, 2014.
[24] A. E. Leon, J. M. Mauricio and J. A. Solsona, “Subsynchronous resonance mitigation using variable speed wind energy conversion systems,” IET Generation, Transmission & Distribution, Vol. 7, No. 5, pp. 511-525, 2013.
[25] H. A. Mohammadpour, A. Ghaderi, H. Mohammadpour and E. Santi, “SSR damping in wind farms using observed-state feedback control of DFIG converters,”
Electric Power Systems Research, Vol. 123, PP. 57-66, 2015.
[26] F. Mancilla-David, J. L. Domínguez-García, M. De Prada, O. Gomis-Bellmunt, M. Singh and E. Muljadi, “Modeling and control of Type-2 wind turbines for subsynchronous resonance damping,” Energy Conversion and Management, Vol. 97, pp. 315-322, 2015.
[27] A. Vasel-Be-Hagh, C. L. Archer, “Wind farms with counter-rotating wind turbines,” Sustainable Energy Technologies and Assessments, Vol. 24, pp. 19-30, 2017. [28] V. B. Virulkar and G.V. Gotmare, “Subsynchronous
resonance in series compensated wind farm: a review,”
Renewable and Sustainable Energy Reviews, Vol. 55, pp. 1010-1029, 2016.
[29] X. Xie, X. Zhang, H. Liu, Y. Li, and C. Zhang, “Characteristic analysis of subsynchronous resonance in practical wind farms connected to series-compensated transmissions,” IEEE Transaction on Energy Conversion, Vol. 32, No. 3, pp. 1117-1126, 2017.
[30] X. Zhang, X. Xie, H. Liu, H. and Y. Li, “Mitigation of subsynchronous control interaction in wind power systems with GA-SA tuned damping controller,” IFAC Papers Online, Vol. 50, No. 1, pp. 8740–8745, 2017.
[31] S. Chernet, M. Beza and M. Bongiorno, “Investigation of subsynchronous control interaction in DFIG-based wind farms connected to a series compensated transmission line,”
Electrical Power and Energy Systems, Vol. 105, pp. 765-774, 2019.
[32] L. Shi and G. Xu, “Subsynchronous resonance analysis and simulation on wind farm,” 2nd International Conference on Power and Renewable Energy (ICPRE), pp. 412-416, 2017.
[33] B. Zoghdar-Moghadam-Shahrekohne and S. M. Barakati, “A novel approach for mitigating SSR in DFIG-based wind farms integrated into series compensated network,”
9th International Congress on Ultra Modern
Telecommunications and Control Systems and Workshops (ICUMT), Munich, pp. 311-317, 2017.
[34] W. Chen, X. Xie, D. Wang, H. Liu and H. Liu, “Probabilistic Stability Analysis of Subsynchronous Resonance for Series-Compensated DFIG Based Wind Farms,” IEEE Transactions on Sustainable Energy, Vol. 9, No. 1, pp. 400-409, 2018.
[35] J. Shaira, X. Xie, L. Wang, W. Liu, J. He, and H. Liu, “Overview of emerging subsynchronous oscillations in practical wind power systems,” Renewable and Sustainable Energy Reviews, Vol. 99, pp. 159–168, 2019. [36] A. K. Moharana, Subsynchronous resonance in wind farms,
Ph.D. Thesis, Dept. of ECE, University of Western Ontario, Canada, 2012.
[37] P. C. Krause, O. Wasynczuk, and S. D. Sudho, Analysis of Electric Machinery and Drive Systems, IEEE Press, 2002.
A
PPENDIXTABLE V
DOUBLE-CAGE INDUCTION GENERATORS DATA.
Parameter 2.3 MW IG 2 MW IG 1.3 MW IG
P 2.3 MW 2 MW 1.3 MW
V 690 V 690 V 690 V
F 60 Hz 60 Hz 60 Hz
CONTINUED.TABLE V
RS (pu) 0.00506 0.00506 0.0074
Xsσ (pu) 0.13176 0.12552 0.1485
Rr1 (pu) 0.01199 0.01165 0.0129
Rr2 (pu) 0.019239 0.018624 0.0124
Xrσ1 (pu) 0 0 0
Xrσ2 (pu) 0.21172 0.28565 0.1345
Xrm (pu) 0.072175 0.078995 0.0499
Xm (pu) 3.8892 4.00508 4.369
TABLE VI
TRANSMISSION LINE DATA
Parameter Value Paramet
er Value System
Base
892.4
MVA R 0.02 pu Base
Voltage 500 kV Xb 0.06 pu
Xt 0.14 pu Xc (10% - 100%) (Xt + XL + Xb)
XL 0.50 pu
TABLE VII
WIND TURBINES DATA.
Parameter 2.3 MW WT
2 MW WT
1.3 MW WT Inertia constant of the wind
turbine 4 s 4.29 s 2.5 s Shaft stiffness 0.3 pu 0.15 pu 0.3 pu Inertia constant of the generator 0.5 s 0.9 s 0.5 s
Damping coefficient 0 pu 0 pu 0 pu Number of the blades 3 3 3
Rotor diameter 92 m 80 m 62.4 m mechanical speed 1200 rpm 1200
rpm 1200 rpm Angular speed of rotor 11 rpm 13.5 rpm 20 rpm
Gearbox ratio 109 88.8 60 Air density 1.225
kg/m3
1.225 kg/m3
1.225 kg/m3
TABLE VIII
COLLECTOR CABLE DATA [Ω/M].
Resistance Reactance 0.00046 0.000368
Mohamad Kazem Salehi was born in Shahrbabak, Iran. He received his M.Sc. Degrees in electrical engineering from Graduate University of Advanced Technology, Kerman, Iran, in 2016. His research interests include application of power electronics in power systems, renewable energy, and wind power plants. He is currently PhD student of electrical engineering in Shiraz University of Technology, Shiraz, Iran.