1 International Journal of Transportation Engineering, Vol.6/ No.1/ Summer 2018
Evaluation and Statistical Validation of Black-Spots
Identification Methods
Esmaiel Karimi Maskooni 1, Farshidreza Haghighi 2
Received: 22.06.2017 Accepted: 31.10.2017
Abstract
Despite the identification of crash hotspots as a first step of the roads safety management process, with various effective black spots identification (HSID) methods, only a few researchers have compared the performance of these methods; also it is not clear which test is the most consistent in the black-spots identification. In this research, seven commonly applied HSID methods (accident frequency (AF), PIARC coefficient based equivalent property damage only (EPDO), P-value (Islamic Republic of Iran Ministry Roads and Urban development), accident rate (AR), combined criteria, empirical Bayes (EB), societal risk-based) were compared against six robust and informative quantitative evaluation criteria (site consistency test, method consistency test, total rank differences test, total score test, sensitivity test and specificity test). These tests evaluate each method performance in a variety of areas, such as efficiency in identifying sites that show consistently poor safety performance, reliability in identifying the same black spots in subsequent time periods .To evaluate the HSID methods, three years of crash data from the Kerman state were used. Analytical Hierarchy Process (AHP) method has been used for determination the importance coefficients of evaluation tests and as a result, showed that the total rank differences test is the most appropriate test. The quantitative evaluation tests showed that the EB method performs better than the other HSID method. Test results highlight that the EB method is the most consistent and reliable method for identifying priority investigation locations. Overall, this result is consistent with the results of previous studies. The societal risk-based method performed worst in the all of the tests. It should be noted that advantages associated with the EB method were based on crash data from one of the road in Iran country, so the relative performances of HSID methods may change when using other crash data. However, the study results are consistent with earlier findings.
Keywords:Safety, black spots, crash hotspots, HSID
Corresponding author E-mail: [email protected]
1. Introduction
The identification of crash hotspots, also referred to as hazardous road locations, high-risk locations, accident-prone locations, black spots, sites with promise, or priority investigation locations, is the first step of the highway safety management process. Crash hotspot identification results to a list of sites that are prioritized for detailed engineering and safety studies; which can identify crash patterns, contributing factors, and potential countermeasures [Hauer et al., 2002a, 2004]. Compared with the large number of studies focused on the development of various HSID methods, considerably less research has been dedicated to comparing the performance of various methods [Cheng and Washington, 2005]. Central to the comparison of HSID methods is the identification and development of robust and informative quantitative and qualitative criteria that can be used to evaluate this methods.
Montella (2010) using five years of crash data collected in Italian motorway A16 compared seven commonly HSID methods using the site consistency test, the method consistency test, the total rank differences test, and the total score test. The quantitative evaluation tests showed that the EB method performs better than the other HSID methods and the proportion method performed worst in all of the tests. Also, Chen et al. (2014) the performance of two spatial analysis methods and four conventional methods for hazardous road segments identification (HRSI) was compared against three quantitative evaluation criteria. The spatial analysis methods considered in this study include the Local Spatial Autocorrelation (LSA) method and the Kernel Density Estimation (KDE) method. Data were obtained from a 622.2 km section on the A1 highway in the United Kingdom From 2001 to 2010 years. It was found that the Empirical Bayesian (EB) method and the KDE method outperformed other HRSI approaches. Qu and Meng (2014) using societal risk-based simple ranking and empirical Bayesian methods to identify the hotspots in a Singapore expressway
on the basis of the detailed three years casualty data in the Historical Crash Damage (HCD) database. They further conduct a consistency analysis to compare the societal risk-based method and the conventional frequency-based method. The consistency analysis reports that (1) the frequency-based method is more consistent than the societal risk-based method, and (2) the empirical Bayesian method is more consistent than the simple ranking method.
Analytical Hierarchy Process Method (AHP) has been suggested based on the analysis of the human brain for complex and fuzzy issues. This method has been presented by the researcher, Thomas L-hour, in 1970, so that the numerous applications have been discussed for this method since then. Among the Multi Criteria Decision Methods, the Analytical Hierarchy Process (AHP) is considered above all in solving the rating issues. In recent years, the application of AHP is largely used as a useful tool in the multi criteria decision to locate a suitable location such as the construction of distribution centers [Dey, Ramcharan, 2008], and limestone mines [Shyur and Shih, 2006]. In 1994, Schenkerman in his famous paper rejects the use of reverse rating in the AHP method. A later year, Louis J. Vargas in response to Schenkerman presents a paper in which he defended the AHP method, and also replied to the objections raised by Schenkerman [Schenkerman, 1994].
Given that the comprehensive studies have not been performed on the hotspot identification (HSID) methods and some methods have been studied in each research, a comprehensive analysis of these methods is discussed in this study. Also in this study, due to the fact that until now no study has been performed on which evaluation test is more suitable to identify black-spots, the AHP method is used to determine the coefficients of the evaluation tests.
3 International Journal of Transportation Engineering, Vol.6/ No.1/ Summer 2018 that were evaluated; Section 3 explains the
analytics of the quantitative evaluation criteria; Section 4 describes the case study data; Section 5 describes elements used in the analytical hierarchical process AHP; Section 6 explains methodology for ranking Evaluation of Tests using analytical hierarchical process; Section 7 reports and discusses the results of the comparison of HSID methods according to the evaluation criteria and AHP method; and finally, conclusions are drawn in Section 8.
2. Alternative Hotspot Identification
Methods Used in Comparison
The following HSID methods were compared: the crash frequency (CF), the ranking of equivalent property damage only (EPDO) crash frequency, the crash rate (CR), the P-value,
the
combined criteria,
the empirical Bayes (EB) and societal risk-based. Each of these HSID methods is described below.2.1 Crash Frequency
The CF method is probably the simplest and most commonly used method for HRSI. Applying this method, sites are ranked in descending order of observed crash frequencies. In this method, the target road is divided into various segments. The safety performance of the road segments is ranked by the number of crashes reported at each road segment during a specified time period. One of the limitations is that the CF method does not consider the effects of crash exposure. As a result, the results may bias towards the locations with higher traffic volumes. In addition, using reported crash counts for safety ranking does not take into account the random fluctuation in crash counts. The results may be biased because the hazardous sites are not identified according to the long-term expected crash frequency.
2.2 Crash Rate
The crash rate normalizes the frequency of crashes with exposure (measured by traffic volume). Road segments are ranked by the crash
rate to take into account traffic exposure. Even though the method is currently being extensively used in practical engineering applications, recent studies have suggested that using crash rate for safety assessment mistakenly assumes that the relationship between crash frequency and flow rate is linear. Similar to the crash frequency method, the random fluctuation in crash counts is not considered in the crash rate method. This method reflects crash risk for the individual road user.
2.3 P-Value
All crashes are not created equal, since fatal and severe injury crashes are far more costly to society than are property damage only (PDO) crashes. Societal crash costs include medical, emergency services, market productivity, household productivity, insurance administration, workplace cost, legal costs, travel delays, and property damage- the cumulative costs that society bears when a person is injured or killed in a motor vehicle crash. As a result a modified and straightforward HSID method is proposed that incorporates a PDO equivalency factor in estimating safety performance functions. Islamic Republic of Iran Ministry Roads and Urban development suggests the PDO equivalency factors are given as:
𝑃 − 𝑣𝑎𝑙𝑢𝑒𝑖
= 𝑃𝐷𝑂𝑖(0.5) + 𝐼𝑛𝑗𝑢𝑟𝑦𝑖(3)
+ 𝐹𝑎𝑡𝑎𝑙𝑖(9)
(1)
𝑃 − 𝑣𝑎𝑙𝑢𝑒𝑖≥ 20 (2)
where the number of crashes at location i,
𝑃 − 𝑣𝑎𝑙𝑢𝑒𝑖, is equal crashes at this site calculated as the weighted sum of PDO, injury, and fatal crashes. According equation (2), every segment that P-value's is large or equal 20, identify as black-spot.
2.4 Equivalent Property Damage Only
Crash Frequency
property damage only) to develop a combined frequency and severity score for each site. The weighting factors are based on property damage only (PDO) crash costs. An EPDO value summarizes the crash costs and severity. In the calculations, PIARK suggests weighting factors for property damage only (PDO) crashes =1, injury crashes =3.5, and fatal crashes =9.5.
2.5 Societal Risk-Based Crash Hotspot
Identification
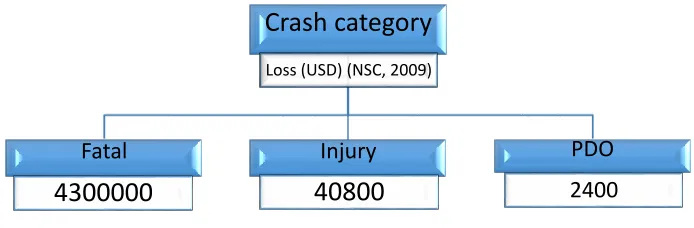
The objective of this method is to propose a comprehensive HSID method by taking not only crash frequency but also crash severity (evaluated by the monetary losses caused by different crashes). Let {1, 2, ..., I} be the set of road sections of a target homogeneous Two-line road. Assuming that there are J types of crash denoted by 1, 2, ..., J, let 𝑓𝑖𝑗 and 𝑚𝑖𝑗 denote the yearly number of crashes of type j occurring on section i and the estimated monetary loss from one crash of type j, respectively. The above values are all based on the ‘‘willingness-to-pay’’ approach, estimating the amounts that individuals are prepared to pay to reduce a risk to their lives, which is the value to the individual on an ex-ante basis, or before the fact. In other words, the willingness-to-pay approach attempts to capture trade-offs between wealth and small reductions in risk. People’s preferences (either stated or revealed) demonstrate the value they place on reducing a risk to their life.As can be seen in figure 1, the crashes costs estimated from different studies are quite consistent.
Societal risk has been proposed and used in a number of quantitative risk assessment models to represent risks incorporating both accident frequency and the severity of dangerous scenarios (see Meng et al., 2011 a,b; Meng and Qu, 2012). The societal risk is defined as the annual monetary loss due to crashes on one particular
section i of an expressway, denoted by Ri, namely,
(3)
𝑅𝑖= ∑(𝑓𝑖𝑗𝑚𝑖𝑗), ∀𝑖
𝐽
𝑖=1
∈ {1، 2، 0 00، 𝐼}
2.6 Combined Criteria
The combination of different criteria can reduce the disadvantages of each of them. The combined criteria method uses the combination of the accident frequency and accident rate methods that include a) calculating the frequency and rate of accidents per location, b) calculating the mean frequency and rate of accidents in the reference population, c) calculating the minimum frequency and rate of accident that will justify the detailed analysis of safety and finally, d) ranking the places in accordance with the identification criteria. Each section in that both the accident frequency and accident rate exceed their criteria in that section is identified as a high-accident section.
2.7 Empirical Bayes
5 International Journal of Transportation Engineering, Vol.6/ No.1/ Summer 2018 Figure 1. Comprehensive costs of motor-vehicle crashes with different severities based on NSC, 2009.
The frequency of accidents is adjusted at the all sections with the help of these two numbers. Equation (4) shows the calculations to estimate the frequency of accidents modified in which the modified accident frequency of section j is 𝑓𝐸𝐵𝑗, the frequency of accident average in the reference is = 𝑓𝑟𝑝 and 𝑆2= the accident frequency
variance in the reference is 𝑆2=∑(𝑓𝑗−𝑓𝑟𝑝) 2
(𝑛−1) . The
calculation of the improvement potential (P.I.) of each of the sites is according to the equation (5).
(4)
𝑓𝐸𝐵𝑗= 𝑓𝑗+𝑓𝑟𝑝
𝑆2(𝑓𝑟𝑝− 𝑓𝑗)
(5)
𝑃. 𝐼.𝑗= 𝑓𝐸𝐵𝑗− 𝑓𝑟𝑝
3. Hotspot Identification Methods
Evaluation Criteria
The various HSID methods were compared using six quantitative evaluation tests: the site consistency test, the method consistency test, the total rank differences test, the sensitivity test, the specificity test and the total score test. Each of these tests are described below.
3.1. Site Consistency Test
The site consistency test (SCT) measures the ability of an HSID method to consistently identify a high-risk site over repeated observation periods. The test rests on the premise that a site identified as high risk during time period i should
also reveal an inferior safety performance in a subsequent time period i + 1, given that the site is in fact high risk and no significant changes have occurred at the site. The method that identifies sites in a future period with the highest crash frequency is the most consistent. The test statistic is given as:
(6)
𝑇1 = ∑ 𝐶𝑘,𝑚𝑒𝑡ℎ𝑜𝑑=𝑗(𝑖),𝑖+1
𝑛
𝑘=𝑛−𝑛∝
> ∑ 𝐶𝑘,𝑚𝑒𝑡ℎ𝑜𝑑≠𝑗,𝑖+1
𝑛
𝑘=𝑛−𝑛∝
where j is the HSID method being compared, n is the total number of sites, α is the threshold of identified hotspots (e.g., α= 0.01 corresponds with top 1% of n sites identified as hotspots, and n˛ is the number of identified hotspots), C is the crash count for site ranked k in the time period i +1, L is the length of the site ranked k in the time period i + 1 (km), and 𝑦𝑖+1 is the length of the time period i +1 (years).
3.2. Method Consistency Test
The method consistency test (MCT) evaluates a method’s performance by measuring the number of the same hotspots identified in both time periods. It is assumed that road sections are in the same or similar underlying operational state and their expected safety performance remains
Crash category
Loss (USD) (NSC, 2009)
Fatal
4300000
Injury
40800
PDO
virtually unaltered over the two analysis periods. With this assumption of homogeneity, the greater the number of hotspots identified in both periods the more consistent the performance of the HSID method. The test statistic is given as:
(7)
𝑇2
= {𝐾𝑛−𝑛∝, 𝐾𝑛−𝑛∝+1, … , 𝐾𝑛}𝑗,𝑖
∩ {𝐾𝑛−𝑛∝, 𝐾𝑛−𝑛∝+1, … , 𝐾𝑛}𝑗,𝑖+1
3.3 Total Rank Differences Test
The total rank differences test (TRDT) takes into account the safety performance rankings of the road sections in the two periods. The test is conducted by calculating the sum of the total rank differences of the hotspots identified across the two periods. The smaller the total rank difference, the more consistent of the HSID method. The test statistic is given as:
(8)
𝑇3 = ∑ (ℜ(𝑘𝑗,𝑖) − ℜ(𝑘𝑗,𝑖+1))
𝑛
𝑘=𝑛−𝑛∝
3.4 Total Score Test
The total score test (TST) combines the site consistency test, the method consistency test, and the total rank difference test in order to provide a synthetic index. The test statistic is given as:
(9)
𝑇4=100
3 × [(
𝑆𝐶𝑇𝑗
𝑚𝑎𝑥𝑗𝑆𝐶𝑇) + (
𝑀𝐶𝑇𝑗
𝑚𝑎𝑥𝑗𝑀𝐶𝑇)
+ (1
−𝑇𝑅𝐷𝑇𝑗− 𝑚𝑖𝑛𝑗
𝑇𝑅𝐷𝑇
𝑚𝑎𝑥𝑗𝑇𝑅𝐷𝑇 )]
The test assumes that the SCT, MCT, and TRDT have the same weight. The former three tests provide absolute measures of effectiveness, whereas the total score test gives an effectiveness measure relative to the methods being compared. If method j performed best in all of the previous tests, the TST value is equal to 100. If method j performed worst in all of the tests, the TST value is positive since all three components of the test have a positive value. Indeed, SCT and MCT,
which should be maximized by the HSID methods, are weighted in relation to the maximum values in the tests, whereas TRDT, which should minimized by the HSID methods, is weighted in relation to its difference from the minimum value in the test.
3.5 Sensitivity Test (T1)
In this test, the sensitivity of different HSID methods for hotspots identification will be discussed according to the equation (10), so each HSID method that has the greatest value in the test; it can obtain the best performance.
Sensitivity=𝑛𝑢𝑚𝑏𝑒𝑟 𝑜𝑓 𝑐𝑜𝑟𝑟𝑒𝑐𝑡 𝑝𝑜𝑠𝑖𝑡𝑖𝑣𝑒𝑠
𝑡𝑜𝑡𝑎𝑙 𝑛𝑢𝑚𝑏𝑒𝑟 𝑜𝑓 𝑝𝑜𝑠𝑖𝑡𝑖𝑣𝑒𝑠 (10)
3.6 Specificity Test (T2)
In this test, the specificity of different HSID methods for hotspots identification will be discussed according to the equation (11), so each HSID method that has the greatest value in the test; it can obtain the best performance.
Specificity =𝑛𝑢𝑚𝑏𝑒𝑟 𝑜𝑓 𝑐𝑜𝑟𝑟𝑒𝑐𝑡 𝑛𝑒𝑔𝑎𝑡𝑖𝑣𝑒𝑠
𝑡𝑜𝑡𝑎𝑙 𝑛𝑢𝑚𝑏𝑒𝑟 𝑜𝑓 𝑛𝑒𝑔𝑎𝑡𝑖𝑣𝑒𝑠 (11)
4. Case Study Data
7 International Journal of Transportation Engineering, Vol.6/ No.1/ Summer 2018
5. Elements used in the analytical
hierarchical process
A framework for the proposed methodology for ranking evaluation of tests using analytical hierarchical process is presented in Figure 2. In this ranking evaluation of tests presents the six quantitative tests (See Figure 2): site consistency test, method consistency test, total rank differences test, total score test, sensitivity test, and specificity test.
6.
Methodology
for
Ranking
Evaluation of Tests using Analytical
Hierarchical Process
The elements discussed in the previous section, may not equally affect in identification the best evaluation of the test. A system of weights therefore needs to be determined the coefficients to of each element. The relative weights of the above elements are determined using Analytical Hierarchy Process (AHP). As a mathematical procedure, AHP can find the coefficient of each item (e.g., element) in a problem.
Mathematically, AHP uses pair-wise comparisons to systematically scale the items. It calculates the Eigen values of the Relative Weight Matrix (RWM), and determines the relative weights by determining the eigenvector (Saaty 1990; Vaidya and Kumar 2006). The process is as follows:
1. Set up a RWM for each level in the hierarchy
2. Calculate the eigenvector of the RWM(s)
3. Measure the consistency of the comparisons.
6.1. Construction of Relative Weight
Matrices
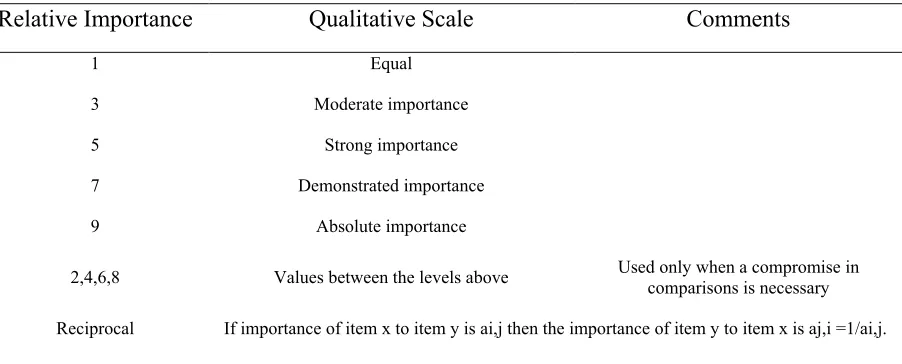
In AHP, the weight of elements is found by using a RWM [Saaty, 1990]. This Process is based on pair-wise comparisons. An expert is asked to compare each element and associate a relative importance to the pair. The relative importance is assessed using the scale in Table 1. If item ‘x’ is more important than item ‘y’ then this importance is mapped into a scale of 1 to 9 where 9 is the absolute importance. In Saaty’s scale, the relative importance of item ‘y’ to item ‘x’, is the reciprocal of the importance of item ‘x’ to item ‘y’ [Saaty and Wong, 1983].
AHP uses all possible pair-wise comparisons to calculate the weights. For example, when there are three items (e.g., elements); x, y and z, ideally two comparisons would be enough, but AHP compares all possible comparisons, that is three in this case; "x and y", "y and z", and "x and z". The extra comparison(s) are used to:
• solve the unknown situations or transitivity gaps (e.g., if x>y and x>z then an extra comparison between ‘y and z’ is required),
• verify consistency in the experts judgments (e.g., if x>y and y>z then obviously x>z).
Identification of the best evaluation of test
Site consistency test
Method consistency test
Total rank
differences test Total score test Sensitivity test Specificity test
Site consistency test
Figure 2. Ranking elements
Table 1. Relative Importance of Categories (Saaty and Wong 1983)
Relative Importance
Qualitative Scale
Comments
1 Equal
3 Moderate importance
5 Strong importance
7 Demonstrated importance
9 Absolute importance
2,4,6,8 Values between the levels above Used only when a compromise in comparisons is necessary
Reciprocal If importance of item x to item y is ai,j then the importance of item y to item x is aj,i =1/ai,j.
Table 2. The Relative Weight Matrix, (A)
Matrix A A B C
A 1 𝑎1,2 𝑎1,3
B 𝑎2,1 1 𝑎2,3
C 𝑎3,1 𝑎3,2 1
An expert is asked for the values of the elements of the upper triangle, 𝑎1,2, 𝑎1,3, 𝑎2,3; where 𝑎𝑖,𝑗 is
the relative preference of i to j, and therefore, the
relative preference of j to i is given by: 𝑎𝑗,𝑖=1/𝑎𝑖,𝑗.
9 International Journal of Transportation Engineering, Vol.6/ No.1/ Summer 2018 categories are investigated, 𝑛(𝑛−1)
2 comparisons
would be needed. Consequently, for 15 subjects, more than 100 comparisons are required. Since it is impractical to ask the experts to do such a number of comparisons consistently, the number of items is the main limitation of the process.
6.2 Calculation of Weights
The next step is to determine the weights of the items by calculating the eigenvector of the RWM. Assuming that the weights for item i is 𝑊𝑖, by
definition, the RWM consists of pair-wise comparisons (𝑎𝑖,𝑗) which are the ratio of the
weight of item i to that of category j:
𝑎𝑖,𝑗=𝑊𝑖/𝑊𝑗 (12)
Therefore, the vector of weights itself W= (𝑊1,
𝑊2, …, 𝑊𝑛) is an eigenvector for the RWM. As
a result, the problem becomes that of finding an eigenvector W in order to satisfy equation (13):
AW = λ𝑚𝑎𝑥W (13)
where λ𝑚𝑎𝑥 is the largest Eigen value of the matrix A.
For each expert the RWM (matrix A as in Table 2) is specified; then, eigenvector of RWM is calculated using equation (13). The eigenvector gives the weights of each item based on the expert’s viewpoint. This calculation is repeated for all experts.
6.3 Consistency Index
Although, the extra comparisons in AHP may be time consuming, they can be used to check the consistency of each expert's judgments. The consistency test involves calculation of
consistency index (CI) as demonstrated in equation (14):
CI=(λ𝑚𝑎𝑥-m)/(m-1) (14)
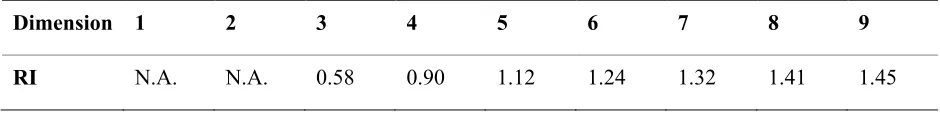
where m is the dimension of RWM (matrix A). This consistency index is compared against a reference average Random Index (RI) which is given in Table 3 (Saaty and Wong 1983).
The ratio of consistency index, CI, to the average random consistency index, RI, is called Consistency Ratio which is calculated by equation (15).
CR=CI/RI (15)
The RWM (matrix A) is considered reasonable if CR<0.1 (Saaty and Wong 1983). In other words, if CR<0.1 for the pair-wise comparisons of an expert, his/her judgment is approved by the consistency test.
In this paper, due to the high volume of manual calculations, we have used the Expert Choice software to calculate the AHP method.
7. Tests and AHP Method Results
and Discussion
Table 3. Random Index (RI) for different dimensions of RWM (Saaty and Wong 1983)
Dimension 1 2 3 4 5 6 7 8 9
RI N.A. N.A. 0.58 0.90 1.12 1.24 1.32 1.41 1.45
7.1 Site Consistency Test Results
The performance of various HSID methods was compared considering 10% threshold for determining hazardous sections. The results of the site consistency test are given in Table 5. It was found that the AF, AR, Combined criteria methods performed the best, followed by the EB, P-Value, societal risk-based, EPDO methods. The AF, AR, Combined criteria methods outperformed other conventional HRSI methods with higher numbers of crash counts being observed during subsequence time periods. The finding is inconsistent with those of previous studies [Chen and Washington, 2008; Montella, 2010].
7.2 Method Consistency Test Results
The EB method was superior in this test by identifying the largest number of the same hotspots in 10% of sites. In this case, the AF, AR, Combined criteria, P-Value methods gave the same results. The societal risk-based method performed worse than the EB method. The EPDO method performed the worst.
7.3 Total Rank Differences Test Results
In this test, the EB method performed the best and was closely followed by the AF, AR and Combined criteria methods. The difference between the EB, AF, AR and Combined criteria methods and the other HSID methods was very impressive. Indeed, the other methods showed significantly greater summed ranked differences. The P-Value and Societal risk-based methods, which were only slightly worse than the EB method in the site consistency test, revealed large inconsistencies in the total rank differences test, mainly because they do not control for random
fluctuation in crashes over time. The EPDO method performed the worst.
7.4 Total Score Test Results
In the total score test, which combines the results of the previous three tests, the EB method performed better than the other HSID methods in all of the case studies (the top 10% of the sites), reaching values very close to 100 (97.83).
The AF, AR and Combined criteria methods performed worse than the EB method in all of the tests in 10% threshold of hotspots identified (total test score equal to 88.6 for in three methods). The P-Value (75.03) and Societal risk-based (47.44) methods were inconsistent. The EPDO method (9.53) performed worst in all of the tests.
7.5 Sensitivity Test Results
In this test, the sensitivity of different methods HSID are assessment. The EB method performed better than the other HSID methods (the top 10% of the sites), followed by P-Value.
In this test, the all methods results were closely together. The difference between the EB, AF, AR and Combined criteria methods (2.5) and societal risk-based method (2.4) was very low and only slightly worse. But the EPDO method performed the worst still.
7.6 Specificity Test
Results
11 International Journal of Transportation Engineering, Vol.6/ No.1/ Summer 2018 worse (12, 12, 12, 10.2 and 10.2 respectively).
The EB and societal risk-based methods performed the worst.
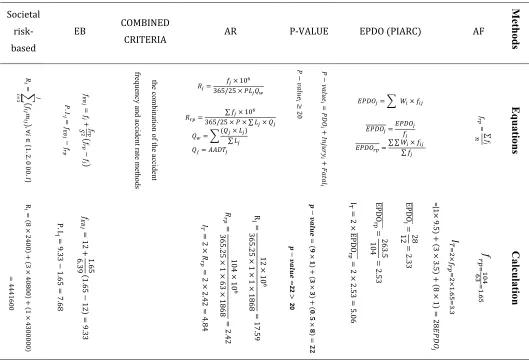
Table 4. Analytical detail of the HSID methods based on the section Black-Spot 25 Km
Societal
risk-based
EB COMBINED
CRITERIA AR P-VALUE EPDO (PIARC) AF
Metho d s 𝑅 𝑖 = ∑ (𝑓 𝑖𝑗 𝑚 𝑖𝑗 ), ∀ 𝑖 ∈ {1 ، 2 ، 0 00 ، 𝐼 } 𝐽 𝑖=
1 𝐸𝐵𝑓
𝑗 = 𝑓 𝑗 + 𝑓 𝑟𝑝 𝑆 2 (𝑓 𝑟𝑝 − 𝑓 𝑗) 𝑃 .𝐼 . 𝑗 = 𝑓 𝐸𝐵 𝑗 − 𝑓 𝑟𝑝 th e combin atio
n of the acciden
t fr eq uen cy and acc id en t r ate m eth od s
𝑅𝑗=
𝑓𝑗× 106
365/25 × 𝑃𝐿𝑗𝑄𝑤
𝑅𝑟𝑝=
∑ 𝑓𝑗× 106
365/25 × 𝑃 × ∑ 𝐿𝑗× 𝑄𝑗
𝑄𝑤= ∑
(𝑄𝑗× 𝐿𝑗)
∑ 𝐿𝑗
𝑄𝑗= 𝐴𝐴𝐷𝑇𝑗
𝑃 − 𝑣 𝑎𝑙𝑢𝑒 𝑖 = 𝑃 𝐷𝑂 𝑖 + 𝐼𝑛 𝑗𝑢𝑟𝑦 𝑖 + 𝐹 𝑎𝑡 𝑎𝑙 𝑖 𝑃 − 𝑣 𝑎𝑙𝑢𝑒 𝑖 ≥ 20
𝐸𝑃𝐷𝑂𝑗= ∑ 𝑊𝑖× 𝑓𝑖𝑗
𝐸𝑃𝐷𝑂𝑗=
𝐸𝑃𝐷𝑂𝑗
𝑓𝑗
𝐸𝑃𝐷𝑂𝑟𝑝=
∑ ∑ 𝑊𝑖× 𝑓𝑖𝑗
∑ 𝑓𝑗
𝑓 𝑟𝑝 = ∑ 𝑓 𝑗 𝑛 Equa tio ns R i = (8 × 24 0 0 ) + (3 × 40 8 00 ) + (1 × 43 00 0 00 ) = 44 41 60 0 𝑓 𝐸𝐵𝑗 = 12 + 1 .65 6 .39 (1 .65 − 12 ) = 9 .33 P .I . j = 9 .33 − 1 .65 = 7 .68 R j = 12 × 10 6 365 .25 × 1 × 1 × 1868 = 17 .59 𝑅 𝑟𝑝 = 104 × 10 6 365 .25 × 1 × 63 × 1868 = 2 .42 𝐼 𝑇 = 2 × 𝑅 𝑟𝑝 = 2 × 2 .42 = 4 .84 𝒑 − 𝒗𝒂𝒍𝒖𝒆 = (𝟗 × 𝟏 ) + (𝟑 × 𝟑 ) + (𝟎 .𝟓 × 𝟖) = 𝟐𝟐 𝒑 − 𝒗𝒂𝒍𝒖𝒆 = 22 > 20 𝐸𝑃 𝐷𝑂 𝑗 =( 1 × 9 .5 ) + (3 × 3 .5 ) + (8 × 1 ) = 28 E P DO j ̅̅̅ ̅̅̅ ̅̅ = 28 12 = 2 .33 E P DO rp ̅̅̅ ̅̅̅ ̅̅̅ ̅ = 263 .5 104 = 2 .53 I T = 2 × E P DO rp ̅̅̅ ̅̅̅ ̅̅̅ ̅ = 2 × 2 .53 = 5 .06 𝑓 𝑟𝑝 = 104 63 = 1 .65 𝐼 𝑇 = 2 × 𝑓 𝑟𝑝 = 2 × 1 .65 = 3 .3 Calcul at io n
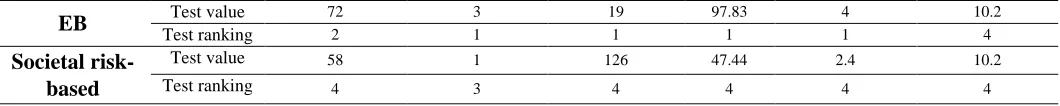
Table 5. Test results-top 10% of hotspots
HSID method Site consistency test Method consistency test Total rank differences test Total score test Sensitivity test Specificity test
AF Test ranking Test value 77 1 2 2 21 2 88.6 2 2.5 3 12 3
EPDO (PIARC)
Test value 13 0 162 9.53 1.33 59
Test ranking 5 4 5 5 5 1
P-Value Test value 69 2 70 75.03 3 14.25
Test ranking 3 2 3 3 2 2
AR Test ranking Test value 77 1 2 2 21 2 88.6 2 2.5 3 12 3
Combined criteria
Test value 77 2 21 88.6 2.5 12
EB Test ranking Test value 72 2 3 1 19 1 97.83 1 4 1 10.2 4 Societal
risk-based
Test value 58 1 126 47.44 2.4 10.2
Test ranking 4 3 4 4 4 4
7.7 Discussion of Test Results
In the table (5), all results of the HSID methods analysis are briefly shown based on the assessment tests. In table (5), the value obtained from each method in each test has been shown as the value of test as well as the rank achieved by the each methods in each test based on its value as the raking of test. The accident frequency, accident rate, and combined criteria methods have the best performance in the site consistency test. The Bayes empirical method has the most consistent in the in the method consistence test, the total rank difference test, the total score test and sensitivity test. Also, in the sensitivity test, EPDO (PIARC) method had best results. In finally, as in the table (5) can be seen, the EPDO (PIARC) method has results worst in more of the tests.Overall, our study results are consistent with the results of the previous quantitative evaluations carried out by Montella (2010), Cheng and Washington (2008) and Elvik (2007, 2008a).The test results highlight that the EB method is the most consistent and reliable method for identifying priority investigation locations.
7.8 Evaluation Test Results Based on
Analytical Hierarchy Process (AHP)
Method
Based on the previous studies that none of them had been investigated the evaluation tests, in this study, based the analytical hierarchy process
(AHP) method, determination of importance coefficient each test. In AHP method, the Expert Choice software used for determines the final coefficient in each test that the final results shown in table (6). According to results obtained in the table (6), least value showed the most appropriate and compatible HSID method. Figure (2) shows that the ‘total rank differences test’ performs better than the other evaluation test. The total rank differences test was followed by the following tests: the total score test, the sensitivity test (ST1), specificity test (ST2), method consistency test, and site consistency test. As can be seen, the site consistency test performed worst in all of the tests for identification the high-accidents areas. Thus, according to the coefficients obtained for each of the tests in AHP method, it has been determinate most consistent of the HSID method (see Table (6)). The values of each method have been shown in the table (6). Each method that has the least value among all others has the best performance, so according to table (6), the Bayes empirical method (EB) has the best performance among the methods whom studied in this research following: accident frequency (AF), accident severity (AR), and combined criteria methods that gave the same results and P-Value, EPDO and societal based-risk. The societal based-risk method performed the worst (see Table (6)). Another advantage of this study is to identify the high-accident areas Jiroft-Kerman road using the various methods.
Priorities with respect to selection the best criteria
13 International Journal of Transportation Engineering, Vol.6/ No.1/ Summer 2018 Figure 2. The evaluation test results based AHP method used Expert Choice Software
8. Conclusions
Seven commonly applied HSID methods were compared against six robust and informative quantitative evaluation criteria: the site consistency test, the method consistency test, the total rank differences test, the total score test, the sensitivity test, and specificity test. These tests evaluated different aspects of each HSID method’s performance. For example, the site consistency test measures the method’s efficiency in identifying sites that show a consistently poor safety performance. The method consistency test measures the efficiency of the HSID methods in terms of the number of the same hotspots identified in subsequent time periods.
The AHP method showed that the total rank differences test performs better than the other tests. The total rank differences test was followed by the following tests: the total score test, the sensitivity test (ST1), specificity test (ST2), method consistency test, and site consistency test. Based on the AHP method, the EB method performed better than the other HSID methods. The AHP method and test results highlight that the EB method is the most consistent and reliable method for identifying priority investigation locations. In the study, the AF, AR, and combined
criteria gave the same results. The societal based-risk and EPDO methods were largely inconsistent. The societal based-risk method performed worst in all of the tests. Overall, these results are consistent with the results of previous studies in identification EB method as most consistent method.
Identification of engineering countermeasures that have the potential of crash reduction was successful in all of the hotspots identified with the EB method; this shows that the method which identifies hotspots can also be correct.
Study results are very significant and are consistent with earlier findings. To gain more confidence in the benefits of the EB method, the study should be replicated in other countries. Nevertheless, these study results, combined with previous research results, strongly suggest that the EB method should be the standard approach in the identification of crash hotspots.
Moreover, to ensure that which of the test is the most appropriate test to determine the most consistent HSID method, you can use other multivariate decision methods.
Table 6. Comparative analysis of hotspot identification methods based on AHP method
Accident Frequency (AF)
(1*0.477)+(2*0.648)+(2*1)+(2*0.879)+(3*0.705)+(3*0.659)=9.623
Accident Rate (AR)
(1*0.477)+(2*0.648)+(2*1)+(2*0.879)+(3*0.705)+(3*0.659)=9.623
P-Value
(3*0.477)+(2*0.648)+(3*1)+(3*0.879)+(2*0.705)+(2*0.659)=11.092
EPDO (PIARC)
(5*0.477)+(4*0.648)+(5*1)+(5*0.879)+(5*0.705)+(1*0.659)=15.964
Combined Criteria
(1*0.477)+(2*0.648)+(2*1)+(2*0.879)+(3*0.705)+(3*0.659)=9.623
Empirical Bayes (EB)
(2*0.477)+(1*0.648)+(1*1)+(1*0.879)+(1*0.705)+(4*0.659)=6.822
9. References
- Akbari, M. E., Naghavi, M. and Soori, H. (2006) ̏ Epidemiology of death from injuries in the Islamic Republic of Iran ̋. East Mediterr Health Journal, Vol. 12, No. 3-4, pp.382-390.
- Cheng, W. qand Washington, S. (2005) ̏ Experimental evaluation of hotspots identification methods ̋. Accident Analysis and Prevention, Vol. 37, No. 5, pp. 870-881.
- Cheng, W. and Washington, S. (2008) ̏ New criteria for evaluating methods of identifying Hotspots ̋. Transportation Research Record. TRB, National Research Council, Washington, DC, No. 2083, PP. 76-85.
- Dey, P. K. and Ramcharan, E.K. (2008) ̏ Analytical Hierachy Process helps select site for limestone quarry expansion in Barbodos ̋, Journal of Environmental Management, Vol. 88, No. 4, pp. 1384-1395.
- Elvik, R. (2008) ̏ Comparative analysis of techniques for identifying hazardous road locations ̋, Transportation Research Record, TRB, National Research Council, Washington, DC, No. 2083, PP. 72-75.
- Hatamabadi, H. R., Vafaee, R., Hadadi, M., Abdalvand, A., Esnaashari, H. R. and Soori H. (2011) ̏ Epidemiologic study of road traffic injuries by road user type charactrristics and road environment in Iran: A community based approach ̋. J Traffic Injury Prevention, Vol.13, No. 1, pp. 61-64.
- Lyon, C., Gotts, B., Wong, W .K. F. and Persaud, B. (2007) ̏ Comparison of alternative methods for identifying sites
with high proportion of specific accident types ̋. Transportation Research Record, TRB, National Research Council, Washington, DC, No. 2019, pp. 212-218.
- Montella, A. (2010 ̏( A comparative analysis of Hotspots Identification Method ̋, Accident Analysis and Prevention, Vol. 42, No 2, pp. 571-581.
- National Safety Council (2009) ̏ Estimating the costs of motor vehicle injuries ̋. http://www.nsc.org/news_resources/injury_ and_death_statistics/pages/EstimatingtheC ostsofUnintentionalInjuries.aspx (accessed 08.01.13).
- Ozer, I. (2007) ̏ Multi-Criteria Group Decision Marking method using AHP and Integrated Web-Based Decision support system “, MSc. Thesis, University of Ottawa, Canada.
- Persaud, B., Lyon, C. and Nguyen, T. (1999) ̏ Empirical Bayes procedure for ranking sites for safety investigation by potential for improvement ̋. Transportation Research Record, 1665. TRB, National Research Council, Washington, DC, No. 1665, pp. 7-12.
- PIARC (2004) ̏ Road Safety Manual ̋, World Road Association, Technical Committee On Road Safety C13.
- Qu, X. and Meng, Q. (2014) ̏ A note on hotspots identification for urban expressways “, Safety Science, Vol. 66, No. 2273, pp. 87-91.
- ROSPA (2002) ̏ Road safety engineering manual ̋, The Royal Society for Prevention of Accidents, Birmingham.
15 International Journal of Transportation Engineering, Vol.6/ No.1/ Summer 2018 European Journal of operation Research,
Vol. 74, No. 3, pp. 407-419.
- Shyur, H. I. and Shih, H. S. (2006) ̏ A hybrid MCDM model for strategic Vendor selection “, Mathematical and Computer modelling. Vol. 44, No. 7-8, pp. 749-761.
- TAC (2004) ̏ The Canadian guide to In-Service road safety reviews ̋, Transportation Association of Canada, Ottawa.
- Tarko, A. P. and Kanodia, M. (2004) ̏ Hazard elimination program. manual on improving safety of Indiana road intersections and sections”, Report FHWA/IN/JTRP2003/19, West Lafayette, Indiana.
- Vargas., Luis G. (1994) ̏ Reply to Schenkerman avoiding rank reversal in
AHP decision support model ̋. European Journal of operation Research, Vol.74, No. 3, pp. 420-425.
- World Health Organization (2009) ̏ Global status report on road safety: time for action ̋. World Health Organization. Geneva. Website: www.who.com
- Washington, S., Haque, M. M., Oh, J. and Lee, D. (2014) ̏Applying quantile regression for modeling equivalent property damage only crashes to identify accident Black-Spots ̋, Accident Analysis and Prevention, Vol. 66, No. 3, pp. 136-146.
- Yu, H., Liu, P., Chen, J. and Wang, H. (2014) ̏ Comparative analysis of the spatial analysis methods for Hotspots identification ̋, Accident Analysis and Prevention, Vol. 66, No.3, pp.80-88.