Please cite this article as: M. Kabiri Naeini, Z. Elahi, A Queuing Model for Stochastic Location-inventory Problem with Waiting Cost Considerations, International Journal of Engineering (IJE), IJE TRANSACTIONS C: Aspects Vol. 31, No. 6, (June 2018) 959-966
International Journal of Engineering
J o u r n a l H o m e p a g e : w w w . i j e . i rA Queuing Model for Stochastic Location-inventory Problem with Waiting Cost
Considerations
M. Kabiri Naeini*a, Z. Elahib
a Department of Industrial Engineering, Faculty of Engineering, Payame Noor University, Yazd, Iran b Department of Industrial Engineering, Payame Noor University,Tehran, Iran
P A P E R I N F O
Paper history:
Received 14 August 2017
Received in revised form 02 December 2017 Accepted 04 February 2018
Keywords:
Location-inventory Problem Queuing Theory
Inventory Control Integrated Supply Chain
A B S T R A C T
This paper presents a three-level supply chain model which includes single supplier, several distribution centers and sets of retailers. For this purpose, by adopting the queuing approach, a mixed nonlinear integer programming model is formulated. The proposed model follows minimizing the total cost of the system by determining: 1) the number and location of distribution centers between candidated ones; 2) the possibility of allocating each of the retailers to the distribution centers; 3) the amount of retailers demand; and 4) the policy of distribution centers. In the proposed model, the cost of waiting in queue is also considered. In order to make the problem more realistic, we consider uncertain demand and lead-time, which follow Poisson and Exponential distributions, respectively. Hence, we applycontinuous-time Markov process approach to obtain the amount of annual ordering, purchase and inventory. Then, the results are used to formulate the location-inventory problem. Finally, the proposed model is solved using GAMS software version 24.1.3.
doi: 10.5829/ije.2018.31.06c.13
1. INTRODUCTION1
A supply chain is a network of suppliers, factories, DCs, retailers and customers through which raw materials are acquired, transformed and delivered to customers in order to minimize (maximize) cost (profit) of the total chain. Thus, supply chain management plays an essential role in reducing the total costs of companies and improving competitive conditions. Supply chain management is considered as a set of strategic, tactical, and operational decision-making functions, which optimizes supply chain performance. The strategic level describes the supply chain network by selecting suppliers, transportation routes, manufacturing facilities, production levels, warehouses, etc. The tactical level plans and schedules the supply chain to meet actual demand while the operational level executes plans. Tactical and operational level decision-making functions are normally distributed across the supply chain [1]. In a competitive market, companies eagerly
*Corresponding Author’s Email: [email protected] (M. Kabiri Naeini)
try to reduce costs in order to ensure higher profits. Therefore, if the supply chain for a certain company adds more cost than value to the product, then the company will face an issue in expanding or even surviving in the market [2].
the one hand, in the location models, the focus is on the development of models to determine the optimal DCs and their locations as well as to allocate customers to
each DC. The models attempt to minimize
establishment and allocation costs; however, the inventory shortages are ignored. On the other hand, the cost of transportation in location models is dependent on the frequency of orders at different facilities that is a function of inventory policy. Similarly, in the inventory issues, the cost of inventory at each facility is dependent on the amount of order that can be assigned, and this assignment needs information regarding the allocation of demand nodes to each facility.
The interaction between the location policies and inventory indicates that an integrated model, taking the costs of transportation, inventory, and construction into account, is required to solve these problems. Nevertheless, the joint problems considering facility location and inventory control decisions have been mathematically modeled [6]. This paper presents a joint location-inventory model consisting of a supplier, multiple Distribution Centers (DCs) and retailers. In other words, the problem determines four different decisions: 1) the number and location of distribution centers between candidate ones; 2) the possibility of allocating each of the retailers to the distribution centers; 3) the amount of retailers’ demand; and 4) the policy of distribution centers.
In the proposed model, the cost of waiting in queue was also considered. In order to make the problem more realistic, we consider uncertain demand and lead-time, which follow Poisson and Exponential distributions, respectively. Hence, we apply continuous-time Markov approach to obtain the amount of annual ordering, purchase, inventory. It is assumed that each opened DC has an (S – 1, S) inventory policy. According to (S – 1, S) inventory policy, if the inventory level is less than S either due to a demand or a failure, we place an order to bring the inventory level to S [7].
2. LITERATURE REVIEW
Strategic decisions of facility location can be influenced by tactical decisions like inventory decisions. Location policies (i.e., long-term or medium-term policies) and inventory policies (i.e., short term or medium-term policies) must be considered in distribution networks. As a result, the models known as location-inventory models have been presented, which simultaneously have minimized the costs, inventory, and locations. The idea of combining inventory cost in the location model has been firstly introduced by Baumol and Wolfe [8]. A two-level supply chain network with uncertain demand has been presented by Shu et al, [9]. Kaya and Urek [10],
for location, inventory, and pricing decisions in a closed loop supply chain and have found an upper bound for the objective function of the proposed model. Finally, they have presented three different metaheuristics algorithms for solving the mathematical model.
An integrated stochastic supply chain model with uncertain demand and lead-time was formulated by Jabal Ameli et al. [11]. They assumed that in order to reach a certain service level for the customers, each DC has a certain amount of safety stock and presented a nonlinear integer-programming model to address this problem. They solved their model by a hybrid algorithm. Mak and Shen [12] analyzed a location–allocation problem with service constraints and stochastic demand. In their research, manufacturing process was modeled as a queuing system in order to optimize the base stock levels and to determine the location of DCs and allocation of customers to DCs simultaneously. Authors formulated the problem as an MINLP model to minimize the total expected cost of the system. They also developed a Lagrangian heuristic to solve the model.
Schwarz et al. [13] examined an M/M/1 queuing system with unrestricted capacity and proposed the first closed form solutions for service facilities with attached inventories and stochastic lead times. A single server queuing system with inventory control was studied by Krishnamoorthy et al. [14]. They thought that customers refer to retailers according to a Poisson process and inventory is refilled according to an (S, s) policy with zero lead-time. Additionally, they considered that the server is interrupted according to a Poisson process and is repaired at an exponential rate.Saffari et al. [15] handled an M/M/1 queue with inventoried items for service. Continuous review (R, Q) policy was assumed for the inventory system and lead-times were considered to be
exponentially distributed. Krishnamoorthy and
Viswanath [16] investigated an(S, s) production-inventory system and presented an explicit product form solution for the steady-state probability vector, using a simple approach. The motivation behind their work comes from the paper of Schwarz et al. [13]. Berman et al. [17] proposed an integrated location-inventory problem with a periodic-review (R, S) inventory policy at each DC. Two types of coordination were introduced: partial coordination, where each DC may choose its own review interval and full coordination, where all DCs have a similar review interval. The problem was formulated as a nonlinear integer-programming model and a Lagrangian relaxation algorithm was presented to solve it.
(GA) was developed to solve it
.
Ghomi-Avili et al. [19] develops a model for the closed-loop supply chain network design with disruption risk. By considering supply disruption, two factors including extra inventory and lateral transshipment are used as resilience strategies. A two-stage stochastic approach is implemented to tackle uncertainty. The model is solved by GAMS 24.3/CPLEX and with random data. The simple and powerful reduce and optimize approach (ROA) was used to solve the multi-product multi-period inventory lot sizing with supplier selection problem presented by Cárdenas-Barrón et al. [20]. According to the computational results, the developed heuristic algorithm outperformed the CPLEX MIP solver in both solution quality and computational time. Cárdenas-Barrón and Treviño-Garza. [21] presented a more general integer linear programing (ILP) model for a three echelon supply chain network (SCN). Their proposed ILP model reduced to the proposed model by Kadadevaramath et al. They showed that all instances proved in Kadadevaramath et al, can easily be solved optimally by any integer linear programming solver. The corrections made in corrigendum do not affect the contributions of main’spaper.Chen et al. [22] have investigated the problem of location-inventory, in which a built facility might have been interrupted with a known probability. They have proposed an integer-programming model for the problem and developed a method based on a Lagrange relaxation solution. Luo et al, [23] have studied an inventory allocation methodology for a supply chain consisting of a capacitated retailer with limited shelf space, and two unreliable capacitated suppliers in an uncertain environment. They provided both a closed-form solution and a heuristic method, and illustrate the bounds on the optimal solution. Finally, they showed that the cost function is L-convex in some cases. A queueing-based optimization model for planning inventory of repaired components in a service center was formulated by Srivathsan and Viswanathan [24]. They supposed modular products and a single-echelon service center for a particular component. They used continuous time Markov chain (CTMC) model to obtain the steady-state probabilities and expected queue length values, identify bounds on the decision variables, and utilize these bounds to develop algorithm that can determine the optimal maximum inventory level of repaired and faulty components to be kept and the optimal repair capacity. Diabat et al. [25] presented a joint location-inventory model for the network design of a supply chain with multiple Distribution Centers (DCs) and retailers. They formulated the problem as a nonlinear integer programming model. To solve the presented model for large size problems, a hybrid solution algorithm based on simulated annealing and direct search method was adopted.
3. MODEL DESCRIPTION
In this paper a three levels supply chain with single supplier, multiple distribution centers, and multiple retailers is studied. The problem is studied to examine four different decisions:
1) The optimal number and location of opened DC(s) 2) The best allocation of retailers to DC(s)
3) The amount of demand assigned to retailer(s) 4) The inventory policy of opened DC(s);
According to continuous-time Markov process if we divide the time into three parts: past, present and future periods, the future of this process does not depend on the path that has gone before, and only depends on its position in the present. The state of the system can be changed at any moment. The time is an exponential random variable and follows Exponential distribution. Based on continuous-time Markov process the amount of annual ordering, purchase, inventory and shortage are obtained. While uncertain demand and lead time are considered. Demand and lead time to arrange follow Poisson and Exponential distributions. The waiting time in the queue is also considered. There are some hypothesis. System assumptions are:
- Each retailer is assigned only to one DC. - Each DC has the demand which follows poisson distribution with parameter λ that equals the sum of demand rates of its assigned retailer(s).
- The lead-time is uncertain and is exponentially distributed with parameter μ.
- The studied three-level supply chain, includes a supplier, several opened DC(s) and sets of retailers. - Shortage is allowed.
- Time waiting time in queue is considered.
- Each opened DC orders to the supplier based on (S- 1, S) inventory policy.
- Eachopened distribution center provides demands of its allocated retailer(s) according to FIFO policy. - Each retailer supplies its demands only from opened DC. Distribution centers received their demands from suppliers.
4. MATHEMATICAL FORMULATION
To formulate the model we adopt the queuing approach based on Equations (1) and (2):
, ,
( ) (0)
,k r k k k
P i j t
p
N t j N i i j E (1)
lim
, ,
k t k
P j P i j t
(2)
The assumed continuous-time Markov process is based on the amount of inventory available at each opened distribution center and the distribution centers is assumed as servants. So the retailers refer to distribution centers for theirs demands. Therefore, according to rate diagram of continuous-time Markov process (Figure 1), equilibrium equations will be:
1
kP Sk k P Sk k
(3)
k
P jk k kP j
1 P jk( 1)j Sk 1 (4)
sin 1 :
k k j E
ce P j result
(5)
1 kk k
P S
(6)
1 1k S j
k k
k k
P j j S
(7)
Based on the policy of (S-1, S) for each opened distribution center and using backlogged shortage, the annual order quantity is equal to the amount of annual demand:
k k
R (8)
The expected annual shortage quantity:
Each retailer is faced with a shortage when level of inventory in each opened distribution centers becomes less than or equal to zero. So annual shortage quantity in each distribution center can be determined by Equation (9):
( ) ( 0)
K
k k k k
S k P X
(9)
The expected annual Purchase quantity: Based on the policy of (S-1, S) in each opened distribution center with shortage, the annual purchase amount is the annual order quantity as Equation (10):
(10)
The expected inventory quantity: Let us introduce these notations:
I: Inventory level (a random variable)
X: The amount of demand in lead-time (a random variable)
B: The amount of shortage in lead-time (a random variable)
S: Base stock level.
Inventory position = inventory hand + inventory on-order – backon-order level.
Based on (S– 1, S) policy, the inventory position is always kept at the base stock level. Also, the inventory on-order/ backorder level equals to the amount of demand in lead-time/ amount of shortage in a lead-time. So the expected inventory quantity could be found through Equations (11) to (16):
S I X B (11)
E I S E X E B (12)
k k
I S E X E B (13)
kE X
(14)
Skk k
k
E B
(15)
k S
k k
k k
I S
(16)
Let us define notations used in the stochastic location inventory problem:
Sets:
K set of potential DCs I set of retailers Parameters:
CK unit purchase cost of DC( k) from the supplier (∀k∊k)
πk unit shortage cost at DC(k) (∀k∊k)
FK fixed (per unit time) cost of openin DC( k) DC( k)
(∀k∊k)
Tki unit transportation cost from DC( k) to to retailer i
(∀k∊k) (∀i∊I)
AK unit ordering cost at DC( k) (∀k∊k) hk unit holding cost at DC( k) (∀k∊k)
Wk waiting time of demands in queue at DC(k) (∀k∊k) Di demand rate (Poisson) at retailer i (∀i∊I)
λΚ demand rate at DC(k) (∀k∊k) μ exponential parameter of lead-time
Decision variables:
k k
P
Now, the performance measures of the system in the steady-state condition are:
1 if demand at retailer i are assigned toDC( k), 0 otherwise (∀k∊k) (∀i∊I)
yki
base stock level maintained at DC(k) (∀k∊k) Inteager
Sk
Therefore, according to the results of queuing analysis we can formulate as a MINLP model as below:
Min z=
K K ki ki i
k k k k i I
F Z T y D
[
k
S
k k
k K k
k k
h Z S
k S k kZK k
Ak Ck
kZK] K K
K Z W
(17)
s.t: 1 ki k k
y i I
(18),
ki K
y Z i I k K (19)
ki i k i I
y D k K
(20)k
k
K
(21)
0,1K
Z k K (22)
0,1 ,ki
y k K i I (23)
0 k
S Integer k K (24)
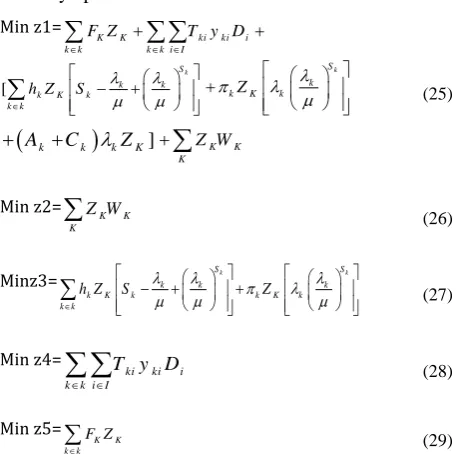
So the stochastic location-inventory problem is formulated. As Equation (17) indicates, the objective function follows minimizing the fixed cost of locating opened distribution centers, transportation cost from distribution centers to retailer, the annual inventory costs including the holding, ordering, shortage and purchase costs, also the cost of waiting time in queue. Constraints 18-24 state as follows:
Constraint 18: Each retailer directly allocated to one opened distribution center.
Constraint 19: Each retailer can be only allocated to the distribution center which is open.
Constraint 20: The demand of each distribution center is equal to the sum of Poisson rate(s) of its assigned retailer(s).
Constraint 21: The limits of stability and reliability inventory system in each opened distribution center is showed. In fact, if demand is greater than μ in any opened distribution centerthe system will be in shortage forever.
Constraints 22, 23: Binary variables are introduced. Constraints 24: Integervariable is introduced.
5. COMPUTATIONAL RESULTS
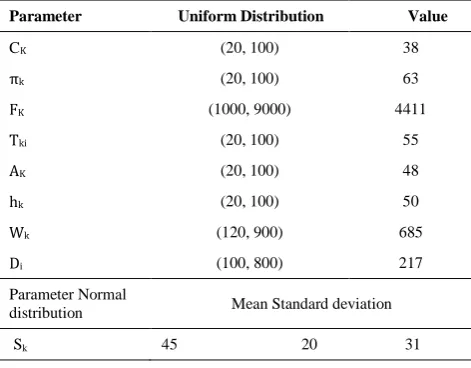
The problem is solvable using GAMS 24.1.3 software and run on a system equipped with Intel (R) Core (TM) i5-3210 M CPU @ 2.50 Hz with 2.00 GB RAM and DICOPT solver (CPLEX for MIP and KNITRO for NLP). To obtain the exact result, GAMS was selected. We present a numerical example in which the parameters follow a random and normal uniform distribution, which their ranges are in the second column and the random number in the third column. Distribution of parameters is presented in Table 1. Some test problems were designed considering different numbers of DCs and retailers. The results are reported in Table 2 and Figures 2 and 3.
TABLE 1. Distribution of parameters
Parameter Uniform Distribution Value
CK (20, 100) 38
πk (20, 100) 63
FK (1000, 9000) 4411
Tki (20, 100) 55
AK (20, 100) 48
hk (20, 100) 50
Wk (120, 900) 685
Di (100, 800) 217
Parameter Normal
distribution Mean Standard deviation
Sk 45 20 31
TABLE 2. Computational results for test problems
Size Ζ1 Ζ2 Ζ3 Ζ4 Ζ5 Solution type
2*5 51105.5202 370.167 38.078 16232.729 2075.7359 l
3*3 92827.2686 189.7934 49.7812 46005.868 3366.4126 b
4*3 123868.0752 571.8764 52.4753 44973.703 7837.6080 b
4*4 130259.8660 436.9080 31.5214 54190.673 4230.7971 b
5*4 99654.7162 420.4771 33.2861 49150.215 4251.4611 b
5*5 96319.5482 467.4584 29.5368 44635.605 5376.9348 b
6*5 146259.5041 272.0774 59.9707 83543.990 4686.2408 b
The parameters in columns and rows of Table 2 indicate as below:
b: best solution found.
l: locally optimal solution found. Min z1=
K K ki ki i
k k k k i I
F Z T y D
[
k S
k k
k K k k k
h Z S
kS k kZK k
Ak Ck
kZK] K K
K
Z W
(25)
Min z2= K K
K
Z W
(26)Minz3= Sk Sk
k k k
k K k k K k
k k
h Z S Z
(27)Min z4=
ki ki i k k i I
T y D
(28)Min z5=
K K
k k F Z
(29)Figure 2 is the clustered column chart that indicates the costs amount for each problem size.
Figure 2. problem size and cost amount
In problem size n*m, n indicates the number of DCs and m indicates the number of retailers. Figure 3 is the stacked column chart that shows the share of each cost on each problem size.
6. CONCLUSION
In this paper a stochastic location-inventory problem was studied. we considered three-level supply chain network, that includes: a single
supplier, multiple distribution centers (DCs) and multiple retailers. Of course the locations of the supplier and retailers are known. The results of the model are 1) the number and location of DC(s) 2) the best allocation of retailers to DC(s) 3) the amount of demand of retailers who responded 4) the inventory policy of opened DC(s).
We have a MINLP problem and the proposed model tries to minimize the total cost of the location, transportation, waiting time and inventory. To get a real world situation, we considered other aspects of the uncertainty associated the inventory problem. In other words, we considered uncertain demand and lead-time, which follow Poisson and Exponential distributions respectively. Also waiting time is considered. Therefore, a queuing approach to determine the annual order quantity, purchase and shortage, and the average balance of steady state conditions have been implemented. So based on the results, the problem is formulated. The model is solved using GAMS. The results indicated that the maximum cost in each combination of distribution centers and retailers is the cost of transportation and after that, the fixed cost. The best allocation is relating to size 2*5.
There are a number of issues recommended for future research:
- It can be assumed other inventory policies.
- The model could be extended for multi products and multi periods problems.
- It can be assumed that each retailer supplies its demands from multiple opened DCs.
7. REFERENCES
1. Fox, M.S., Barbuceanu, M. and Teigen, R., Agent-oriented supply-chain management, in Information-based manufacturing. 2001, Springer.81-104.
2. Diabat, A., Abdallah, T. and Le, T., "A hybrid tabu search based heuristic for the periodic distribution inventory problem with perishable goods", Annals of Operations Research, Vol. 242, No. 2, (2016), 373-398.
3. Friesz, T.L., Lee, I. and Lin, C.-C., "Competition and disruption in a dynamic urban supply chain", Transportation Research
20 100 500 2500 12500 62500 312500
C
o
st
s
Am
o
un
t
Problem Size n*m
z1 z2 z3 z4 z5
2*5 3*3 4*3 4*4 5*4 5*5 6*5 6*6
20 80 320 1280 5120 20480 81920
C
o
st
s
Am
o
un
t
Problem Size n*m
z5 z4 z3 z2
4. Nekooghadirli, N., Tavakkoli-Moghaddam, R., Ghezavati, V.R. and Javanmard, S., "Solving a new bi-objective location-routing-inventory problem in a distribution network by meta-heuristics",
Computers & Industrial Engineering, Vol. 76, (2014), 204-221.
5. Le, T., Diabat, A., Richard, J.-P. and Yih, Y., "A column generation-based heuristic algorithm for an inventory routing problem with perishable goods", Optimization Letters, Vol. 7, No. 7, (2013), 1481-1502.
6. Miranda, P.A. and Garrido, R.A., "Incorporating inventory control decisions into a strategic distribution network design model with stochastic demand", Transportation Research Part E: Logistics and Transportation Review, Vol. 40, No. 3, (2004), 183-207.
7. Kalpakam, S. and Shanthi, S., "A perishable inventory system with modified (s− 1, s) policy and arbitrary processing times",
Computers & Operations Research, Vol. 28, No. 5, (2001), 453-471.
8. Baumol, W.J. and Wolfe, P., "A warehouse-location problem",
Operations Research, Vol. 6, No. 2, (1958), 252-263.
9. Shu, J., Ma, Q. and Li, S., "Integrated location and two-echelon inventory network design under uncertainty", Annals of Operations Research, Vol. 181, No. 1, (2010), 233-247. 10. Kaya, O. and Urek, B., "A mixed integer nonlinear
programming model and heuristic solutions for location, inventory and pricing decisions in a closed loop supply chain",
Computers & Operations Research, Vol. 65, (2016), 93-103.
11. Ameli, M.S.J., Azad, N. and Rastpour, A., "Designing a supply chain network model with uncertain demands and lead times",
Journal of Uncertain Systems, Vol. 3, No. 2, (2009), 123-130. 12. Mak, H.Y. and Shen, Z.J.M., "A two‐echelon inventory‐location
problem with service considerations", Naval Research Logistics (NRL), Vol. 56, No. 8, (2009), 730-744.
13. Schwarz, M., Sauer, C., Daduna, H., Kulik, R. and Szekli, R., "M/m/1 queueing systems with inventory", Queueing Systems, Vol. 54, No. 1, (2006), 55-78.
14. Krishnamoorthy, A., Nair, S.S. and Narayanan, V.C., "An inventory model with server interruptions", in Proceedings of the 5th International Conference on Queueing Theory and Network Applications, ACM, (2010), 132-139.
15. Saffari, M., Haji, R. and Hassanzadeh, F., "A queueing system with inventory and mixed exponentially distributed lead times",
The International Journal of Advanced Manufacturing Technology, Vol. 53, No. 9-12, (2011), 1231-1237.
16. Krishnamoorthy, A. and Viswanath, N.C., "Stochastic decomposition in production inventory with service time",
European Journal of Operational Research, Vol. 228, No. 2, (2013), 358-366.
17. Berman, O., Krass, D. and Tajbakhsh, M.M., "A coordinated location-inventory model", European Journal of Operational Research, Vol. 217, No. 3, (2012), 500-508.
18. Maleki, L., Pasandideh, S.H.R., Niaki, S.T.A. and Cárdenas-Barrón, L.E., "Determining the prices of remanufactured products, capacity of internal workstations and the contracting strategy within queuing framework", Applied Soft Computing, Vol. 54, (2017), 313-321.
19. Ghomi-Avili, M., Tavakkoli-Moghaddam, R., Jalali, G. and Jabbarzadeh, A., "A network design model for a resilient closed-loop supply chain with lateral transshipment", International Journal of Engineering-Transactions C: Aspects, Vol. 30, No. 3, (2017), 374-383.
20. Cárdenas-Barrón, L.E., González-Velarde, J.L. and Treviño-Garza, G., "A new approach to solve the product multi-period inventory lot sizing with supplier selection problem",
Computers & Operations Research, Vol. 64, (2015), 225-232. 21. Cárdenas-Barrón, L.E. and Treviño-Garza, G., "Corrigendum to
“an optimal solution to a three echelon supply chain network with multi-product and multi-period”[applied mathematical modelling, 38 (5–6), 1911–1918]", Applied Mathematical Modelling, Vol. 5, No. 40, (2016), 4268-4269.
22. Chen, Q., Li, X. and Ouyang, Y., "Joint inventory-location problem under the risk of probabilistic facility disruptions",
Transportation Research Part B: Methodological, Vol. 45, No. 7, (2011), 991-1003.
23. Luo, K., Bollapragada, R. and Kerbache, L., "Inventory allocation models for a two-stage, two-product, capacitated supplier and retailer problem with random demand",
International Journal of Production Economics, Vol. 187, (2017), 168-181.
24. Srivathsan, S. and Viswanathan, S., "A queueing-based optimization model for planning inventory of repaired components in a service center", Computers & Industrial Engineering, Vol. 106, (2017), 373-385.
A Queuing Model for Stochastic Location-inventory Problem with Waiting Cost
Considerations
M. Kabiri Naeinia, Z. Elahib
a Department of Industrial Engineering, Faculty of Engineering, Payame Noor University, Yazd, Iran b Department of Industrial Engineering, Payame Noor University,Tehran, Iran
P A P E R I N F O
Paper history:
Received 14 August 2017
Received in revised form 02 December 2017 Accepted 04 February 2018
Keywords:
Location-inventory Problem Queuing Theory
Inventory Control Integrated Supply Chain
هديكچ
یم حرطم یحطس هس نیمأت هریجنز لدم کی ،هلاقم نیا رد نیمأت کی لماش هک دوش
وت زکارم نیدنچ ،هدننک م و عیز
هعومج ا یا ز
هدرخ یم ناشورف حیحص ددع لدم کی فص درکیور ذاختا اب روظنم نیا هب .دشاب یطخریغ
یم هلومرف یبیکرت اب لدم .دوش
یم لیذ ریداقم نییعت لابند هب ،متسیس لک هنیزه ندرک هنیمک فده :دشاب
1
ناکم و دادعت نییعت ) کارم
ناکم نیب زا هک یشخپ ز
؛دنوش حاتتفا دیاب دیدناک یاه
2
هدرخ زا کی ره صیصخت ناکما یسررب ) ؛عیزوت زکارم هب ناشورف
3
عت ) زا ییاضاقت رادقم نیی
هدرخ و ؛دوش هداد خساپ هک شورف
4
تنا هنیزه ،هدش هئارا لدم رد .عیزوت زکارم یدوجوم تسایس نییعت ) زین فص رد راظ
د ر
تفرگ رظن یم ه نینچمه .دوش و دربشیپ نامز
رادقم رظن رد یلامتحا تروص هب ود ره اضاقت گ
یم هتفر زوت زا بیترت هب هک دوش عی
یم یوریپ نوساوپ و ییامن .دننک
یفوکرام فص درکیور ساسا رب یفداصت یاهرتماراپ تروص هب تیعطق مدع ب
هتسویپ نامز ا
و هدش حرطم ،دیرخ نازیم ،هنایلاس شرافس رادقم
حم درکیور نیا زا هدافتسا اب یدوجوم و دوبمک نازیم یم هبسا
ا رد .ددرگ اهتن
رازفا مرن زا هدافتسا اب هدش هئارا لدم
GAMS
هخسن
24.1.3
یم لح دوش
. doi: 10.5829/ije.2018.31.06c.13