DOI: 10.7324/JAPS.2020.104016 ISSN 2231-3354
Development and validation method for simultaneous quantification
of neomycin and polymyxin B by HPLC-ELSD and comparison with
microbiological method
Henny Setiawati*, Harmita Harmita, Herman Suryadi Faculty of Pharmacy, Universitas Indonesia, Depok, West Java, Indonesia.
ARTICLE INFO Received on: 25/11/2019 Accepted on: 17/01/2020 Available online: 04/04/2020
Key words:
Antibiotics, evaporative light scattering detector, neomycin, polymyxin B.
ABSTRACT
The aim of this study is to develop the first simultaneous method for quantification of neomycin and polymyxin B in the presence of dexamethasone using High Performance Liquid Chromatography (HPLC) with an Evaporative Light Scattering Detector (ELSD). The analysis was performed using a phenyl Waters X Bridge column, an evaporation temperature of 50oC, and a nitrogen pressure of 320 kPa. The mobile phase consists of a combination of methanol
and trichloroacetate acid (40 mM, pH 1.70–1.80) in gradient mode, flow rate at 1.0 ml/minute, detector gain of 6, and analysis time of 35 minutes. The linearity was achieved with a concentration of 100–500 µg/ml (r = 0.99955) for neomycin and concentration of 30–100 µg/ml (r = 0.99703) for polymyxin B. Recovery results were obtained between 99.150% and 104.773% for neomycin and 96.538% and 105.139% for polymyxin B. The analysis sample from the market was found to be 102.27% for neomycin and 100.79% for polymyxin B. The result was compared to the standard microbiological method. Based on the T-test results of two samples with a 95% confidence level (α = 0.05), it was concluded that there was no significant difference between HPLC-ELSD and microbiological methods for determining neomycin and polymyxin B. The HPLC-ELSD method has a potential for routine analysis due to advantages in terms of increasing precision, accuracy, and shorter testing time.
INTRODUCTION
Microbiological antibiotic tests and chemical tests have shown several advantages and disadvantages (Lotfipur et al., 2010). Microbiological methods and High Performance Liquid Chromatography (HPLC) can be used to evaluate the determination of antibiotics (Queiroz et al., 2009). Quantification of antibiotics by chemical methods, such as HPLC, provides several benefits, such
as accurate, possibility of automation, lower Relative Standard
Deviation (RSD) values, and shorter analysis time, and some
chemical methods have replaced microbiological tests but cannot
show biological activity (Christ et al., 2015). Biological methods have several advantages over methods such as HPLC and UV
spectrophotometry, such as low equipment costs, but microbiological
testing results are more varied due to biological factors, longer
testing times and cannot for evaluating impurities (Christ et al., 2015; Hanko and Rohrer, 2010;Manfio et al., 2013; USP 40, 2017).
The combination of antibiotics and dexamethasone in
liquid formulations is widely used for the treatment of eye infections. According to United State Pharmacopoeia (USP), neomycin sulfate
and polymyxin B sulfate were analyzed by the microbiological
method (USP, 2017). Neomycin is an aminoglycoside class of antibiotics that has a broad spectrum. Neomycin sulfate currently is
available in many brands of creams, ointments, and other products both alone and in combination with polymyxin, other antibiotics, and various corticosteroids. Polymyxin B consists of polymyxin
B1, B2, B3, and B1-I. Polymyxin B sulfate is available in eye drops
and topical use in combination with various other compounds
(Goodman and Gilman, 2011).
Neomycin has a lack of chromophore, so if analyzed by HPLC UV detectors require derivatization steps (Tsuji and
Jenkins, 1986). Another method is by ion pair chromatography
*Corresponding Author
Henny Setiawati, Faculty of Pharmacy, Universitas Indonesia, Depok, West Java, Indonesia.
E-mail: setiawati.henny @ gmail.com
using the reverse phase method then post-column derivatization
using o-phthalaldehyde (Shaikh et al., 1991). However, the derivatization procedure is difficult because the process is complicated and causes problems for quantitative analysis (Pendela et al., 2004).Quantification of neomycin in sample without derivatization was developed, such as HPLC-Pulsed Amperometric Detector or Evaporative Light Scattering Detector (ELSD) or mass spectrometry (Farouk et al., 2015). Polymyxin B sulfate can be quantified using HPLC detector UV–Vis at a wavelength of 215 nm (Ph. Eur., 2014).
ELSD detectors are gaining popularity due to its ability to detect analytes on non-selective basis. ELSD especially used for analytes without chromophores. The stages in ELSD include three
different stages that need to be optimized to achieve low noise, sensitive, and repeatability. The three stages are nebulization,
evaporation, and optical detection. Some advantages of ELSD are universal detectors that do not absorb UV, fluorescence, or electrochemical detection without derivatization (Corradini, 2011;
Liu et al., 2017; Scheidl et al., 2009).
For routine analysis in quality control laboratories, simultaneous methods are required for both components. The
aim of this study is to develop a method for both antibiotics with the presence of dexamethasone which is commonly found in the
market using an ELSD detector. In this study, we compared the
validated method above and microbiology method as a standard procedure in pharmacopoeia.
MATERIALS AND METHODS Instrument and apparatus
Chromatographic analysis was carried out by Shimadzu prominence series modular LC system (Kyoto, Japan) consisting of DGU-20A5 vacuum degasser and LC-20AD pump with SIL-20 A HT autosampler unit. The detector used is Shimadzu ELSD-LT II. The nebulizing gas was nitrogen produced with Peak Scientific Generator (Scotland, UK). The column used is phenyl Waters X-Bridge (compatible with pH 1–10) with a column length of 150 mm, internal diameter of 4.6 mm, particle size of 5 μm, and measurement of mobile phase pH using Mettler Toledo (Ohio, USA). Reagents and reference standards
LC grade solvents such as Methanol (Merck, Darmstadt, Germany); water (Millipore Purification System, MA) are used. Analytical grade reagent is trichloroacetic acid (TCA) (Merck, Darmstadt, Germany). Reference standards are neomycin sulfate (Indonesian Pharmacopoeia Reference Standard, neomycin base 730.48 IU/mg), polymixin B sulfate (Sigma Aldrich, St. Louis, MO; purity 89.1%), and dexamethasone (Indonesian Pharmacopoeia Reference Standard; purity 99.89%).
Sample
Sample eye drops were purchased from Sanbe Farma, Indonesia.
Procedure
i. Chromatographic conditions
The mobile phase consists of a combination of methanol
and TCA (40 mM, pH 1.7–1.8). The pH of the mobile phase is
measured before use.
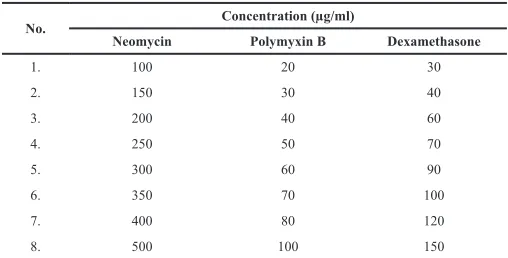
ii. Preparation of standard solutions
Neomycin and polymyxin B standards are accurately
weighed and dissolved with water to produce concentrations 2.5 mg/ml neomycin and 1.0 mg/ml polymyxin B. Dexamethasone standards are accurately weighed and dissolved with acetonitrile
to produce concentration 1.0 mg/ml. Each standard stock solution
was accurately taken and diluted with water to produce calibration
curve solution (Table 1). iii. Method Validation
The validation method was performed based on ICH Q2 (R1) (2005). The method was validated for specificity, linearity, accuracy, precision, limit of detection (LOD), limit of quantification (LOQ), and robustness.
Specificity
The specificity of the method is demonstrated by the
separation of neomycin, polymixin, and dexamethasone without any interference peak of the matrix or solvent.
Linearity
Linearity is used to observe the relationship that the test results are directly proportional to the concentration of analytes in
the sample in a given range. ELSD does not give a linear response
with the concentration, and a logarithmic transformation may be used.
Determining linearity and calibration curves were plotted
over a concentration range of 100–500 μg/mL for neomycin and 30–100 μg/ml for polymyxin B.
LOD and LOQ
LOD and LOQ can be calculated using the regression equation approach using the following formula (Harmita, 2009):
S y yi
n ( ) 2 y x 2
∑
= − − S b LOD 3 y x=
S b
LOQ 10 y x
=
Precision
Intraday and interday precision of the method were carried out by analyzing replicate solution on the day and different
Table 1. Concentration of calibration curve solution.
No. Concentration (µg/ml)
Neomycin Polymyxin B Dexamethasone
1. 100 20 30
2. 150 30 40
3. 200 40 60
4. 250 50 70
5. 300 60 90
6. 350 70 100
7. 400 80 120
consecutive days. The method precision is determined by the % RSD.
Accuracy
Accuracy is a measure that shows the degree of closeness of the analysis results with actual levels. The standard addition method was applied. In this study, recovery was performed in
triplicate at 80%, 100%, and 120%.
Robustness
This study examined the effect of changes in nitrogen
pressure (318, 320, and 322 kPa) on the concentration of the
analyte. The results were processed using one-way analysis of
variance (ANOVA) (α = 0.05). iv. Comparison of methods
The results obtained above were compared with the microbiological methods according to USP using the agar diffusion method. The results of neomycin sulfate and polymixin B sulfate from two methods were compared statistically using a two-sample T-test (α = 0.05).
v. Analysis of market samples
The HPLC and microbiology method used for the determination of samples (n = 6) from the market with different
batches.
vi. Statistical analysis
Data were processed with R studio statistical software
version 1.2.1335.
RESULTS AND DISCUSSION Optimization procedures
In this study, we used the phenyl column for the analysis. The phenyl column has high sensitivity to polar analyte. This column provided high separation and little tailing factor,
especially in polypeptide antibiotic compounds (He et al., 2018). TCA is used in the mobile phase in combination with methanol. In this study, TCA (40 mM) pH 1.7–1.8 is the optimum pH to
provide a good response to neomycin but reduce the possibility of column damage. This is consistent with previous research that the acidic mobile phase for analysis of neomycin has a pH of about
1.5 (Scheidl et al., 2009).
The HPLC procedure was optimized for neomycin
and polymyxin B with the presence of dexamethasone. A good resolution of three components was obtained by gradient mode
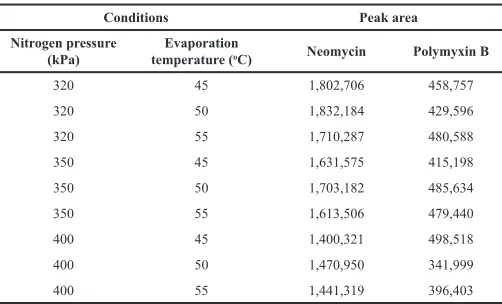
(Table 2). The parameters of the ELSD detector need to be
optimized to obtain good sensitivity and low noise. In this study, variations on nitrogen pressure and evaporation temperature
were examined. Nitrogen pressure variations were carried out at 320, 350, and 400 kPa. Temperature variations were carried out
at 45oC, 50oC, and 55oC. The influence of variations in nitrogen
pressure and evaporation temperature on ELSD response is shown
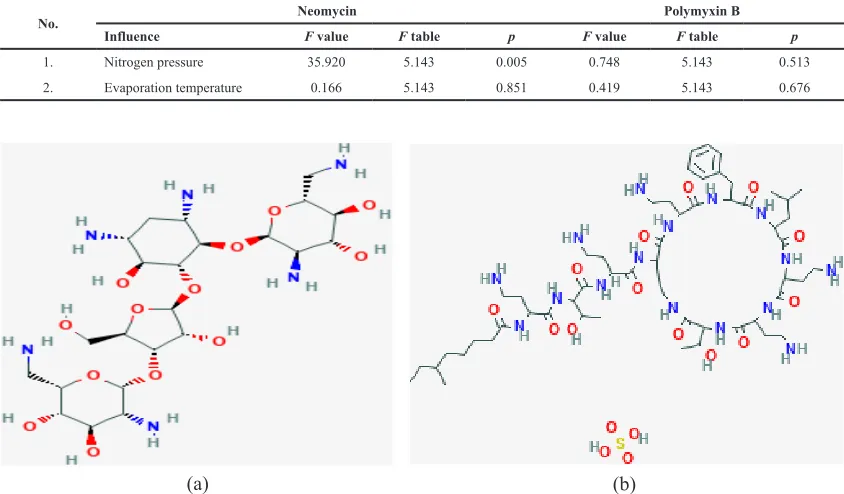
in Table 3. In this study, the nitrogen pressure has a significant influence on the peak area of neomycin while for polymyxin B it gives a relatively stable area. Evaporation temperature between 45
and 55oC gave a relatively stable area of neomycin and polymyxin
B. This is supported by the ANOVA test, which is listed in Table 4.
Method validation
Method validation was carried out using optimum conditions. The conditions were a nitrogen pressure of 320 kPa,
an evaporation temperature of 50oC, detector gain of 6, flow rate at
1.0 mL/min, and analysis time of 35 minutes with a combination
of mobile phases as in Table 2. Specificity
The specificity of this method is demonstrated by the
good separation of neomycin and polymyxin B in the presence
of dexamethasone (Figs. 2–4). The peak from matrix and solvent
was examined to assure that they do not interfere with neomycin and polymyxin B.
Linearity and range
For linearity, logarithmic transformation is used for the concentration of analyte and the response produced because the
ELSD detector does not provide a linear response between the
concentration and area. At low concentrations, analytes produce smaller particle size responses and at high concentrations give
large particle size responses (Koupparis et al., 2004; Scheidl et al., 2009). From the calculation, correlation coefficient (r) ≥ 0.997 and Vxo ≤ 5.0% for each analyte are obtained (Table 5).
LOD and LOQ
LOD and LOQ were obtained using the regression equation approach. LOD and LOQ were 11.744 and 39.145 μg/ ml for neomycin and 8.689 and 28.964 μg/ml for polymyxin B,
respectively. Precision
The results showed a relative standard deviation ≤ 2%
for both analytes. The results showed in Table 6.
Table 2. The HPLC gradient elution program.
Time Composition of mobile phase
0.00–15.50 Methanol—TCA (50:50) 15.51–25.00 Methanol—TCA (82.5:17.5) 25.01–35.00 Methanol—TCA (50:50)
Tabel 3. Influence of nitrogen pressure and temperature on ELSD response.
Conditions Peak area
Nitrogen pressure
(kPa) temperature (Evaporation oC) Neomycin Polymyxin B
320 45 1,802,706 458,757
320 50 1,832,184 429,596
320 55 1,710,287 480,588
350 45 1,631,575 415,198
350 50 1,703,182 485,634
350 55 1,613,506 479,440
400 45 1,400,321 498,518
400 50 1,470,950 341,999
Accuracy
The accuracy of the method is done by adding a certain number of standards to the sample, and then the value of recovery
is calculated. Both analytes meet the acceptance requirements. In
this study, the recovery results were obtained between 99.15%
and 104.77% (acceptance criteria 95%–105%) for neomycin and 96.54% and 105.14% (acceptance criteria 90%–107%) for
polymyxin B. Robustness
The results of determining the concentration of neomycin
and polymyxin B with nitrogen pressure modification (318, 320, and 322 kPa) are obtained. Data were processed by one-way ANOVA test (α = 0.05) (Table 7). It can be concluded that the levels
of neomycin and polymyxin B were not affected by these changes.
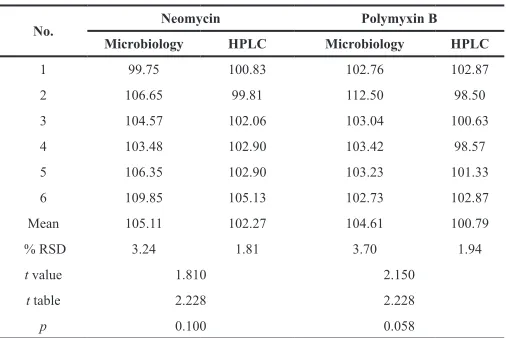
Comparison of methods
The chemical method obtained in this study was
compared with the standard microbiological method (USP 40, 2017). Samples on the market are tested by chemical and
microbiology methods. Data were processed by the two-sample T-test (α = 0.05). Based on the results in Table 8, it can be
concluded that there is no significant difference between these
methods for neomycin and polymyxin B. The difference between
the two methods was about ± 3% for neomycin and about ± 4% for
polymyxin. The difference in the percentage due to neomycin and
polymyxin consists of several components. Neomycin consists of neomycin B and neomycin C. The antimicrobial potency of neomycin C is lower than neomycin B (Adams et al., 1998). European Pharmacopoeia limits the amount of neomycin C to 3%–15%. Neomycin with a neomycin C content of less than 3% is called framycetin. USP does not differentiate neomycin
Figure 2. Chromatogram of standard, neomycin: 4.972 minutes; dexamethasone: 15.19 minutes; polymyxin B: 22.160 minutes.
Figure 3. Chromatogram of eye drops sample. Table 4. The results of one-way ANOVA test to pressure and evaporation temperature changes on peak area.
No. Neomycin Polymyxin B
Influence F value F table p F value F table p
1. Nitrogen pressure 35.920 5.143 0.005 0.748 5.143 0.513
2. Evaporation temperature 0.166 5.143 0.851 0.419 5.143 0.676
Figure 1. Structure. (a) Neomycin. (b) Polymyxin B [National Center for Biotechnology Information (NCBI), 2019].
and framycetin, so it does not limit the amount of neomycin C. Polymyxin B consists of polymyxin B1, B2, B3, and B1-I (USP 40, 2017). It causes different contents of the raw material used in
the sample on the market. The limitation of this method is that it cannot differentiate components in neomycin and polymyxin
B. It was also found in previous studies of neomycin (Scheidl
et al., 2009) as well as polymyxin B with an ELSD detector (He et al., 2018). This method is also less sensitive than HPLC-UV detector and especially mass spectrometry. Behind some
limitations, this validated method could apply for routine analysis
due to relatively inexpensive equipment, a good chromatographic
separation, and no derivatization steps for neomycin. For future study, it may be to develop simultaneous analysis, which includes
dexamethasone. Dexamethasone usually analyze by HPLC-UV
detector with a combination of acetonitrile and water as a mobile
phase (USP, 2017). The challenges of the analysis are to provide good chromatographic separation and give equally results with the
compendial method.
CONCLUSION
Quantification of antibiotics can be done by chemical
and microbiological methods. Based on this study, it can be concluded that the chemical method can be used as an alternative
method for routine quality control analysis of samples on the
market because it has several advantages in terms of increasing precision, accuracy, and shorter testing time.
ACKNOWLEDGMENT
The authors are grateful to National Agency of Drug and Food Control, Republic of Indonesia (Badan POM RI) for support
research cost.
CONFLICT OF INTEREST
The authors declare that they have no conflicts of interest. FUNDING SOURCES
National Agency of Drug and Food Control, Republic of Indonesia (Badan POM RI).
REFERENCES
Adams E, Liu L, Dierick K, Guyomard S, Nabet P, Rico S, Louis P, Roets E, Hoogmartens J. Neomycin: microbiological assay or liquid chromatography? J Pharm Biomed Anal, 1998; 17(4–5):757–66.
Christ A, Machado M, Ribas G, Schwarzbold V, da Silva C, Adams A. Fully validated microbiological assay for daptomycin injection and comparison to HPLC method. Braz J Pharm Sci, 2015; 51(4):775–83.
Corradini D. Handbook of HPLC. 2nd edition, Taylor and Francis, New York, pp 207–26, 2011.
European Department for the Quality of Medicines. European pharmacopoeia. 8th edition, EDQM, Strasbourg, pp 2055–6, 2014.
Farouk F, Azzazy H, Niessen W. Challenges in the determination of aminoglycoside antibiotics, a review. Anal Chim Acta, 2015; 890:21–43. Goodman & Gillman. The pharmacoclogical basis of therapeutics. 12th edition, The McGraw-Hill, San Diego, CA, pp 1505–9, 1538–9, 2011.
Hanko VP, Rohrer JS. Suitability of a liquid chromatography assay of neomycin sulfate to replace the microbiological assay for neomycin in USP Monographs. J Pharm Biomed Anal, 2010; 51:96–102.
Harmita. Analisis Fisikokimia: Kromatografi. EGC, Jakarta, Indonesia, pp 115–8, 2009.
He L, Song X, Xie J, Zhang M, Zhang Y, Li J, Huang Q. Simultaneous determination of eight cyclopolypeptide antibiotics in feed by high performance liquid chromatography coupled with evaporation light scattering detection. J Chromatogr B Anal Technol Biomed Life Sci, 2018; 1076:103–9.
Koupparis MA, Megoulas NC. Enhancement of evaporative light scattering detection in high-performance liquid chromatographic determination of neomycin based on highly volatile mobile phase,
Figure 4. Chromatogram of solvent.
Table 5. Linearity results.
Analyte (µg/ml)Range Regression equation r Vxo
Neomycin 100–500 y = 1.20688x + 3.32223 0.99955 1.392
Polymyxin B 30–100 y = 1.48470x + 2.70788 0.99703 4.672
Table 6. Precision results.
Analyte Intraday precision Interday precision
Mean % RSD Mean % RSD
Neomycin 99.314 1.876 98.370 1.357
Polymyxin B 103.156 1.604 102.285 1.205
Table 8. The results of neomycin and polymixin B with HPLC and microbiology method.
No. Neomycin Polymyxin B
Microbiology HPLC Microbiology HPLC
1 99.75 100.83 102.76 102.87
2 106.65 99.81 112.50 98.50
3 104.57 102.06 103.04 100.63
4 103.48 102.90 103.42 98.57
5 106.35 102.90 103.23 101.33
6 109.85 105.13 102.73 102.87
Mean 105.11 102.27 104.61 100.79
% RSD 3.24 1.81 3.70 1.94
t value 1.810 2.150
t table 2.228 2.228
p 0.100 0.058
Table 7. The results of determination of neomycin and polymyxin B by modifying nitrogen pressure and statistical analysis.
Analyte Nitrogen Pressure (kPa) F value F table p
318 320 322
Neomycin 99.190 100.900 100.822 1.501 5.143 0.296
high-molecular-mass ion-pairing reagents and controlled peak shape. J Chromatography A, 2004; 1057(1–2):125–31.Liu Q, Li J,
Song X, Zhang M, Li E. Simultaneous determination of aminoglycoside antibiotics in feeds using high performance liquid chromatography with evaporative light scattering. RSC Adv, 2017; 1251–9. Lotfipour F, Valizadeh H, Hallaj-Nezhadi S, Milani M, Zakeri-Milani P. Comparison of microbiological and high-performance liquid chromatographic methods for determination of clarithromycin levels in plasma. Iran J Pharm Res, 2010; 9(1):27–35.
Manfio M, Agarrayua D, Machado J, Schmidt C. A fully validated microbiological assay to evaluate the potency of ceftriaxone sodium. Braz J Pharm Sci, 2013; 49(4):753–62.
Pendela M, Adams E, Hoogmartens J. Development of a liquid chromatographic method for ear drops containing neomycin sulphate, polymyxin B sulphate and dexamethasone sodium phosphate. J Pharm Biomed Anal, 2004; 36:751–7.
Queiroz K, Silva M, Prado N, Lima A, Diniz R, César C, et.al. Comparison of microbiological assay and HPLC-UV for determination of fluconazole in capsules. Braz J Pharm Sci, 2009; 45(4):693–700.
Scheidl C, Menzinger F, Maier E, Capek E, Scheidl O, Huck C. Simultaneous Quantification of Neomycin and Bacitracin by LC-ELSD. Chromatographia, 2009; 69(11–12):1181–8.
Shaikh B, Jackson J, Guyer G, Ravis W. Determination of neomycin in plasma and urine by high performance liquid chromatography: application to a preliminary pharmacokinetic study. J Chromatogr B Biomed Sci Appl, 1991; 571:189–98.
Tsuji K, Jenkins KM. Derivatization of primary amines by 2-naphtalenesulfonyl-chloride for high performance liquid chromatography assay of neomycin sulfate. J Chromatography A, 1986; 105–15.
United States Pharmacopoeial Convention. USP 40 Online, Rockville, 2017.
Validation of Analytical Procedures: Text and Methodology, Q2(R1). ICH Technical Requirements for Registration of Pharmaceuticals for Human Use. ICH Harmonised Tripartite Guideline. Current Step 4 Version, 2005.
Website National Center for Biotechnology Information. Available via https://pubchem.ncbi.nlm.nih.gov/image/imgsrv.fcgi?cid=8378&t=l
Website National Center for Biotechnology Information. Available via https://pubchem.ncbi.nlm.nih.gov/image/imgsrv.fcgi?cid=5702105&t=l
How to cite this article:
Harmita H, Setiawati H, Suryadi H. Development and
validation method for simultaneous quantification of neomycin and polymyxin B by HPLC-ELSD and comparison
with microbiological method. J Appl Pharm Sci, 2020;