1
Frontiers in Heat and Mass Transfer
Available at www.ThermalFluidsCentral.org
SIMULATIONS OF HYPERSONIC FLOW PAST A RE-ENTRY
CAPSULE USING DSMC METHOD
R.V. Reji and S. Anil Lal†
Fluid Dynamics Lab, Department of Mechanical Engineering, College of Engineering Trivandrum, Kerala, India
ABSTRACT
DSMC simulation of re-entry of an object with shape and size close to that of ISRO’s Space Recovery Experiment (SRE) capsule has been analysed using the open-source tool dsmcFoam for three altitude conditions, viz. 85 km, 100 km and 115 km, and for three angles of attack, viz.0o,20o&40o. The hypersonic free stream velocity of 8000 m/s and boundary surface temperature of 300 K have been used for the simulations. The variation of parameters such as surface heat flux, surface pressure, shear stress, slip velocity, temperature jump and integrals such as total heat transfer, pressure drag and frictional drag are reported and discussed in this paper. The variation of temperature in the flow domain and along the stagnation line are able to clearly distinguish the shock structure and shock stand-off distance. The variation of local number density and the effects of such variations on the surface temperature and heat flux are discussed. A lower value for nose radius in SRE capsule is found to result in a higher value for peak heat flux compared to other re-entry capsules investigated.
Keywords:DSMC method, re-entry, hypersonic flow, rarefied flow.
1. INTRODUCTION
Shape is the most critical aspect to be considered for designing objects moving at hypersonic speed. The radius at the forward stagnation has a significant effect on the aero-thermal heating. The aero-thermal heating is inversely proportional to radius at the forward stagnation point. Hyper-sonic flow over objects are characterized by occurrence of a shock wave ahead of the body and large variations of density in the downstream re-gion of the shock. The number density of a gas medium is the ratio of the total number of molecules to volume. Low value for the number density means rarefaction. Under rarefied condition, average distance travelled by gas molecules between two successive collisions called as mean free path, becomes large compared to the characteristic dimension of the ob-ject. Knudsen number (Kn) is defined as the ratio of mean free path of the gas to characteristic dimension of the object, is commonly used to characterize the degree rarefaction in a flow. The continuum assumption and application of N-S equation for fluid dynamic analysis are not strictly valid for high values of Knudsen number in the range Kn>0.1. However continuum model using N-S equation in conjunction with slip boundary conditions has been extensively applied for flows up to Kn <0.2 ( Ander-son,2006).
For re-entry vehicles moving at hypersonic speed, rarefied regions of low number density can be observed in the flow domain. This situation arise mainly due to two reasons (a) lower value of free stream number density (b) displacement of the molecules away from some portions of the body surface in the downstream of bow shock. Under these situations, the value of free stream as well as some local values of Kn encountered in re- en-try objects from higher altitudes may become greater than 0.2 and results in invalidity of continuum assumption and Navier-Stokes equations (
An-†
Corresponding author. Email: [email protected]
derson,2006;Bird,1994). An equation valid for a wide range of values of Kn is the Boltzmann equation (Bird,1994;Cercignani,2000). Direct solution of Boltzmann equation involves computation of large number of molecules and hence impractical. A very simple and computationally affordable alternate method for solution of rarefied flows consists of ran-dom sampling of gas molecules. The method of solution is known as Di-rect Simulation Monte Carlo (DSMC). It is a statistical method which em-ulate the physical processes modeled in Boltzmann equation. The present work is concerned with analysis of hypersonic flow over a re-entry cap-sule.
The importance of the present work as an extension to the current state of knowledge is in relation to the state of the art Indian scenario. As a forerunner to this, a brief review of literature on development of DSMC method and simulations of high speed flow over objects are given here.
to the developments of a number of variants to the traditional methods. Bird [(Bird,2007;Galliset al.,2009) reported the sophisticated DSMC algorithm with new features for the purpose of improving the compu-tational speed and reducing discretization error, which is not an open source software. Another important development focusing on improving the probabilistic computation of collision is due toLeBeauet al.(2003). They introduced a virtual-subcell method (VSC) for the selection of colli-sion partners. In this method, the first particle in a collicolli-sion cell is selected at random and the distances to all the remaining particles in the collision cell are calculated. Then, the nearest particle is selected as the partner for collision. A noted open source software development for DSMC using high potential utilities of open CFD software OpenFOAM is due to Scan-lonet al.(2010). They developed a solver named as dsmcFoam. In this code an automatic sub-cell generation is applied for efficient calculation of nearest neighbour collisions. The dsmcFoam is available as an open source through GNU general public license. Though a large number of simulations using DSMC method can be found in literature, the simula-tion of high speed flow over objects such as re-entry objects are found very few. Notable investigations on the re-entry simulations reported are flow over Apollo (Glasset al.,2006;Walpotet al.,2012), Orion (Votta
et al.,2013;Palharini,2014)] and OREX capsule (Mosset al.,1996). In India, the important mile stone towards re-entry capsule has been due to the Space Recovery Experiment (SRE). It is worth mentioning that the re-entry objects have differences in size as well as shape. The present work is motivated from the curiosity in understanding the effect of the variations in the size and shape in a model of SRE on the different aspects of non-continuum hypersonic flow. Images and important dimensional details of SRE capsule are found from the literature (Harveyet al.,2011). These details are used in the present work to develop the geometrical model of SRE capsule. Major difference of SRE capsule from the cap-sules of other nations is in the use of a small nose radius (ie. less blunted). To the best of author’s knowledge no numerical simulation of SRE model has been reported. Another significance of this work is the usage of an open source computational tool. The methodology of the current work consists of validating dsmcFoam and then apply for computing the flow over a model of the ISRO’s SRE capsule. The analysis is performed to find out the heat flux during re-entry corresponding to the conditions of different altitudes and angles of attack. It may be noted that predicted heat flux should not depend considerably on the body surface tempera-ture used as a boundary condition. To verify this hypothesis, the effect of surface temperature distribution on the heat flux is investigated by varying the temperature in the range of 300-2000 K. The minimum value of 300 K is taken because the atmospheric temperature at 115 km altitude has a nearly the same value. The maximum value 2000 K is taken based on the reported value of peak surface temperature (Mosset al.,1996,2006). In a re-entry process the velocity of capsule changes. It is found from liter-ature (ISRO,2016) that the maximum speed at re-entry of SRE capsule is 8000 m/s. Therefore, the free stream velocity of air is kept as 8000 m/s for all cases of simulation. Due to the usage of maximum speed of air, heat flux predicted will also be a maximum limiting value. As a part of validation of the DSMC tool, the case of high speed flow over flat plate is analysed and results are compared with reported results (Bird,1994).
2. DSMC METHOD
DSMC method is a particle based sampling method in which one simu-lated molecule, represents a larger ensemble of molecule. The simusimu-lated sample of molecules are tracked through space and time (Bird,1994). An assumption of the simulation method is that the molecular motion and interaction with the walls are decoupled from intermolecular collisions. The movement of each particle is linear in nature as prescribed by its velocity vector and time-step increment. Reorientation in the particle tra-jectory occurs as a result of interactions with wall and intermolecular col-lisions. The particle motion and collision with walls are deterministic and intermolecular collisions have a probabilistic nature. The collision rate is
calculated using kinetic theory of gases. The probability of collision be-tween collision partners is simulated using an acceptance rejection test method. The energy exchange between different modes of motion such as transition, rotation and vibration in molecules are included in the col-lision calculations using Larsen-Borgnakke statistical model (Borgnakke and Larsen,1975). The macroscopic properties are found out as ensem-ble average of the properties of particles. The temperature in the flow domain is computed as a weighted average of different modes of energy.
2.1. dsmcFoam
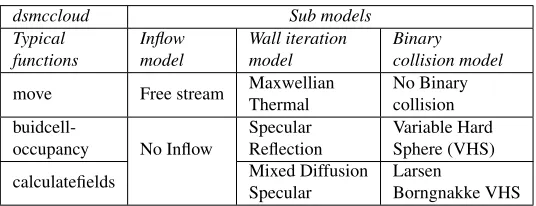
OpenFOAM (OpenFOAM,2016) is an opensource fluid flow solver con-taining a variety of solvers developed using object oriented C++ libraries. The solvers are developed to handle a number physical problems. The dsmcFoam (Scanlonet al.,2010) is a DSMC solver available in Open-FOAM. From the general description about DSMC method given in sec-tion 2, it is clear that the computasec-tional requirements of DSMC is differ-ent from that of convdiffer-entional CFD for continuum computations. Com-mon features in conventional CFD and DSMC are on the mesh and time step data. In dsmcFoam, this features for grid and time step are introduced by using the file "fvcfd.h". The features exclusively required for DSMC simulation are introduced using a set of functions and classes through the file "dsmccloud.h". This file redefines the boundary conditions which are used in the conventional CFD to the boundary conditions suitable for molecular dynamics simulation. For example symmetry boundary con-dition in dsmcFoam performs as specular reflection. A few access func-tions and submodels included using dsmccloud for DSMC simulafunc-tions are shown in Table1.
Table 1Typical functions and sub models available in dsmcFoam.
dsmccloud Sub models
Typical functions Inflow model Wall iteration model Binary collision model
move Free stream Maxwellian
Thermal
No Binary collision
buidcell-occupancy No Inflow
Specular Reflection
Variable Hard Sphere (VHS)
calculatefields Mixed Diffusion
Specular
Larsen
Borngnakke VHS
2.2. Code Validation
The open source DSMC code is validated before applying it for the pre-diction of flow parameters of SRE re-entry model. This is done by sim-ulating flow of nitrogen gas over a horizontal flat plate of 1 m length. The free stream conditions of the gas has a number density of1020
per
m3and temperature of 273 K. The free stream Mach number is taken as 4. The value of free stream Knudsen number calculated using length as characteristic dimension of 0.0143. Though this value of Kn belongs to the continuum range, features of the flow leads to local rarefaction. The molecular properties of nitrogen gas and boundary conditions used are tabulated in table2and table3, respectively. The computational results for the problem is available for comparison inBird(1994).
Table 2Molecular properties ofN2 used for high speed flow over flat plate, whereTref is the reference temperature,ωis viscosity
in-dex, d is molecular diameter and m is molecular mass
Tref ω d(m) m(kg)
273 0.74 4.17×10⁻¹⁰ 4.65×10⁻²⁶
Table 3Boundary conditions for high speed flow over flat plate, where M is the Mach number, V is the velocity, T is the temperature, n is the number density andαis the free stream condition.
M∞ V∞(m/s) T∞(K) Twall(K) n∞(m−3)
4 1347.6 273 500 1×10²⁰
Fig. 1Contours of flow angle over flat plate (red lines-from dsmcFoam, black lines-fromBird(1994)).
Fig. 2Temperature contours over flat plate (red lines-from dsmcFoam, black lines-fromBird(1994)).
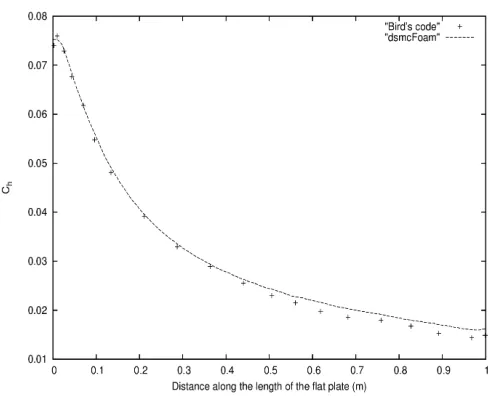
and black colored lines, respectively, in figure1and2. The surface prop-erties such as coefficient of pressure (Cp ) and heat transfer coefficient (Ch ) are also compared with the results ofBird(1994) in figures3and
4. A close agreement of flow characteristics captured by dsmcFoam and those of Bird is clearly demonstrates the validity of molecular model as well as the implementation of the DSMC method.
With the confidence gained by solving the validation problem withM∞=
4, an attempt is made to use dsmcFoam for the simulation of flow past SRE model withM∞greater than 25. It may be noted that with a large
value of difference in the free stream Mach number the validity of the molecular model and dsmcFoam can be assessed from the results of sim-ulations.
3. SRE MODEL
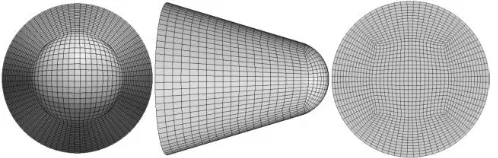
The model of re-entry capsule has a spherically blended cone configura-tion having a base diameter of 2.0 m, height of 2.1 m and nose radius of 0.5 m. The shape and dimensions of capsule shown in figure5have been taken from the data available in the literature (Harveyet al.,2011).
3.1. Computational Domain and Mesh
Three dimensional flow domain considered for the study has 6m length upstream of nose and 15 m length in the downstream of rear end of the body. The surface mesh used over body, and volume mesh developed for the simulation are shown in figures6and7respectively. This mesh has been developed using ANSYS ICEM 14.0, which is imported to Open-FOAM using fluent3DMeshToFoam tool. In ICEM CFD, block meshing
Fig. 3Comparison of coefficient of pressure (C p ) over the flat plate.
Fig. 4Comparison of heat transfer coefficient (C h ) over the flat plate.
is applied to generate unstructured hexahedral cells. The mesh consists of a total of 4.0 million hexahedral cells.
Fig. 6The surface mesh on SRE model.
Fig. 7 Flow domain for the simulation of hypersonic flow over SRE model.
3.2. Boundary Conditions and Molecular Property
During re-entry, SRE travels down from 120 km to 14 km altitude. In this work steady state DSMC simulations are carried out for conditions corre-sponding to three different altitudes of 85 km, 100 km and 115 km. Com-position of the gas and free stream temperature at various altitudes used for the analysis are taken from referenceNASA(2016) and are tabulated in table4. The values of free stream Knudsen numbers are calculated by taking the nose diameter as characteristic dimension for re-entry altitudes of 85 km, 100 km and 115 km are 0.01, 0.12 and 2.0, respectively. The
Table 4The free stream number density and temperature conditions used as boundary conditions for the simulation of SRE model obtained from NASA’s MSIS-E-90 atmospheric model (NASA,2016).
Altitude, km
Number density×10−17, m−3 Free stream temperature, K
N2 O2 O
85 1728.01 458.31 0.39 208.9
100 95.98 22.82 4.85 165.1
115 6.32 1.08 1.23 297.1
re-entry of velocity is taken as 8000 m/s. The gas considered is a mixture of Nitrogen and Oxygen. The molecular properties of species in the free stream flow are given in table5.
Simulation of flow requires the surface temperature of the body as a boundary condition. The body surface temperature is unknown. In this work, a parametric study is first carried out by varying surface body tem-perature to check the dependence of surface temtem-perature on the predicted heat flux. The surface temperature of the body has been varied as 300, 500, 1000, 1500 and 2000 K. The variation of predicted surface heat flux as a function of axial distance from the nose of the body is presented
Fig. 8Variation of heat flux over the body surface at 100 km altitude and
α= 0o
for different surface temperature boundary condition.
in figure 8. It shows that the surface heat flux distribution is altered only very little by variations of surface temperature used as boundary condition. As the maximum percentage deviation is only8%, a surface temperature of 300 K is applied for all the remaining simulations. The flow consisting of diatomic molecules, rotational relaxation is enabled by using binary collision model as "LarsenBorgnakkeVariableHardSphere" option in dsmcFoam. The coefficient of rotational relaxation number for energy exchange is taken as 5. This value is entered through the variable "relaxationCollisionNumber" corresponding to the reference temperature of 273 K. Over the SRE capsule surface, the Maxwellian thermal model is used to prescribe a constant wall temperature. Simulations have been carried out for three values of angle of attackαof the re-entry capsule such as0o,20o&40o
.
Table 5Molecular properties of free stream gas at aTrefof 273 K, where ωis viscosity index, d is molecular diameter, m is molecular mass, idof is the number of internal degree of freedom.
Molecule ω dref×1010, m m×1027, kg idof
N2 0.74 4.07 46.50 2
O2 0.77 3.96 53.10 2
O 0.80 3.00 26.50 1
3.3. Computational Details
Accuracy of DSMC simulations depends on cell size, time step, num-ber of simulated molecules and numnum-ber of sampling time steps used for macroscopic averaging. The cell size and time step should be less than or equal to the mean free path and mean collision time, respectively. The simulated number of molecules must be enough for the computa-tion of collisions. Time steps sampled for macroscopic property evalua-tion should be large enough to reduce statistical error. By keeping these considerations, a total number of initial simulated molecules of approxi-mately 2.0 million and time step of1×10−6s
are taken for the case of 85 km altitude. The simulation is carried out using parallel computation, and has taken about 150 hours of computer run time for the simulation for a total physical time of 0.1 s. The computer used is Dell PowerEdge M620 blade server with Intel Xeon processor E5-2600 2.0 GHz-48 processor.
4. RESULTS AND DISCUSSION
(a) Altitude=85 km
(b) Altitude=100 km
(c) Altitude=115 km
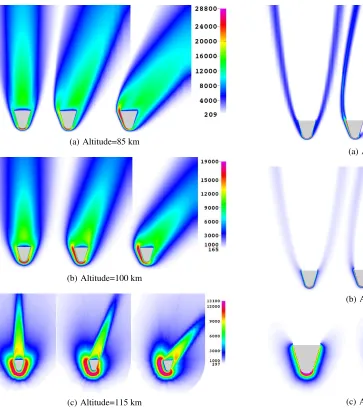
Fig. 9The contours of temperature (K) over the symmetry plane of flow domain for different altitudes and angles of attack.
the axis from the leading edge. The integral quantities reported are to-tal heat entering into the body, pressure drag, and frictional drag. These quantities have been computed by integrating their flux values such as the heat flux, surface pressure and surface shear stress, respectively. In the following discussion of results, the portion of the surface of the body fac-ing the free stream flow and the remainfac-ing portions are referred as wind-ward and leewind-ward side, respectively. These two surfaces are different for flow with a non-zero angle of attack only.
4.1. Contours of Temperature and Density
Figure9shows the contours of overall temperature along the symmetry plane of flow domain for different altitude conditions and angles of at-tack. With increase of angle of attack, the shock structure changes and maximum temperature is found to shift towards the windward side. A clear difference in the shock envelope with the change of angle of attack can be observed. The after body flow consist of a tail of high tempera-ture zone, which is extending to downstream of flow. The peak value of temperature in the domain for altitudes 85, 100 and 115 km are obtained as 28,800, 19,000 and 13,100 K. With increase of altitude, the value of temperature reduces and its location moves away from the surface of the body. This type of temperature distribution, in conjunction with relatively low values of number density do not cause a rate of chemical reaction that
(a) Altitude=85 km
(b) Altitude=100 km
(c) Altitude=115 km
Fig. 10The contours of density×106(kg/m3)over the symmetry plane of flow domain for different altitudes and angles of attack.
can lead to significant variations in the surface properties at higher alti-tudes such as 100 and 115 km (Scanlonet al.,2015). However, changes due to chemical reaction corresponding to re-entry condition from alti-tude 85 km should not be disregarded and necessary modification of the molecular model may be required for the analysis of hypersonic flow in dense atmospheric conditions such as those at 85 km altitude. Figure10
shows contours of density over the symmetric plane of flow domain. It shows that the distribution of gas molecules is more in the vicinity of re-entry capsule and shock. The density is very less behind the capsule and downstream of the bow shock. At higher altitudes weak diffused shock having larger thickness is found.
4.2. Stagnation Line Temperature Variation
Figure11shows the variation of translational, rotational and overall tem-peratures along the outward normal to forward stagnation point, for the three altitudes such as 85, 100 and 115 km atα = 0o
the object undergoes high aero-thermodynamic heating. This causes an increase of rotational mode of temperature at lower altitudes compared to higher altitudes. At the forward stagnation point, a maximum over-all temperature of approximately 2000 K has been computed for over-all the altitude conditions.
Fig. 11Distribution of translational, rotational and overall temperature variation over the stagnation line for different altitude at angle of attack of zero degree.
4.3. Surface Heat Flux
The surface heat flux over the model and the total heat entering the body for different angles of attack are tabulated in table6. The magnitude of the peak heat flux increases with reduction of altitude. In all the cases, the peak heat flux is found to occur at the forward stagnation point. The highest value for the peak heat flux on the body is found to occur for the lowest altitude case of 85 km and angle of attack equal to zero degree. The variations of heat flux over the body surface as a function of axial distance along the middle symmetry plane is shown in figure12. For angle of attack=0, the curves on the windward side and leeward side are same. At angle of attack (α= 40o
), the location of the peak heat flux move over the windward side due to shifting of the stagnation point. The magnitude of peak heat flux reduces slightly with increases of angle of attack. This is due to the effect of increases of radius of curvature at the point of stagnation. A comparison of present prediction of peak
Table 6Peak surface heat flux (qpeak) and total heat (qtotal) over the
body surface at different altitudes and angles of attack, x is the axial distance (m) from nose end.
Value Altitude α= 0o α= 20o α= 40o
qpeak (kW/m2)
85 km 1040.30 977.02 963.12
100 km 114.01 108.03 106.01
115 km 9.91 9.45 9.19
qtotal (kW)
85 km 1099.01 1494.50 1776.91
100 km 194.70 214.71 240.71
115 km 25.41 25.12 27.62
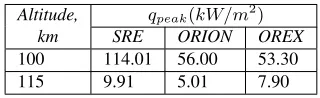
heat flux with other re-entry capsules at approximately similar conditions and altitude is given in the table7. The value of peak heat flux for the SRE model is more than that of ORION and OREX capsules. The reason
Fig. 12Distribution of heat flux along the symmetry plane of free stream flow over the body surface for different δs values at 100 km alti-tude.
Table 7Comparison of peak surface heat flux (qpeak) of SRE model at
zero angle of attack with other re-entry capsules with approxi-mately similar boundary conditions.
Altitude, km
qpeak(kW/m2)
SRE ORION OREX
100 114.01 56.00 53.30
115 9.91 5.01 7.90
for this difference is attributed to the higher nose radius of ORION and OREX capsule.
4.4. Surface Pressure
The values of peak pressure and pressure drag over the body for different cases of altitudes and angle of attack are given in table8. The magnitude of the peak pressure is highest for the lowest altitude. This is due to the higher value of number density. In all the cases, the peak pressure is obtained to occur at the forward stagnation point. The highest peak pressure on the body is found for the lowest altitude of 85 km altitudes and for zero degree angle of attack. The variations of pressure over the body surface as a function of axial distance along the middle symmetry plane is shown in figure13. At angle of attackα= 40o, the peak pressure of 39.3 Pa occurring at the leading edge undergoes a sudden drop and becomes equal to 27 at an axial distance of 0.4 m. Thereafter the pressure remains more or less a constant. The peak value of pressure is found to be only slightly altered by the change in angle of attack from 0 to 40 degree.
Table 8 The peak surface pressure (Ppeak) and total pressure drag
(Pdrag) over the body surface at different altitudes and angles of
attack, x is the axial distance (m) from nose end.
Value Altitude α= 0o α= 20o α= 40o
Ppeak (P a)
85 km 656.02 624.10 617.31
100 km 39.31 37.42 36.8
115 km 2.67 2.55 2.48
Pdrag
(N)
85 km 762.22 1091.01 1501.20
100 km 53.32 66.21 87.30
Fig. 13Distribution of surface pressure along the symmetry plane of free stream flow the body surface for different angles of attack at 100 km altitude.
Fig. 14Distribution of shear stress along the symmetry plane of free stream flow over the body surface for different angles of attack at 100 km altitude.
4.5. Surface Shear Stress
The values of peak shear stress and frictional drag over the body for dif-ferent altitudes and angles of attack are shown in table9. The magnitude of the peak shear stress increases with decreases of altitude. The highest value for the peak shear stress on the body is found for the lowest altitude of 85 km and for highest angle of attack of 40 degree. At higher altitudes change in angle of attack does not make significant difference in shear stress. This is due to the low value of number density. The variations of shear stress over the body surface as a function of axial distance along the middle symmetry plane is shown in figure14.
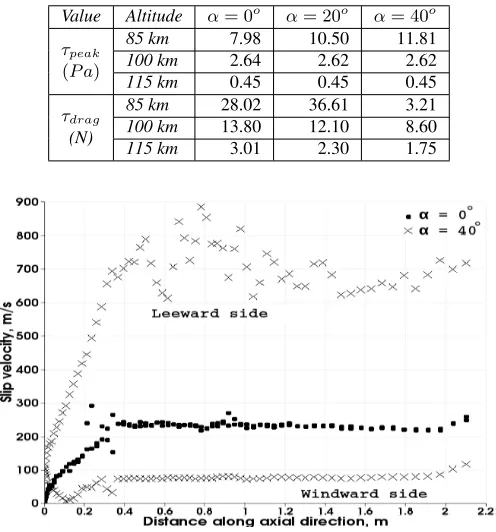
4.6. Slip Velocity
Figure15shows the variation of slip velocity over the body surface. No slip condition is observed at the leading edge of the body at all conditions of altitude as well as angles of attack. The slip velocity increases along the surface, reaches a maximum and then reduces slightly towards the back end of the body for zero angle of attack. Due to the abrupt geometry change at the back end of the body, a small fraction of the particles fall down from its corner and the local number density on the surface close
Table 9The peak shear stress (τpeak) and friction drag (τdrag) over the
body surface at different altitudes and angle of attack, x is the axial distance (m) from nose end.
Value Altitude α= 0o α= 20o α= 40o
τpeak (P a)
85 km 7.98 10.50 11.81
100 km 2.64 2.62 2.62
115 km 0.45 0.45 0.45
τdrag
(N)
85 km 28.02 36.61 3.21
100 km 13.80 12.10 8.60
115 km 3.01 2.30 1.75
Fig. 15 Distribution of slip velocity along the symmetry plane of free stream flow over the body surface for different angles of attack at 100 km altitude.
to the back end of the body drops locally. This local drooping of number density causes an increase of slip velocity close to the back end of the body. With increase of angle of attack the maximum value of slip veloc-ity in the leeward side increases. In the leeward side slip velocveloc-ity is as high as 800 m/s for angle of attack of 40 degree. The windward side is subjected to more collisions with gas molecules, so here slip velocity is comparatively less. The slip velocity in the windward side forα= 40o
is as low as 90 m/s. Fluctuations seen in the predicted values of slip ve-locities in the leeward side in figure 15 is due to the random molecular phenomena.
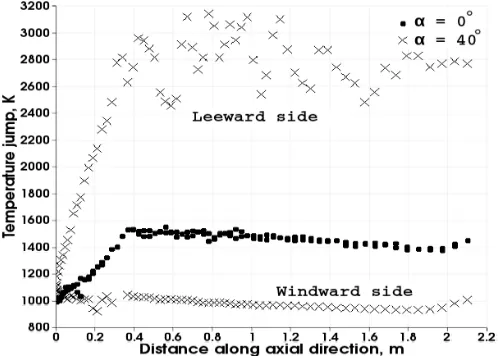
4.7. Temperature Jump
The distribution of temperature jump over the body surface is given in figure16, which shows that the variation is similar to that of slip velocity as found in figure15. Higher slip velocity occurs at the regions of low number density due to the effect of rarefaction. Less number of particles present in the high slip regions are subjected to minimum energy inter-action by surface collision leading to a larger temperature jump. Even though temperature jump is maximum, the total energy transfer to the walls is not maximum due to lower number of particle interactions. Due to this reason, the regions of maximum temperature jump do not coincide with regions of maximum heat flux. Further, the heat transfer coefficient in these high speed regions is greatly reduced due to low heat flux and high temperature jump. Temperature jump is found to be as high as 3000 K for altitude 100 km, with a minimum value of 950 K occurring at the windward side.
5. CONCLUSIONS
Fig. 16Distribution of temperature jump along the symmetry plane of free stream flow over the body surface for different angles of at-tack at 100 km altitude.
gas over a flat plate. Further, the study has been able to establish the ap-plicability of dsmcFoam to hypersonic flow over a re-entry object, SRE capsule at different altitudes and angles of attack. Based on the field temperature and available data from literature, it is concluded that the surface properties predicted using molecular model consisting of binary collision interactions with boundaries and other molecules is valid for high free stream Knudsen number corresponding to 100 and 115 km alti-tudes. Predictions for the lowest Knudsen number analyzed, correspond-ing to 85 km altitude show temperature values capable of resultcorrespond-ing into increased rate endothermic chemical reactions that may be able to sig-nificantly alter the predicted surface properties. Extending the molecular model by adding vibrational mode of energy exchange and chemical re-action should prove a reduction of maximum temperature in the flow field and accurate prediction of surface properties even for low altitude condi-tions. This is considered as a scope for future work. Another important conclusion from the present investigation is on the effect of wall temper-ature boundary condition on the simulated properties. It is concluded that heat flux is affected very little by variation of surface temperature in the interval [300-2000 K].
A brief summary of the important results obtained from the study is given below.
The lower nose radius of present model results in high value for the peak heat flux compared to the other re-entry models. The location of peak values for heat flux and surface pressure are at the forward stagna-tion point, but the peak temperature at low number dense regions hav-ing minimum energy interaction with the surfaces. For zero angle of attack, the peak value of heat flux for 85, 100 and 115 km altitudes are1040.30,114.01 & 9.91kW/m2, respectively. For 85 km altitude, a sharp thin bow shock wave is formed in front of the capsule. More dif-fusive bow shock waves are obtained for altitudes 100 km and 115 km. Increase of angle of attack changes the shape of shock envelop, which largely influences the surface properties.
REFERENCES
Anderson, J.D., 2006,Hypersonic and High Temperature Gas Dynamics, American Institute of Aeronautics and Astronautics.
http://dx.doi.org/10.2514/4.861956.
Bird, G.A., 2007, “Sophisticated DSMC, Notes from a Short Course,”
DSMC07 Conference, Santa Fe, USA.
Bird, G.A., 1994,Molecular Gas Dynamics and the Direct Simulation of
Gas Flows, Oxford Science Publications.
Borgnakke, C., and Larsen, P.S., 1975, “Statistical Collision Model for Monte Carlo Simulation of Polyatomic Gas Mixture,”Journal of compu-tational Physics,18(4), 405–420.
http://dx.doi.org/10.1016/0021-9991(75)90094-7.
Cercignani, C., 2000,Rarefied Gas Dynamics: from Basic Concepts to Actual Calculations, Cambridge University Press.
Chen, G., and Boyd, I.D., 1996, “Statistical Error Analysis for the Direct Simulation Monte Carlo Technique,”Journal of Computational Physics, 126(2), 434–448.
http://dx.doi.org/10.1006/jcph.1996.0148.
Gallis, M.A., Torczynski, J., Rader, D., and Bird, G.A., 2009, “Conver-gence Behavior of a New DSMC Algorithm,”Journal of Computational Physics,228(12), 4532–4548.
http://dx.doi.org/10.1016/j.jcp.2009.03.021.
Glass, C.E., Moss, J.N., and Greene, F.A., 2006, “DSMC Simulations of Apollo Capsule Aerodynamics for Hypersonic Rarefied Conditions,”9 th AIAA/ASME Joint Thermo physics and Heat Transfer Conference.
Harvey, B., Smid, H.H., and Pirard, T., 2011,Emerging Space Powers: the New Space Programs of Asia, the Middle East and South-America, Springer Science & Business Media.
ISRO, 2016, “ISRO Official Website,”
http://www.isro.gov.in/update/22-jan-2007/space-capsule-successfully-recovered.
LeBeau, G.J., Boyles, K.A., and Lumpkin, F., 2003, “Virtual Sub-cells for the Direct Simulation Monte Carlo Method,”AIAA paper,1031, 2003.
Moss, J.N., Boyles, K.A., and Greene, F.A., 1996, “DSMC Simulations of OREX Entry Conditions,”NASA-TM-111621.
Moss, J.N., Boyles, K.A., and Greene, F.A., 2006, “Orion Aerodynam-ics for Hypersonic Free Molecular to Continuum Conditions,”14th AIAA international space planes and hypersonic systems and technologies con-ference.
NASA, 2016, “MSIS-E-90 Atmosphere Model, NASA,”
http://omniweb.gsfc.nasa.gov/vitmo/msis_vitmo.html.
OpenFOAM, 2016, “OpenFOAM Offcial Wesite,”
http://www.openfoam.com/.
Palharini, R.C., 2014,Atmospheric Re-entry Modelling Using an Open-source DSMC Code, Ph.D. thesis, University of Strathclyde.
Scanlon, T.J., White, C., Borg, M.K., Palharini, R.C., Farbar, E., Boyd, I.D., Reese, J.M., and Brown, R.E., 2015, “Open-source Direct Simu-lation Monte Carlo Chemistry Modeling for Hypersonic Flows,” AIAA Journal.
Scanlon, T., Roohi, E., White, C., Darbandi, M., and Reese, J., 2010, “An Open-source, Parallel DSMC Code for Rarefied Gas Flows in Arbitrary Geometries,”Computers & Fluids,39(10), 2078–2089.
Votta, R., Schettino, A., and Bonfiglioli, A., 2013, “Hypersonic High Altitude Aerothermodynamics of a Space Re-entry Vehicle,”Aerospace Science and Technology,25(1), 253–265.
Walpot, L.M., Wright, M.J., Noeding, P., and Schrijer, F., 2012, “Base Flow Investigation of the Apollo AS-202 Command Module,”Progress in Aerospace Sciences,48, 57–74.