ISSN 2324-805X E-ISSN 2324-8068 Published by Redfame Publishing URL: http://jets.redfame.com
Failures and Inabilities of High School Students about Quadratic Equations
and Functions
Dilek Sezgin Memnun1, Bünyamin Aydın2, Emre Dinç2, Merve Çoban2, Fatma Sevindik2 1
Faculty of Education, Uludag University, Turkey
2Ahmet Kelesoğlu Faculty of Education, Necmettin Erbakan University, Turkey
Correspondence: Dilek Sezgin Memnun, Uludag University, Faculty of Education, Gorukle, Nilufer, Bursa, Turkey
Received: June 30, 2015 Accepted: July 14, 2015 Online Published: August 20, 2015 doi:10.11114/jets.v3i6.918 URL: http://dx.doi.org/10.11114/jets.v3i6.918
Abstract
In this research study, it was aimed to examine failures and inabilities of eleventh grade students about quadratic equations and functions. For this purpose, these students were asked ten open-ended questions. The analysis of the answers given by the students to these questions indicated that a significant part of these students had failures and inabilities about quadratic equations and functions. The students were often unable to decide what to do in relation to the mathematical operations and made some arithmetical mistakes.
Keywords: Quadratic equations and functions, quadratic function graphs, graph drawing, learning difficulty, high school student
1. Introduction
1.1 Introduce the Problem
Algebra is one of the main branches of mathematics education and important in every area of life. With the abstract thinking structure it provides, in many respects, it undertakes a common bridge and language function conceptually and theoretically among the sub-areas of mathematics and elements of other disciplines (Erbaş, Çetinkaya & Ersoy, 2009). For this reason, students' inability to learn algebra may cause them not to be able to understand various advanced level mathematical subjects and, hence, be successful in their high school and university education lives (Williams, 1997). Because of that, the subjects of function and equation have an important place in the learning area of algebra. However, students have difficulty discriminating between the concepts of function and equation because there is a strong relationship between these concepts (Baki, Mandacı-Şahin & Türkdoğan, 2010).
1.2 Explore Importance of the Problem
Quadratic equations and functions are a special case of the functions taught at secondary education level and the tenth grade subjects in the renewed mathematics course teaching programs. At the same time, they are one of the subjects included in university entrance examinations and undergraduate educations in Turkey (Kutluca & Baki, 2013a). However, the concept of function was mostly explained in history via graph studies and associated with graphs. For this reason, the concept of function seeming to be related with algebraic demonstration is actually very much related with graphs. For functions are pictured with graphs and can be perceived and interpreted visually (Bloch, 2000; Nadia, 2004; cited in Yavuz & Kepceoğlu, 2010).
Yıldırım & Bars, 2014; Tekin, Konyalıoğlu & Işık, 2009). Moreover, few of these studies (Tekin, Konyalıoğlu & Işık, 2009) give an idea about the learning levels, difficulties and mistakes of students taking education at different levels of secondary education about quadratic equations and functions and graphs.
1.3 Related Literature
Moreover, in the renewed secondary education mathematics course programs in Turkey, equations and functions were given place in detail within the scope of algebra. There are many studies made on the subjects of equation and function. Some of these studies investigated into quadratic equations and functions and graphs (Baki, Mandacı-Şahin & Türkdoğan, 2010; Bayazıt, 2011; Dede, Bayazıt & Soybaş, 2010; Kutluca & Baki, 2013a and 2013b; Kutluca & Zengin, 2011; Öner, Yıldırım & Bars, 2014; Tekin, Konyalıoğlu & Işık, 2009). Other studies (Kutluca & Baki, 2013a and 2013b; Kutluca & Zengin, 2011; Öner, Yıldırım & Bars, 2014) examined the teaching and learning of quadratic equations and functions and graphs. Other studies (Baki, Mandacı-Şahin & Türkdoğan, 2010; Bayazıt, 2011; Dede, Bayazıt & Soybaş, 2010; Tekin, Konyalıoğlu & Işık, 2009) investigated into incapabilities and mistakes of students from different class levels about quadratic equations and functions and graphs.
Baki, MandacıŞahin and Türkdoğan (2010) asked to the students to find the peak point of the quadratic function f(x)= -2x2-12x-14 and draw its graph. As a result, it was observed that some of the students were not aware of the integrity of the function in the form of y=f(x) and wrote equation instead of function in the solution. Moreover, many students had difficulty making sense of the peak point and could not make any reasoning to determine the peak point. Bayazıt (2011) aimed to examine the knowledge levels of students about graphs. The students were asked to draw the graph of the f(2x) function by benefiting from the given graph of the f(x)=x2-4 quadratic function and interpret what shape the f(2x) graph will take by benefiting from f(x). As a result of the study, it was reported that the great majority of the participant science education and classroom teaching students (75%) could not solve the question and also an important part of them solved the question incorrectly. Tekin, Konyalıoğlu and Işık (2009) reported that more than half of the science high school students could draw the quadratic function graph correctly, but the majority of the students from the other high schools had difficulty drawing the parabola graphs and some of the students drew the parabolic function graphs similar to the linear function graph.
1.4 Statements of Hypotheses and Their Correspondence to Research Design
This study was carried out with the aim of determining high school students' incapabilities and misconceptions about the subjects of quadratic equation, function and graphs. With this aim, we raised the following research problems:
1. What incapabilities and misconceptions do eleventh grade students have in relation to the solution of quadratic equations?
2. What incapabilities and misconceptions do eleventh grade students have in relation to the solution of quadratic functions?
3. What incapabilities and misconceptions do eleventh grade students have in relation to quadratic function graphs?
2. Method
2.1. Research Model
This study is a qualitative study and a special case study in descriptive type which aimed to determine students' incapabilities and misconceptions about the subjects of quadratic equation, function and graphs. In a case study, a situation is investigated in detail by focusing on individuals or groups (Yıldırım & Şimşek, 2005: 77). It is aimed to examine and put forward the results of a certain situation with a holistic approach (Ekiz, 2003).
2.2 Participants
This study was carried out with 182 volunteer students taking education in the eleventh grade of two different high schools selected from among the high schools in the province of Konya by using the random sampling method, one of the probability-based sampling methods, in the study during the fall semester of the 2014-2015 educational year. In the random sampling method, samples are selected via using completely random method (Yıldırım & Şimşek, 2005: 104). The participant students were determined completely randomly.
2.3. Instruments
In this study, first of all, an achievement test composed of a total of 10 open-ended questions was prepared by considering a total of 12 different acquisitions related to quadratic equation, function and graphs included in the mathematics course program.
aimed to reveal that the root of the equation was at the same time a solution of the equation; the third question aimed to reveal the students' skills of factorization of quadratic equations by using two square difference or full squares. The fourth and the fifth questions covered solutions of quadratic equations by rounding them up to full square statements or separating them into factors; the sixth question covered the acquisitions of determination of the existence of real roots according to discriminant. In the seventh question, the sum and product of roots and the relationship between the coefficients of the equation were examined. While the first seven questions were related to quadratic equations, the remaining three questions were related to the quadratic function and its graphs. In the eighth question aimed to have the students draw the graph of a given function. In the ninth question, it was aimed to measure if the students could write the function of the parabol with points cutting the axes. The tenth question was prepared with the aim of understanding if the students could write the function with its graph given.
After that, the questions in this prepared test were checked by a total of nine different secondary education mathematics teachers for level, coverage, content and language and rearranged in the direction of the opinions of these teachers. Finally, the research questions prepared about the quadratic equation, function and graphs, then checked by different secondary education mathematics teachers and finally included within the scope of the study were applied to a group of 30 high school eleventh grade students during the fall semester of the 2014-2015 educational year before the last revision. Within the scope of this pilot study, classifications were made for the students' answers and the obtained data were gathered under these determined classifications. Hence, a preliminary draft evaluation form was prepared in order to use in the evaluations to be made. Hence, it was examined if the problems included in the test were understood and solved by the eleventh grade students.
2.4. Data Collection and Analysis
In this study, first of all, the research questions prepared about the quadratic equation, function and graphs were administered to a total of 30 eleventh grade students during the fall semester of the 2014-2015 educational year and the answers given by the students to these questions were analyzed via using descriptive analysis. Within the scope of this applied pilot study, themes were determined for the student answers and these obtained pieces of data were gathered under these determined themes. Hence, a preliminary draft evaluation form was prepared with the aim of using in the evaluation of the practices to be done.
Then, the research questions prepared about the quadratic equation, function and graphs and included within the scope of the study were addressed in written to the participant high school students in the company of their math teachers during the fall semester of the 2014-2015 educational year. It took these students about 50 minutes to answer these problems included in the probability test. It was assumed that these participant eleventh grade students made use of their real knowledge and skills in the solution of the research problems.
The answers given by the participant students to the questions addressed to them were analyzed via using descriptive analysis. Within the scope of the study, the pieces of data obtained from the answers given by the students to the problems addressed to them were analyzed by performing the stages of constructing a framework, processing pieces of data according to a thematic framework, definition of findings and interpretation of them. In the stage of constructing a framework, determination of the students' incapabilities and misconceptions in the solution of the research questions constructed the most general framework for data analysis. In the stage of processing data according to a thematic framework, the pieces of data were arranged and presented under different themes according to this determined framework. In this stage, no answer, wrong answer, incomplete answer and correct answer formed four different themes of the study. Moreover, in the stage of definition and interpretation of findings, the obtained pieces of data were read and arranged according to the determined themes. In this part, three researchers read and evaluated the pieces of data independently from one another. In these evaluations, as a result of the discussions made in the cases when the pieces of research data were placed under the classifications determined in the pilot study, the question of which answer was to be placed under which theme was discussed and rearrangements were made according to the obtained result. Then, the arranged pieces of data were described and the obtained findings were interpreted over these themes. Next, these obtained pieces of data were subjected to certain processes and expressed in numbers. For these pieces of data, the frequency and percentage values were calculated.
2.4. Validity and Reliability of the Study
The validity and reliability of this qualitative study were achieved via taking the strategies of plausibility and
transferability into consideration (Yıldırım & Şimşek, 2005: 264-272). Additionally, in the writing of the report in
3. Results
In this section, the achievement statuses of the students in relation to the questions aiming to measure the skills arranged in order in the teaching program about the quadratic equations prepared in accordance with the purpose of the study were analyzed for each question. Separate themes were prepared for each correct, incomplete and wrong answer and the findings were supported with direct quotations. Below is given the grouping of the students' answers for each question as correct, wrong, incomplete and empty answer.
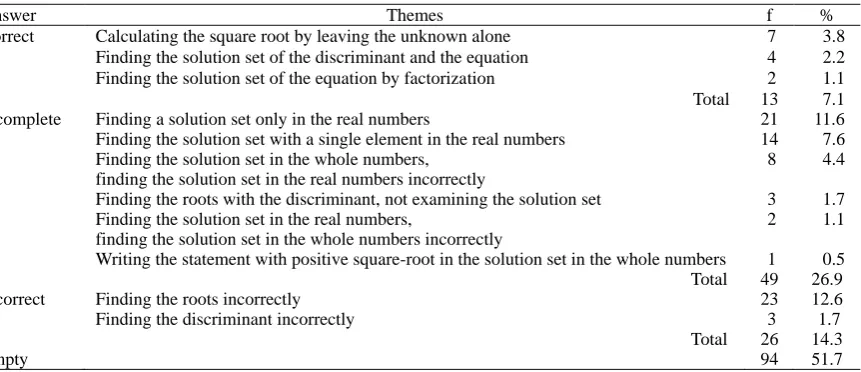
With the first question of"Find the solution sets for the x2-5=0 equation in the set of whole numbers and in the set of real numbers separately.", it was aimed to find out if the students could find the solution sets of the quadratic equations on different sets. Below is given the solution table (Table 1) in relation to the first question.
Table 1. Frequency and percentage values related to the answers given by the students to the first question
Answer Themes f %
Correct Calculating the square root by leaving the unknown alone 7 3.8 Finding the solution set of the discriminant and the equation 4 2.2 Finding the solution set of the equation by factorization 2 1.1 Total 13 7.1
Incomplete Finding a solution set only in the real numbers 21 11.6
Finding the solution set with a single element in the real numbers 14 7.6 Finding the solution set in the whole numbers,
finding the solution set in the real numbers incorrectly
8 4.4
Finding the roots with the discriminant, not examining the solution set 3 1.7 Finding the solution set in the real numbers,
finding the solution set in the whole numbers incorrectly
2 1.1
Writing the statement with positive square-root in the solution set in the whole numbers 1 0.5 Total 49 26.9
Incorrect Finding the roots incorrectly 23 12.6
Finding the discriminant incorrectly 3 1.7
Total 26 14.3
Empty 94 51.7
It was observed that only 7.1% of the students gave the desired solution to the question. However, an important part of the students (26.9%) gave incomplete answers to this question. The most frequently encountered case in the answers accepted as incomplete was that the students found the roots of the equation but could not write the solution sets. The reason why they could not write the solution sets although they obtained the roots of the equation by performing necessary procedures might have been their not knowing to which set the solution sets they had found belonged to. Moreover, the fact that although they found the roots as a result of the solution, the solution set over the whole numbers was an empty set might have posed difficulty for the students. Another most frequently encountered incomplete answer was that the students expressed the solution set in the real numbers incompletely. While finding the positive real root of the equation, most of the students took its negative real root. It is considered that the reason for this might have been the students' having insufficient knowledge and misconceptions about root numbers. 14.3% of the students accepted to have given incorrect answers were aware that they had to find the roots of the equation for the solution set but since they could not make the factorization or calculate the discriminant, they could not reach the solution. Moreover, this can be explained by the students' having insufficient foreknowledge about basic factorization.
Table 2 gives information about the analysis of the answers given by the students to the second question prepared in the form of "If one of the roots of the equation of x2-ax+21=0 is 3, what is a?" with the aim of measuring if they knew that the one expressed with the roots of the equation achieved the equation.
Table 2. Frequency and percentage values related to the answers given by the students to the second question
Answer Themes f %
Correct Finding the required via the replacement method 71 39.0 Finding the required via factorization 44 24.2 Finding via factorization and connections between roots 2 1.1 Total 117 64.3 Incomplete Factorizing but not being able to find the result 7 3.9 Using the replacement method, not completing the procedure 3 1.7 Total 10 5.6 Incorrect Correct factorization, but incorrect formula of sum of roots 22 12.1
Incorrect factorization 14 7.7
Finding and using the roots via discriminant incorrectly 4 2.2 Total 40 22.0
In the examinations made, it was observed that about 65% of the students answered the question correctly. This indicates that most of the students knew where to use which equation, formula. The students reached a result via one of the following three ways. The most frequently used correct way was the replacement method (39.0%) and the second was finding the required via factorization (24.2%). Moreover, in the incomplete answers, the students tried the methods leading to a correct result, but even though the method was correct most of the time, they could not reach a correct result. It is considered that the reason why they could not reach a correct result was their having weak operational skills or trying to find the solutions without thinking and making sense of the operations. For the students chose a correct way for the solution, but at a certain point they felt stuck. A similar case is observed in the incorrect answers. 22% of the students answered the question incorrectly. The first two themes related to the incorrect answers cover mistakes resulting from incomplete knowledge, wrongly remembered formulas. Four students tried to find a solution via the root finding formula and with the help of the discriminant. Since they could not write the formula correctly, they could not reach the correct answer.
In the third question stated as "Factorize the following algebraic statements.
a. x2-1 b. 4x2-9 c. x2+6x+9 d. 25x2-10x+1", the students were expected to factorize the algebraic
statements given in the form of ax2+bx+c via using also two squares difference or full square identical. The information about the analysis to this question is given in Table 3.
In the examinations made, it was observed that most of the students (60.5%) could factorize all the algebraic statements with the help of identical. However, most of the students answering this question incorrectly looked for a solution set by thinking that the given algebraic statements were equal to zero. This indicates that the students did have insufficient knowledge about the difference between the algebraic statement and the concept of equation. It also indicates that they felt the need for equalizing the algebraic statements to a number. Moreover, 28,6% of the students could factorize some of the algebraic statements in the question, others could not. While some of these students could not factorize the full square statements, another part of them had difficulty recognizing algebraic statements which are two squares difference. Moreover, it was understood that they could not remember identical completely.
Table 3. Frequency and percentage values related to the answers given by the students to the third question
Answer Themes f %
Correct Factorization (via using two squares difference and full square identical) 110 60.5 Total 110 60.5 Incomplet
e
Answering some options of the question and not answering others 52 28.6 Total 52 28.6 Incorrect Finding a root not having been factorized (performing an equation solution) 16 8.8
Incorrect factorization 2 1.1
Total 18 9.9 Empty 94 51.7
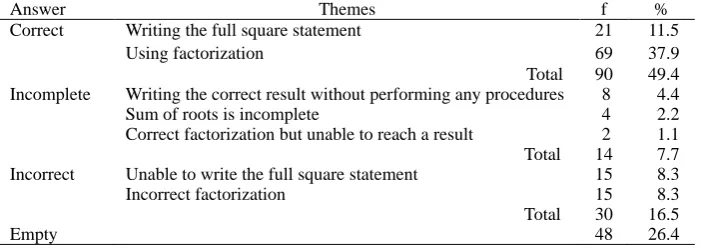
The students solved the fourth question related to the quadratic equations with one unknown included in the mathematics course program by rounding up to full square and factorizing. The formula yielding the roots of the quadratic equations with one unknown is formed. It was prepared in accordance with the acquisition specified by the Ministry of National Education (2014: 25). In this context, it was aimed to reveal the students' learning difficulties related to the acquisition of "In order for the statement of x2-16+a to be a full square, what number can be put in the place of it?" Below is given the information about the analysis of the answers given by the students to this question. Table 4. Frequency and percentage values related to the answers given by the students to the fourth question
Answer Themes f %
Correct Writing the full square statement 21 11.5
Using factorization 69 37.9
Total 90 49.4 Incomplete Writing the correct result without performing any procedures 8 4.4
Sum of roots is incomplete 4 2.2
Correct factorization but unable to reach a result 2 1.1 Total 14 7.7 Incorrect Unable to write the full square statement 15 8.3
Incorrect factorization 15 8.3
Total 30 16.5 Empty 48 26.4
made factorization but not reach a result in their answers points to the fact that these students remembered the identical related to the full square statement incompletely or incorrectly. For this reason, for the students to be able to solve the advancing problems of the subject, first of all, they should grasp the full square identical. For the students' not knowing to write full square statements underlies the incorrect answers.
The fifth question prepared in accordance with the acquisition of “solves the quadratic equations with one unknown” included in the updated curriculum and aiming to measure the permanence of the students' cognitive knowledge was this: "Find the solution set of the equation of x2+7x= -10." In this question, as in the other questions, according to the answers given by the students, themes were prepared and these themes were grouped as correct, incomplete and incorrect. Below is given information about the analysis of the answers given by the students.
Table 5. Frequency and percentage values related to the answers given by the students to the fifth question
Answer Themes f %
Correct Writing the solution set correctly via factorizing 99 54.5
Total 99 54.5 Incomplete Able to factorize but unable to write the solution set 58 31.9 Finding the roots via trying but unable to write the solution set 2 1.1 Performing the operation via calculating the discriminant, but unable to write the solution set 1 0.5 Able to write the solution set, but not writing the operations 1 0.5 Total 62 34.0
Incorrect Unable to factorize 11 6.1
Correct factorizing, but writing the solution set incorrectly 1 0.5 Writing incorrect solution set without doing any operations 1 0.5
Calculating the discriminant incorrectly 1 0.5
Total 14 7.6
Empty 7 3.9
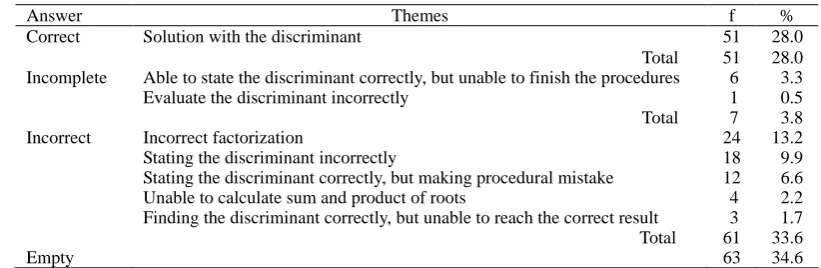
In the examinations made, it was observed that 54.5% of the students found the solution set via factorizing. Besides this, an important part of the students (34.0%) gave incomplete answers to this question. When the incomplete answers were examined, it was determined that nearly all of these students factorized the quadratic equation but did not write the solution set for this equation required in this question. About 3.9% of the students left the question unanswered. This makes us consider that these students had difficulty remembering and using the necessary information about the question. When the pieces of data were examined, it was observed that very few of the students answered the question incorrectly due to such reasons as “factorizing correctly but stating the solution set incorrectly or factorizing incorrectly or stating an incorrect solution set without doing any operations”. It was understood that a great majority of the students answering the question incorrectly could not reach the result because of factorizing the quadratic equation incorrectly. The sixth question included within the scope of the study was prepared in accordance with the practicing stage “the existence of the real roots of the quadratic equations with one unknown is examined according to the sign of the discriminant” of the acquisition “the student determines the relationships between the roots and the coefficients of the quadratic equations with one unknown" included in the curriculum. Within this scope, in this question stated as "If the 2x2-4x+m-5=0 equation has two different real roots, what is the biggest full number which m can take?", it was aimed to have the students acquire the cognitive skills related to this acquisition and the information about the correct, incomplete or incorrect answers given by the students to this question was given in Table 6.
Table 6. Frequency and percentage values related to the answers given by the students to the sixth question
Answer Themes f %
Correct Solution with the discriminant 51 28.0
Total 51 28.0 Incomplete Able to state the discriminant correctly, but unable to finish the procedures 6 3.3
Evaluate the discriminant incorrectly 1 0.5
Total 7 3.8
Incorrect Incorrect factorization 24 13.2
Stating the discriminant incorrectly 18 9.9
Stating the discriminant correctly, but making procedural mistake 12 6.6 Unable to calculate sum and product of roots 4 2.2 Finding the discriminant correctly, but unable to reach the correct result 3 1.7
Total 61 33.6
Empty 63 34.6
could not finish the procedure. When the themes gathered under the incorrect answers were examined, it was understood that an important part of the students (33.6%) answered the question incorrectly due to such reasons as "procedural mistake, not knowing the discriminant statement". Again, that an important part of the students (34.6%) left the question unanswered makes us consider that an important part of the students had difficulty remembering the subject of quadratic equations. This indicates that the students had not achieved a permanent learning about this subject. The seventh question was stated as "The roots of the x2-13x+30=0equation are x1 and x2. Write the quadratic equation with one unknown whose roots are x1+1 and x2+1." This question was prepared in relation to the stage, where "practices related to the construction of the quadratic equation with its roots given are included”, of the acquisition stated as “the student determines the relationships between the roots and coefficients of the quadratic equation with one unknown” included in the curriculum. In this context, it is a question requiring both the construction of a new quadratic equation and the use of the way of finding the roots of a given quadratic equation. The information about the preparation of the themes in accordance with the answers given by the students and grouping of these themes as correct, incomplete or incorrect answers was given in Table 7.
Table 7. Frequency and percentage values related to the answers given by the students to the seventh question
Answer Themes f %
Correct Writing the equation and stating the correlations between the roots correctly 31 17.0
Using factorization 28 15.4
Calculating the discriminant 2 1.1
Total 61 33.5 Incomplete Finding the roots correctly, but unable to write the equation 22 12.1 Able to factorize, but unable to find the roots 6 3.3 Total 28 15.4 Incorrect Finding the roots via using the discriminant, not writing a new equation 16 8.8 Finding the roots incorrectly (incorrect factorization) 15 8.3
Calculating the sum of roots incorrectly 7 3.8
Finding the product of roots incorrectly 5 2.7
Unable to write the sum / product of roots 3 1.7
Total 46 25.3
Empty 47 25.8
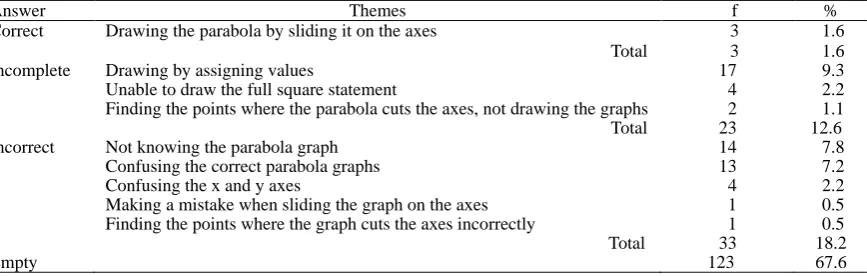
The fifth question included in this study required the students to find only the solution set, that is to say, the roots, of the equation and it was reported that more than half of the students (54.5%) answered this question correctly. However, the seventh question, first of all, required the students to have the knowledge of finding the roots via starting from the themes which we had prepared from the answers given by the students and then to write the new equation. In the examinations made, it was observed that, in this question, only 33.5% of the students could write the new equation. Moreover, it was also observed that an important part of the students answering the question incompletely found the roots of the equation correctly, but could not construct the new equation. The joint analysis of the incomplete and correct answers makes us consider that one of the difficulties which the students had in relation to this acquisition was “not knowing how to use the existing knowledge in the transition to the new equation”. Moreover, an important part of the students (16.5%) gave incorrect answers to this question due to such reasons as incorrect product or sum of the roots, incorrect factorization. Again,it is also eye-catching that a rather important part of the students (25.8%) did not answer it. The eighth question was stated as "Draw the graphs of the functions of y= x2, y= x2-1, y= x2+2, y= (x-2)2". In this question, it was aimed to have the students recognize how a quadratic function moves on y-axis as the k real value of the graph belonging to a quadratic function in the form of y= a.x2+k changes and how it moves on x-axis as the k real value of the graph belonging to a quadratic function in the form of y= a.(x-k)2 and draw a general conclusion. The information about the analysis of the answers given by the students to this question was given in Table 8.
Table 8. Frequency and percentage values in relation to the answers given by the students to the eighth question
Answer Themes f %
Correct Drawing the parabola by sliding it on the axes 3 1.6
Total 3 1.6
Incomplete Drawing by assigning values 17 9.3
Unable to draw the full square statement 4 2.2
Finding the points where the parabola cuts the axes, not drawing the graphs 2 1.1 Total 23 12.6
Incorrect Not knowing the parabola graph 14 7.8
Confusing the correct parabola graphs 13 7.2
Confusing the x and y axes 4 2.2
Making a mistake when sliding the graph on the axes 1 0.5 Finding the points where the graph cuts the axes incorrectly 1 0.5
Total 33 18.2
In the examinations made, it was observed that a great majority of the students (67.6%) left the question unanswered, which makes us consider that the students could not achieve a permanent learning about how to draw the graph of quadratic functions. Similarly, in this question, that the students could not even find the roots belonging to the function makes us consider that these students approached the graph drawing with prejudice. It was observed that a great majority of the students giving incomplete answers to the question drew the graph by assigning values, which makes us consider that the students had cognitive information about how to show the function and the value belonging to the function on the axes in graph drawing. Moreover, when the incorrect answers were analyzed, it was observed that a part of the students (7.2%) drew a line graph instead of a graph required in the question, which makes us consider that the students could not interpret that the quadratic equation graph would not construct a linear but a parabolic structure. Again, it was also observed that a part of the students (7.8%) did not know the parabola graph. Similarly, that a few students confused these axes makes us consider that these students still did not know that the roots belonging to a function had be included on the axis of abscissas. This might indicate that some of the students had problems in the analytic geometry.
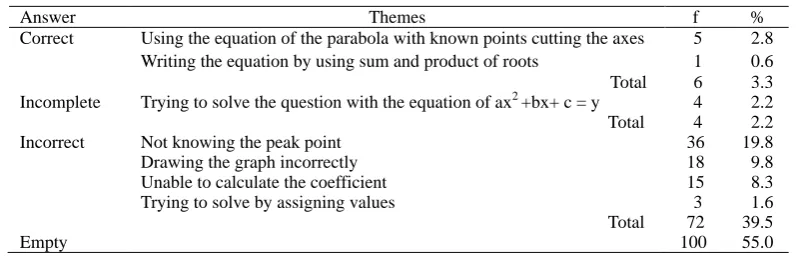
The ninth question included within the scope of the study was stated as "A parabola cuts x axis on the points of -1 and 2 and y axis on the point of -4. Write the function belonging to this parabola."This question was prepared with the aim of revealing reasons for difficulties lived when writing the equation of the parabola with given points cutting axes. The information about the analysis of the answers given by the students to this question was given below.
Table 9. Frequency and percentage values in relation to the answers given by the students to the ninth question
Answer Themes f %
Correct Using the equation of the parabola with known points cutting the axes 5 2.8 Writing the equation by using sum and product of roots 1 0.6 Total 6 3.3 Incomplete Trying to solve the question with the equation of ax2 +bx+ c = y 4 2.2 Total 4 2.2
Incorrect Not knowing the peak point 36 19.8
Drawing the graph incorrectly 18 9.8
Unable to calculate the coefficient 15 8.3
Trying to solve by assigning values 3 1.6
Total 72 39.5
Empty 100 55.0
In the examinations made, it was observed that only 6 students answered this question. While 4 students gave incomplete answers, 72 students failed to write the function of the parabola. The common point of 4 incomplete answers was that they found (a, b, c) coefficients by putting the root values given in the quadratic equation stated as ax2 +bx+c=y in place. This indicates that the students knew that the points where the parabola cut x axis were the roots of the equation of the function. However, these students had difficulty finishing the procedures and could not write the function. It was observed that 18 students giving incorrect answers drew the graph of the function according to the givens, but there were mistakes in the drawings. This might have resulted from the students' seeing what was stated with the function as the graph although they were asked to “write the function”. Another reason why they drew the graph might be related to their need to visualize the givens in the question before writing the function. By looking at the other incorrect answer themes, it can be stated that the students had some insufficient learning about some basic concepts such as peak point, main coefficient belonging to the quadratic function and graphs. In the examinations made, it was also observed that more than half of the students (55.0%) left the question unanswered. This makes us consider that generally the students had difficulty reading and drawing graphs.
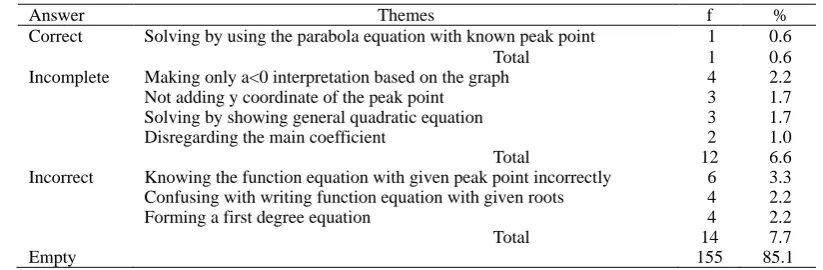
Table 10. Frequency and percentage values in relation to the answers given by the students to the tenth question
Answer Themes f %
Correct Solving by using the parabola equation with known peak point 1 0.6 Total 1 0.6 Incomplete Making only a<0 interpretation based on the graph 4 2.2
Not adding y coordinate of the peak point 3 1.7
Solving by showing general quadratic equation 3 1.7
Disregarding the main coefficient 2 1.0
Total 12 6.6 Incorrect Knowing the function equation with given peak point incorrectly 6 3.3 Confusing with writing function equation with given roots 4 2.2
Forming a first degree equation 4 2.2
Total 14 7.7
Empty 155 85.1
In the examinations made, it was observed that a great majority of the students (85.1%) left the question unanswered. It is considered that the reason for this high percentage of the empty answer was again the students' insufficiencies about the subject of reading graphs. Moreover, it can be stated that the incomplete answers were the sign of some students' not knowing the parabola equation with known peak point completely or remembering it incompletely. Some students looked for a solution with the method of replacement in the general quadratic equation statement (ax2+bx+c=y). Again, some students stated that the sign of a would be negative only in the statement of ax2+bx+c=y according to the graph, but could not finish the solution. Moreover, the incorrect answers point to the fact that the students either knew / remembered the parabola equation with known peak point incorrectly, confused writing the function equation with given roots or formed a first degree function. And this indicates that these students did not know what the first degree or quadratic equation graphs express.
4. Discussion and Conclusion
As a result of the examinations made within the scope of this study, it was understood that when they were asked to find the solution set for a given equation, some of the participant eleventh grade students (34%) made use of factorization,
discriminant calculation or root statements as a solution method, but nearly all of them could not reach the correct answer. Moreover, it was observed that more than half of the students did not make any examination to find the solution set, either. This makes us consider that the students had insufficient information about factorization, discriminant calculation or root statements necessary in reaching the quadratic equation solutions. In this context, it was observed that when it was asked to factorize the algebraic statement known to have two real roots, some of these students tried to find the roots by thinking these algebraic statements as an equation. Moreover, it was understood that nearly half of the students could not make the factorization for the given different algebraic statements correctly, which supports the fact that the eleventh grade students had insufficient knowledge and misconceptions about factorization.
About the factorization of the algebraic statement by using two squares difference and full square identical, it was observed that more than half of the students (60.5%) wrote the correct answer; an important part of them (28.6%) were successful at this kind of questions at either full square or two squares difference. It was understood that the students had difficulty using full square expansion related to the algebraic statements in different questions addressed to them. In this case, it can be stated that an important part of the students had insufficiencies in the questions requiring the use of
perfect full square. Again, it was observed in the examinations that less than half of the students calculated the discriminant correctly in the given questions. This indicates that the majority of the students had insufficient knowledge about the discriminant. Moreover, it was observed in the questions requiring the use of discriminant that some students had difficulty reaching the result, which indicates that the students had difficulty writing an equation when making evaluations. Moreover, a great majority of these students were incapable of writing the equation related to the algebraic statement by using sum and product of roots. Moreover, it is eye-catching that an important part of the students had difficulty reaching the sum or product of roots.
Nearly all of the participant students did not manage to draw different parabola graphs with given algebraic statements
and about two thirds of them (67.6%) did not do parabola drawing. It is understood that al the three students drawing the correct parabola tried to draw another parabola equation by sliding a certain parabola on axes. Similarly, about writing the parabola equation with points known to cut the axes or the function of the parabola with its graph given, it was observed that nearly all of the students did not become successful. Moreover, it is eye-catching that an important part of the students (19.8%) did not know to find the peak point of the parabola. This indicates that the participant eleventh grade students were not knowledgeable of drawing parabola graphs of quadratic equations.
quadratic equations and functions, and in this scope, about how to calculate the discriminant. Moreover, the students had incapabilities and misconceptions within the scope of the learning of quadratic equations and functions about
writing full squares, sum and product of roots and also equations by benefiting from these. Furthermore, about drawing the graphs of quadratic equations and functions, nearly none of the students became successful. The students had difficulty especially drawing the function with its graph given and generally tried to calculate the formula. For this reason, first of all, it is important that the students should know how to draw the graph of first degree equations. This indicates that the students could not learn to draw these graphs. It is considered that this results from giving examination-oriented education at schools and, for this reason, students' trying to use a memorized formula instead of trying different ways when writing a function. Moreover, traditional teaching approaches still commonly used at schools aim to have students develop quantitative knowledge. These teaching approaches requiring showing interest in graphs in terms of points (value reading activities over given graphs, etc.) attach importance to and put emphasis on activities foreseeing drawing graphs of algebraically given equations and correlations with point approaches. Although questions requiring qualitative approaches have been included in the secondary education teaching program (Ministry of National Education, 2014) and in the course books in recent years, this aspect is disregarded in the practice process and questions are solved with mechanical knowledge and approaches. For example, the knowledge of 'the graph of f(x)=ax2+b is obtained through setting back the graph of "f(x)=ax2 along y axis’ is transferred as a rule. However, the points of how b value which can be added to f(x) will change this function and why the graph of f(x)=ax2 needs to be set back along y axis by b unit are not made clear and students are forced to think over information necessary for the development of qualitative perception (Bayazıt, 2011). And this might cause students not to be successful in drawing graphs. The results obtained in this study in relation to the students' being incapable of drawing the function graph and writing the equation of the function with its graph given are similar to those obtained in the study carried out by Tekin, Konyalıoğlu and Işık (2009) with the tenth grade students and those obtained in the study made by Yavuz and Kepceoğlu (2010), Baki, Şahin and Türkdoğan (2010) and Bayazıt (2011) with teacher candidates. Moreover, it was understood from the graphs drawn by the students that some of the students did not have the knowledge of peak point. This finding supports the study carried out by Baki, Şahin and Türkdoğan (2010) where the students confused the point where the peak point and the graph cut y axis and they had insufficient learning about this subject.
5. Implications
Use of multiple representations in the teaching process or teaching this subject with different mathematical softwares might help eleventh grade students to learn the subject of quadratic equation and function (Kutluca & Zengin, 2011). For, in a teaching including multiple representations, the students think of which representation to use rather than memorizing and this facilitates their conceptual understanding (Akkoç, 2005). For this reason, as a result of applying multiple representations, not only is the mathematical concept under discussion better taught, but also students learn to transfer representations and features into practice more actively (Yavuz & Kepceoğlu, 2010). Moreover, use of mathematical softwares provides visuality in the teaching of function graphs and, for this reason, facilitates teaching of this subject. Furthermore, in this way, students' both computer literacy and mathematical statement awareness might increase (Kutluca & Zengin, 2011). Further studies might focus on the use of different teaching methods in the teaching of the subject of quadratic equations and functions and the design of teaching giving place to the use of technological tools.
References
Akkoç, H. (2005). Fonksiyon kavramının anlaşılması: Tanımsal özellikler ve çoğul temsiller. Eğitim Araştırmaları Dergisi, 5(20), 1-14.
Baki, A., Mandacı-Şahin, S., & Türkdoğan, A. (2010). Bir sorunun söyledikleri: Fonksiyonlar ve grafikleri konusunda bir özel durum çalışması. e-Journal of New World Sciences Academy, 5(4), 1868-1882.
Bayazıt, İ. (2011). Öğretmen adaylarının grafikler konusundaki bilgi düzeyleri. Gaziantep Üniversitesi Sosyal Bilimler Dergisi, 10(4), 1325-1346.
Dede, Y., Bayazıt, İ., & Soybaş, D. (2010). Öğretmen adaylarının equation, fonksiyon ve polinom kavramlarını anlamaları. Kastamonu Eğitim Dergisi, 18(1), 67-88.
Durmuş, S. (2004). Matematikte öğrenme güçlüklerinin saptanması üzerine bir araştırma. Kastamonu Eğitim Dergisi, 12(1), 125-128.
Ekiz, D. (2003). Eğitimde araştırma yöntem ve metodlarına giriş: nitel, nicel ve eleştirel kuram metadolojileri.Ankara: Anı Yayıncılık.
Ersoy, Y., & Erbaş, K. (1998). İlköğretim okullarında cebir öğretimi: Öğrenmede güçlükler ve öğrenci başarıları. Cumhuriyetin 75. Yılında İlköğretim Sempozyumu Bildirileri (ss. 171-179), Ankara, 27 Kasım.
Gürbüz, R., Toprak, Z., Yapıcı, H., & Doğan, S. (2011). Ortaöğretim matematik müfredatında zor olarak algılanan konular ve bunların nedenleri. Gaziantep Üniversitesi Sosyal Bilimler Dergisi, 10(4), 1311-1323.
Kutluca, T., & Baki, A. (2009). Investigating of views of students, student teachers and teachers about difficult subjects in 10th grade mathematics class. Kastamonu Education Journal, 17(2), 609-624.
Kutluca, T., & Baki, A. (2013a). Evaluation of student views about worksheets developed in quadratic functions.
Hacettepe University Journal of Education, 28(3), 319-331.
Kutluca, T., & Baki, A. (2013b). Developing computer assisted worksheets with electronic spreadsheets and computer algebra system. Journal of Theory and Practice, 9(4), 511-528.
Kutluca, T., & Zengin, Y. (2011). Evaluation of views of students about GeoGebra in Teaching of Mathematics. Dicle Üniversitesi Ziya Gökalp Eğitim Fakültesi Dergisi, 17, 160-172.
Milli Eğitim Bakanlığı (2014). Ortaöğretim matematik dersi programı. Ankara: MEB.
Öner, G., Yıldırım, İ., & Bars, M. (2014). The effect of blended learning on students' achievement fort he topic of quadratic equation in mathematics education. Journalof Computer and Education Research, 2(4), 152-165.
Tatar, E., Okur, M., & Tuna, A. (2008). Ortaöğretim matematiğinde öğrenme güçlüklerinin saptanmasına yönelik bir çalışma. Kastamonu Eğitim Dergisi, 16(2), 507-516.
Tekin, B., Konyalıoğlu, A. C., & Işık, A. (2009Examining of secondary school students' abilities to drawing the function graphics. Kastamonu Education Journal, 17(3), 919-932.
Walcott, H. F. (1994). Transforming Qualitative Data: Description, Analysis and Interpretation. London: SAGE Publications
Williams, S. (1997). Algebra: what students can learn. The nature and algebra in the K-14 curriculum. Proceedingsof a National Symposium, Washington, DC, May 27-28.
Yavuz, İ., & Kepceoğlu, İ. (2010). Investigation of students' approaches towards operations on functions via their graphic representation. Sakarya University Journal of Education Faculty, 20, 59-80.
Yıldırım, A., & Şimşek, H. (2005). Sosyal bilimlerde nitel araştırma yöntemleri (5. basım). Ankara: Seçkin.