Issues
ISSN: 2146-4138
available at http: www.econjournals.com
International Journal of Economics and Financial Issues, 2017, 7(1), 207-213.
Exchange Rate Uncertainty Effect on Export-Oriented
Companies at Tehran Stock Exchange (Yield) Rate of Return:
A Panel-Vector Autoregressive Model
Gholamreza Zamanian
1*, Kamran Mahmodpour
2, Sepideh Yari
31University of Sistan and Baluchestan, Zahedan, Iran, 2University of Sistan and Baluchestan, Faculty of Management and
Economics, Zahedan, Iran, 3University of Sistan and Baluchestan, Zahedan, Iran. *Email: [email protected]
ABSTRACT
The main purpose followed in this research is to analyze effect of exchange rate uncertainty on the export-oriented companies’ rate of return at Tehran
Stock Exchange applying panel-vector autoregressive model during 2004-2014. The results indicate that the companies’ rate of return is affecting by factors such as (exchange rate uncertainty, profitability index, size of company, debt ratio, book value to market value of each stock ratio). In accordance with the results, the return’s response to leverage index (debt ratio) is consistently negative while the return’s responses to profitability index and the book value to market value are positive at first and then turn negative. In addition, the size of company initially affects the rate of return negatively and then has an insignificant positive effect on it, which means the greater the company is, the more rate of return it has in long term. Consequently,
it is indicated that the effect of exchange rate’s uncertainty on export-oriented companies’ rate of return is positive in both short and long run; which presents that the more exchange rate uncertainty is, the more rate of return we will have in long run.
Keywords: Exchange Rate, Tehran Stock Exchange, Panel Vector Autoregressive Model JEL Classifications: F31, G2
1. INTRODUCTION
At the time of international trade increase among countries,
the exchange rate fluctuations play the role of most important
resources of company’s risk which is more unstable in compare
with other macroeconomic variables such as interest rate (4 times) and inflation (10 times) (Jorion, 1990). This instability leads to
an uncertainty in exchange market and risk increase at stock market that eventually affects rate of return in these export-base companies.
Thus, one of export-oriented companies’ challenges is the trend
of exchange rate that can influence the export-base companies’ incomes. In fact, while the exchange rate reduces, the profitability
of the companies decreases and at the same time as the exchange
rate increases internal exchange resources deficit can exposure the
share of these companies in export and gross domestic production
of country to risk. In consequence, the majority of investors
always look closely to the exchange market. Therefore, regarding
the individuals’ budget and the liquidity degree of markets, the
exchange markets known as one of the main rivals of stock market.
However, fluctuations and uncertainty existence in stock market lead to liquidity ingress or egress in this market (Chen et al., 2005).
In economics the exchange rate uncertainty literary concerns the imprecision and unpredictability of this variable, that can affect companies’ returns over time. Hence, exchange rate variations an important factor in forming expectations of companies and investors and its imprecision put them in uncertainty condition. Therefore, this research will pursue the effect of uncertainty on rate
of return of accepted export-oriented medicine and chemical firms
at Tehran Stock Exchange applying panel vector autoregressive
(PVAR) model. This paper organized in four sections. First
introduction, second we have the literature review and empirical
background, then the data and methodology and finally we state
2. LITERATURE REVIEW
Regarding the importance of the issue, different national and
international studies on this subject presented subsequently.
Heydari et al. (2013), analyzing the relationship between the
real exchange rate uncertainty and the total index of stock price in Tehran Stock Exchange applying bonds test which indicates
a significant and negative relationship between price index and
exchange rate in both short and long run. Kouchak Zadeh and
Jalaie (2013), study the effect of exchange rate uncertainty on non-oil exports of Iran implementing ECM and AR methods. They
concludes that the value of exchange rate uncertainty effect on
the non-oil exports is approximately 1.06 in short run and in long run the this value equals to 7.29 which is negative and significant.
In another article on this subject, Mashayekhi et al. (2008)
analyze the effect of macroeconomic variables on the relationship
between the basic variables extracted from financial statements
and accepted companies in Tehran Stock Exchange rate of return
during 1993 to 2004. The results includes that the total index of
stock price, the adjusted gross domestic production in basic price
without oil, gross domestic expenses, oil revenues, inflation rate and the gross national income have a significant effect on this
relationship. However, variables such as number of stock transfer
of public sector, deficit (excess) budget, crude oil export, the unofficial market exchange rate, Gini coefficient, tax revenues,
unemployment rate, current accounts balance, and the 1-year
investment interest rate are ineffective and insignificant on this
relationship.
Chang (2001), in a research on the exporting companies accepted in Taiwan during the financial crisis of Asia, realized that the exchange rate volatilities have a significant impact on most of these companies’ return. However, he did not get a specific
result from the effect of exchange rate volatilities on importing companies’ return.
In 1998, Michael presented a survey the impact of exchange
rate volatilities on Australia’s trade applying conditional heteroskedasticity model, which indicates the positive possible effect of exchange rate volatilities on exports sector and its negative effect on imports, aversely.
Liang et al. (2013) had a review on the relationship between stock
prices and the exchange rate implementing Granger panel method. He discovered the negative effect of exchange rate on stock prices through investment.
Serletis et al. (2009) studied the effect of exchange rate uncertainty
on export applying augmented conditional heteroskedasticity and multi variable VAR methods, which indicate the negative effect of exchange rate uncertainty on export.
Grossmann et al. (2014), in analyzing the most destabilizers
dynamics of exchange rate volatilities components implementing spectral separation method, discover the dynamics among
volatilities as well as exchange rate volatilities feedback effects
on macroeconomic and financial variables which is greater in
developing countries in compare with developed ones.
Christiana (2012) studied the relationship between stock return
and exchange rate variations in 13 countries applying Granger
casualty method since 1997 to 2012. The remarkable results of
this study indicate capital market and exchange rate transition as two interactive time series in Korea revealing a two-side casualty
significant in 1% criterion. Moreover, they realized that the exchange rate transition has a significant effect on stock returns
in Brazil and Russia while the capital market is a risky factor for USA’s exchange rate.
Caporale et al. (2014) in a survey on the nature of stock price
and exchange rate relationship in six developed economies (USA,
England, Canada, Japan, Euro region, Switzerland) using Banking crisis data for 2007-2010, at first for analyzing the relationship
between the two variables applies VAR-generalized autoregressive
conditional heteroskedasticity (GARCH) model and in the next
step uses unrestricted extended dynamic conditional
correlation-GARCH model. The correlation results indicate that the dependence
of the variables have increased during the recent crisis.
In accordance with the empirical studies implemented, there is
no study, which specifically analyzes the impact of exchange
rate uncertainty on export-oriented companies’ returns applying PVAR model. Most of the studies indicate that for estimating the exchange rate uncertainty different approaches applied which in
the majority the ARCH and GARCH models utilized for assessing
the exchange rate uncertainty and several different econometrics methods for analyzing the relationship between the two variables. Therefore, in here for estimating the exchange rate uncertainty and analyzing the relationship between this variable with rate of return, the Panel-VAR model applied in which the necessity of estimating the exchange rate uncertainty in separate, resolves.
3. THEORETICAL BACKGROUND
Mehrabi and Bashrabadi (2011) argue that the relationship between firm’s profitability and exchange rate changes depends on the type
and the nature of industry. The exchange rates increase causes rise
in value of exchange assets of firm. In fact, the firms which acquire
exchange assets will be more valuable if the exchange rate rises and conversely for those which have exchange debts, a rise in exchange rate leads to increase in their debts as well as decrease
in firm’s value for stockholders (Naeini et al., 2003).
3.1. Yield Rate
Stock yield is an important and complex concept which affected by different factors. Stock yield depends on factors such as
profitability index, leverage index (debt ratio), firm’s size and book value to each stock value ratio and etc. (Shahroudiani et al., 2013).
A normal (common) stock investment return, in a specific period,
obtained regarding the primary and end of period price and
period unless, the benefits equals to zero. The investment rate of
return in stocks is estimated as follow:
r p p
p
it = t− t−1+ t ×
1 100
d
pt: Price of each share at the end of period t,
pt−1: Value of each share at the beginning of period t,
dt: Stocks’ benefits of possession, which accrue to the stockholder
t period (Sayadi, 2010).
Benefits of possession can be paid to stockholders in different
ways, whereby we mean to use the dividend.
3.1.1. Effective factors on yield rate (rate of return) 3.1.1.1. Firm’s size
One of the internal and structural factors of companies, which
affect their yield and profitability, is the size of company. This issue
has closely studied by many scholars but there is not an agreement
on which type of companies (small size or larger companies) are more profitable. Some of them believe in larger companies more profitability due to the following reasons:
3.1.1.2. Debt to asset ratio
This ratio shows the financed assets percentage by debt and compares all commitments (in both short and long term) with all assets (Drake and Fabozzi, 2012). This ratio obtained by dividing total debts to total assets. Managers intend to finance the companies’ financial necessities through debts, due to its advantages. Nevertheless, financing through debt has interest cost and this makes companies to pay a part of their incomes financing costs. In subsequent, their future profitability will decrease (Sayednejad and Aghaei, 2002).
3.1.1.3. Book value to market price ratio
This ratio is defined as B/M and indicates the percent change in book value to market value. This ratio is also used as M/B
alternatively that state the percent of increase in market value to
history value (Deane and Pringle, 1984).
3.1.1.4. Profitability of company
Consists of the price to income ratio of each share, which shows the required time for capital return from stocks’ future proceed (Ghaemi and Toosi, 2006).
Baso, during a period including April 1957 to March 1971, indicated that the stocks with low P/E ratio (or with high E/P ratio) significantly gained more yields of stocks (Saghafi and Salimi, 2005).
3.1.1.5. Exchange rate uncertainty
Exchange rate is one of determinant factors in profitability and efficiency assessment of investment projects. In fact, the exchange rate stability leads to a secure domestic economy and consequently,
investors can make a decision on investing at present and future
easily (Samimi et al., 2013).
Uncertainty includes unanticipated changes in an economic variable as these changes are unpredictable in future and could highly affect other economic variables. Uncertainty in exchange rate leads to future price’s uncertainty of goods and through this, economic factors’ decisions are affected (Moradpooladi
et al., 2008).
During three past decades, many researchers conducted on surveying of the relationship between companies’ stock return and exchange rate. Although in literary point of view, exchange
rate fluctuations have significant effect on stock returns, empirical
evidences show that this relationship is vulnerable.
4. RESEARCH METHODOLOGY AND MODEL
PRESENTATION
The current studying applied descriptive-analysis method. The data used in the current sample are the annual export-oriented companies’ return index at Tehran Stock Exchange and free market
exchange rate compiled from the Iranian Central Bank report and Tehran Stock Market website and spans the time period 2004-2014.
In order to test the exchange rate uncertainty effect on return rate of
accepted medicine and chemical firms at Tehran Stock Exchange
employing a VAR panel data model which is similar to VAR model structurally, i.e. all the variables are considered endogenous.
The two variables PVAR models generally generated as follow:
Z Z a a a a a a Z Z it it i t i 1 2 10 20 11 12 21 22 1 1 = + ,− .tt i t i t e e − + 1 2 1 2 , . e e N it it 1 2 0
~
( )
,ΣWhere,
∑
= ⇒ + + + + − − −
12 12
12 22 0 1 1 2 2
3 3
Z = A A Z A Z
A Z
i,t i t i t
i t
, ,
, ee eit it ~ ( , )N 0Σ
Where, A0 = B−1Г0, A1 = B−1Г1 and eit = B−1εit (1) Where i (i = 0,…, N) show the surveyed companies and
t (t = 0,…,T) show the time and zi,t is dependent variable which consist of yield rate (r), (PE ) indicating company’s profitability,
(lev) is the debt to asset ratio, (me) firm’ size, (btm) book value to
price ratio and is exchange rate uncertainty.
z P
E lev me r ex btm i,t
it it it it it it
=( , , , , , )
Equation (1) is a PVAR standard model. Considering theoretical
EXit = a11peit−1 + b11levit−1 + c11MEi,t−1 + d11Ri,t−1 + e11BTMit−1 + εit peit = a21EXit-1 + b21levit−1 + c21MEi,t−1 + d21Ri,t−1 + e21BTMit−1 + εit
levit = a31EXit−1 + b31peit−1 + c31MEi,t−1 + d31Ri,t−1 + e31BTMit−1 + εit MEi,t = a41EXit−1+ b41peit−1 + c41levit−1 + d41Ri,t−1 + e41BTMit−1 + εit Ri,t = a51EXit−1 + b51peit−1 + c51levit−1 + d51MEi,t−1 + e51BTMit−1+ εit
BTMit = a61EXit−1 + b61peit−1 + c61levit−1 + d61MEi,t−1 + e61Ri,t−1 + εit
(2)
Variables used in above equations are defined in Table 1.
4.1. Empirical Results of Estimation of Paradigms and Interpretation of Results
4.1.1. Unit root test
The main idea of stationarity of variables is concerned the stability of moments of a time series. Stationarity is important as
all statistical deductions on estimated coefficients of regression equations based on the variables constancy assumption, unless
none of the statistical deductions is true. Thus, the stationarity of the variables need to be tested before estimation as non-stationarity can leads to spurious regression in both time series and panel data types. However, unlike time series, in panel data we cannot use the
common Dickey-Fuller (DF) and augmented DF tests. Hence, we
should test the stationarity of variables applying the co-integration
approaches (Dehshiri et al., 2012). In so doing, Loven Lin Cho test, specifically designed for panel data, performed which results
are presented in the Table 2.
The null hypothesis of Loven Lin Cho test considered as
non-stationarity of variables. So, in case the estimated statistic is larger
than the confidence level value, the null hypothesis will be rejected.
According to Table 2, the results suggest that the non-stationarity of variables has been rejected, i.e., all the variables are stationary. As we assure that all the variables are stationary, there is no need
to implement the co-integration test and as a result we will not encounter with an spurious regression and we can estimate the model safely.
4.1.2. Analyzing the spontaneous reaction equations
In this part, the estimation of the coefficients proceeded using a PVAR model and concentrating on fixed effects approach.
Analyzing the impulse response functions reveals the schedule of shocks’ effects. In these functions, the effect of a standard deviation of one variables’ shock is regressed on the other variables. In order to estimate the function, the Lao and Zikchino approach in STATA
software applied. The results could be observed in Chart 1.
Regarding the impulse response functions it is concluded that the exchange rate uncertainty effect on rate of return is negative at
first two periods and then became positive, i.e., with an increase
in exchange rate uncertainty, the companies’ return falls and then rises. In fact, due to an abrupt increase in exchange rate price
in long-term, the export-oriented companies gain more benefit
through rising the export to foreign countries. In addition, the
profitability index effect on return is positive at first but becomes
negative during the time. i.e., with an increase in each stock’s price or decrease in companies’ income, the return will decrease.
Debt to asset ratio is negative and insignificant meaning the debt
increase of company leads to decrease in its return, while the
response of this ratio to return is positive at first and then switches negative. Company’s return response to firm size is negative at first but then it is positive and negligible, i.e., at early periods the
smaller the company is, the more return it has but this relation
changes inversely in long run. In fact, firm’s growth in size will
provide the capability to reduce the trade risk through products
diversification. Products diversity, market magnitude, increase
in company’s share in product’s market, economies of scale and product’s low costs are potential advantages which increase
the firm’s profitability power. Furthermore, the great number of
stock and stockholders of big-size companies enables numerous vendees to buy or sell the company’s stocks. As a result, the
liquidity risk will decrease for stockholders of big companies and less return is expected for them. Consequently, the book value
Table 1: Introducing of used variables in research
Variables Defining How to calculate Data collecting resource
Ri,t Return rate
R P P D
P
it t t t t
= − −1+ Tehran Stock Exchange website
MEi,t Firm’s size Log of total assets Tehran Stock Exchange website
levit Asset to debt ratio Dividing total asset to total debts Tehran Stock Exchange website
exit Exchange rate uncertainty Using PVAR model Central Iranian Bank
P Eit
Profitability ratio Price to cash profit of each share ratio Tehran Stock Exchange website
btmit Book value to market value ratio Dividing book value to market value of stocks at the end of
each year Tehran Stock Exchange website
Table 2: Testing stationarity of variables using Loven Lin Cho test
Variables Pe Me lev r btm Ex
Test statistics 1/79,760 2/98,623 −6/28,009 −35/9829 70/1683 −1/80,721
to market value of each stock (BTM) on rate of return had been positive at first, but then had become negative, means it is possible
that the book value increase or the market increase of each share
leads to return’s increase in long run. As we can see in Chart 1, the exchange rate uncertainty has the most significant effect on
companies’ return, so that the policy makers should pay a closer
attention to exchange rate index and the consequent volatilities
accompanied by a set of policies, which lead to further exports and less imports.
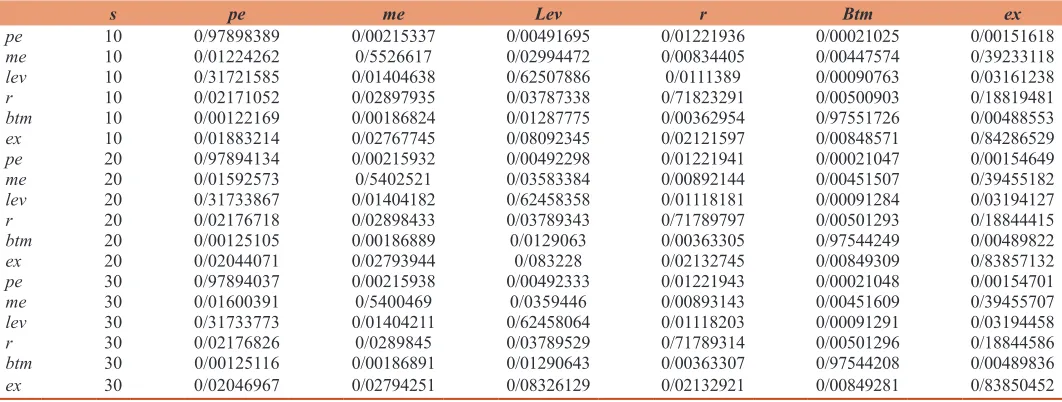
4.1.3. Variance decomposition
One the VAR model analysis tools is the variance decomposition. variance decomposition is method that measures prediction errors of the power of Granger causality continuum or the indigeneity degree of variables. The point of estimating the variance decomposition index is relatively to demonstrate the amount and importance of a shock resulted by one variable and the other variables. This method applied to describe the dynamism of the model and reveals the explanatory percent of each variable caused by the dependent
Chart 1: Impulse response functions
Table 3: Variance decomposition results
s pe me Lev r Btm ex
pe 10 0/97898389 0/00215337 0/00491695 0/01221936 0/00021025 0/00151618
me 10 0/01224262 0/5526617 0/02994472 0/00834405 0/00447574 0/39233118
lev 10 0/31721585 0/01404638 0/62507886 0/0111389 0/00090763 0/03161238
r 10 0/02171052 0/02897935 0/03787338 0/71823291 0/00500903 0/18819481
btm 10 0/00122169 0/00186824 0/01287775 0/00362954 0/97551726 0/00488553
ex 10 0/01883214 0/02767745 0/08092345 0/02121597 0/00848571 0/84286529
pe 20 0/97894134 0/00215932 0/00492298 0/01221941 0/00021047 0/00154649
me 20 0/01592573 0/5402521 0/03583384 0/00892144 0/00451507 0/39455182
lev 20 0/31733867 0/01404182 0/62458358 0/01118181 0/00091284 0/03194127
r 20 0/02176718 0/02898433 0/03789343 0/71789797 0/00501293 0/18844415
btm 20 0/00125105 0/00186889 0/0129063 0/00363305 0/97544249 0/00489822
ex 20 0/02044071 0/02793944 0/083228 0/02132745 0/00849309 0/83857132
pe 30 0/97894037 0/00215938 0/00492333 0/01221943 0/00021048 0/00154701
me 30 0/01600391 0/5400469 0/0359446 0/00893143 0/00451609 0/39455707
lev 30 0/31733773 0/01404211 0/62458064 0/01118203 0/00091291 0/03194458
r 30 0/02176826 0/0289845 0/03789529 0/71789314 0/00501296 0/18844586
btm 30 0/00125116 0/00186891 0/01290643 0/00363307 0/97544208 0/00489836
ex 30 0/02046967 0/02794251 0/08326129 0/02132921 0/00849281 0/83850452
REFERENCES
Caporale, G.M., Hunter, J., Ali, F.M. (2014), On the linkages between
stock prices and exchange rates: Evidence from the banking crisis
of 2007-2010. International Review of Financial Analysis, 33(C), 87-103.
Chang, C.H. (2001), Taiwanese TOEFL-CBT Scores Rank Better than Only Three Other Asian Countries (Wo To Fu Tien Nao Tse Yen Ya Chou Tao Shu Ti Szu)." United Daily News, December 31, 2001. p10. [In Chinese].
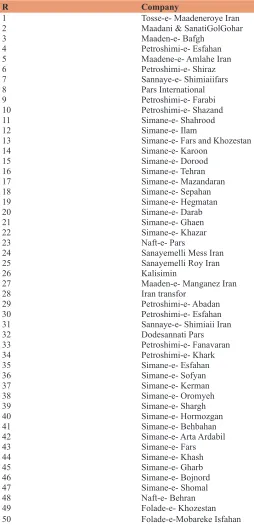
Chen, J., Strange, R. (2005), Determinants of capital structure: Evidence Table 4: List of surveyed export-based companies
R Company
1 Tosse-e- Maadeneroye Iran 2 Maadani & SanatiGolGohar 3 Maaden-e- Bafgh
4 Petroshimi-e- Esfahan
5 Maadene-e- Amlahe Iran 6 Petroshimi-e- Shiraz 7 Sannaye-e- Shimiaiifars 8 Pars International
9 Petroshimi-e- Farabi
10 Petroshimi-e- Shazand 11 Simane-e- Shahrood 12 Simane-e- Ilam
13 Simane-e- Fars and Khozestan 14 Simane-e- Karoon
15 Simane-e- Dorood 16 Simane-e- Tehran 17 Simane-e- Mazandaran 18 Simane-e- Sepahan
19 Simane-e- Hegmatan
20 Simane-e- Darab 21 Simane-e- Ghaen 22 Simane-e- Khazar 23 Naft-e- Pars
24 Sanayemelli Mess Iran
25 Sanayemelli Roy Iran
26 Kalisimin
27 Maaden-e- Manganez Iran 28 Iran transfor
29 Petroshimi-e- Abadan
30 Petroshimi-e- Esfahan 31 Sannaye-e- Shimiaii Iran 32 Dodesannati Pars 33 Petroshimi-e- Fanavaran 34 Petroshimi-e- Khark
35 Simane-e- Esfahan 36 Simane-e- Sofyan 37 Simane-e- Kerman 38 Simane-e- Oromyeh
39 Simane-e- Shargh
40 Simane-e- Hormozgan 41 Simane-e- Behbahan 42 Simane-e- Arta Ardabil 43 Simane-e- Fars 44 Simane-e- Khash
45 Simane-e- Gharb 46 Simane-e- Bojnord 47 Simane-e- Shomal 48 Naft-e- Behran
49 Folade-e- Khozestan
50 Folade-e-Mobareke Isfahan
variable over the time. In other words, it means that how much of the dependent variable’s changes are explained through each
explanatory variable over time (Nasrollahi et al., 2013).
The obtained results show that the portion of “pe” in explanation of
errors made by itself is 97% and the portion of return and exchange rate uncertainty is 0/01 and 0/001 respectively (Table 3). In rate of
return decomposition the biggest share belongs to itself and in the
second level it goes to the exchange rate uncertainty with 18%,
i.e., the exchange rate uncertainty has the greatest effect on rate of return. Further, the biggest share of exchange rate uncertainty
after itself belongs to the leverage ratio (debt to asset ratio) and finally most significant share of firm’s size after itself is belongs to
the exchange rate uncertainty. The results are same for the second and the third decades.
5. RESULTS AND SUGGESTIONS
The main purpose followed in this research is the analysis of the exchange rate uncertainty effect on rate of return on data compiled
from 50 export-oriented firms at Tehran Stock Exchange using a PVAR model covering the period 2004-2014. The stationarity test
of the data based on the Levin approach revealed the stationarity of all variables. Then the estimation was conducted applying the PVAR model.
The results of evaluating the relationship between the exchange rate uncertainty and rate of return indicate that with an increase
in firm’s debt, the return decrease in long run. Thus it is suggested
to managers to consider this problem seriously in both designing
and financing the firm and regard the cost-benefit analysis in
utilizing the bank loans. In addition, with an increase in price of each share or a decrease in companies’ income, the return rate will decrease in long run. Furthermore, if the book value of each share increases or the market value of each share decreases, the
firm’s return will decrease in long run. Moreover, in long run, the bigger the company is, the more return it has. In fact, firm’s
growth in size will provide the capability to reduce the trade risk
through products diversification, and increase the profitability of
the company.
Therefore, it is suggest to investors to consider the mentioned parameter in selling or buying the shares and adjust their decisions based on this factor. Finally, with an increase in the exchange
rate uncertainty, the firm’s return will decrease in short term but
increases in long run.
The results suggest that the exchange rate and its volatilities can cause turbulences and instabilities in future of export-oriented companies, which draws governments’ attention to determine a set of exchange rate policies so that it leads to more export
and less import (Table 4). Further researches on exchange rate
uncertainty analysis needs to apply other control variables (such
as beta, other leverage indices and so on). However, a comparison
from Chinese listed companies. Economic Change and Restructring, 38, 11-35.
Christiana, L. (2012), Faktor-faktor yang mempengaruhi praktek perataan laba pada perusahaan manufaktur di BEI tahun 2008-2010. Jurnal Ilmiah Mahasiswa Akuntansi, 1(4), 71-75.
Deane, M., Pringle, R. (1984), Economic Cooperation from the Inside. New York: Group of Thirty.
Dehshiri, H.M., Mirfatah, M., Sharifi-e-Ranani, H. (2012), P-VAR
Analysis of Effect of Liberalization Factors Effect on Financial
Market’s Performances in Selected Developing Countries: Focus on Financial and Monetary Liberalization, International Conference of Econometrics, September, 2012.
Drake, P.P., Fabozzi, F.J. (2012), Analysis of Financial Statements. 3rd
ed. Hoboken, NJ: Wiley. p 97-103.
Ghaemi, M., Toosi, S. (2006), The factors affecting the yield of common
stock listed companies in Tehran Stock Exchange. Journal of Management Message, Numbers 17 and 18, Winter 84 and Spring
85. p175.
Grossmann, A., Love, I., Orlov, G. (2014), The dynamics of exchange rate
volatility: A panel VAR approach. International Financial Markets, Institutions & Money, 33, 1-27.
Heydari, H., Faaljoo, H., Karami, F. (2013), Survey of real exchange
rate uncertainty on stock price total index in Tehran stock exchange at framework of boundaries test approach. Seasonally Journal of
Islamic-Iranian Approach Economic Research, 49, 151-176. Jorion, P. (1990), The exchange-rate exposure of U.S. Multinationals.
Journal of Business, 63, 331-345.
Kouchak, Z.A., Jalaie, A. (2013), Effect of exchange rate uncertainty on non-oil exports in Iran. Journal of Economic Research, 3, 121-135. Liang, C.C., Lin, J.B., Hsu, H.C. (2013), Reexamining the relationships
between stock prices and exchange rates in ASEAN‐5 using panel granger causality approach. Economic Modelling, 32, 560-563. Mehrabi, J., Bashrabadi, I. (2011), Exchange rate uncertainty effect
on Iranian agricultural sector. Journal of Agricultural Economic
Researches, 3(1), 27-46.
Moradpooladi, M., Ebrahemy, M. (2008), The effect of the real exchange
rate uncertainty on private investment. Journal of Economic
Research, 11(35), 159-176.
Naeini, A., Aslay, H. (2003), Effect of exchange rate on stock returns in Iran. Journal of Financial Research, 5, 15.
Nasrollahi, K.H., Moghadasfar, S., Mostolizadeh, S.M. (2013), The determination of the equilibrium exchange rate and the impact of
its deviation from the actual rate on the four sectors of the Iranian
economy. Economic Journal, 13(9), 5-22.
Saghafi, A., Salimi, M. (2005), The fundamental accounting variables and stock returns. Journal of Accounting Advances, 22(1), 79-117. Samimi, A., Ghobadi, N. (2016), Assessing deviation of the real exchange
rate behavior-based assessment approach. Journal of Economic
Policy, 8(15), 55-76.
Sayadi, E. (2010), AS Effect of Exchange Rate Changes on the Economy's
GDP, Master Thesis, School of Economics and Social Sciences
Martyr Chamran University, February 88.