laza
11111(
Soil property patterns and
topographic parameters
associated with ephemeral
gully erosion
R.D. Lentz, R.H. Dowdy, and R.H. Rust
ABSTRACT. The pattern of ephemeral gully erosion and associated soil properties were investigated in three southeastern Minnesota soilscapes during 1988 and 1989. The associations between topographic attributes and erosion characteristics of sample sites were also examined. No ephemeral erosion was measured after the investigation began in the drought year of 1988. In 1989 soil lost from ephemeral gullies ranged from 0.8 to 1.6 Mg/ha (.4 to .7 ton/ac) at the study sites, or one-tenth of that reported in the literature for similar watersheds. Pre-1988 data avail-able at one site showed that soil voidage was an order of magnitude greater dur-ing the wetter-than-normal 1986 season. A simple erosion model predictdur-ing topsoil removal and subsoil mixing in upper reaches and deposition in lower ephemeral gully reaches, does not accurately describe erosion processes in these landscapes. Impact of ephemeral erosion on soil properties in landscapes varied depending on relative 1) rill and interrill contributions, 2) proclivity for channel drifting, and 3) occurrence of depositional sorting in channels. Topographically sensitive controls of ephemeral erosion, such as surface saturation and stream transport capacity, played different roles in channel formation at each site. Topographic indices most
useful for predicting ephemeral erosion were planform curvature, profile curva-ture • slope, Ln (unit area/slope), unit area • slope, and planform curvacurva-ture•up- curvature•up-stream contributing area •slope.
S
OIL conservationists began
system-atic study of ephemeral gully ero-sion only in the last decade (5). Ephemeral gullies are scoured by con-centrated flow, but unlike rills, ephemeral channels are believed to recur in the same location each season and are strongly controlled by land-scape configuration. Ephemeral gullies are larger than rills but are smaller than gullies, i.e., small enough to allow pas-sage of tillage implements. Ephemeral channels tend to form in swales or de-pressions in the upper reaches of a drainage network (6). To date, relative-ly few studies have attempted to quanti-fy ephemeral erosion or describe pat-terns of gully formation (18). Present data suggest that sediment production from ephemeral erosion may range from 14 to 147 percent of that produced by interrill and rill erosion (7). Repeat-ed cycles of ephemeral channelforma-R.D. Lentz is with the USDA ARS in Kimber-ly, ID 83341; R.H. Dowdy is with USDA-ARS, University of Minnesota, St. Paul 55108, and R.H. Rust is in the Soil Science
Department at the University of Minnesota,
St. Paul 55108. The authors thank Dr. Ian Moore for assistance in computing site
DTMs and Richard Baird and the SCS for providing pre-1988 data on ephemeral gully formation at the Mower site.
tion and tillage filling remove a greater volume of topsoil from these areas and can quickly reduce crop yields (1).
The importance of employing overall landscape analysis to assess hydrology, soil erosion, soil property, and crop productivity conditions has been em-phasized in the literature (10). Ultimate-ly, landscape analysis permits examina-tion of spatially dependent characteristics and processes, and de-velops causal or predictive relationships that are universally applicable in diverse environments. To achieve this goal, re-searchers require a nonpositional method of relating spatial properties within landscapes. In other words, the location in a landscape associated with certain characteristics of interest is not defined in terms of fixed coordinates but by parameters that describe process potentials inherent at the location. Soil map unit components are considered nonpositional and have been employed to make inferences concerning charac-teristics and processes at given loca-tions. However, map unit components do not provide enough specific infor-mation on shape of land surface, which influences hydrologic processes. Be-cause landscape processes are very sen-sitive to landscape configuration,
Table 1. Estimated soil voidage from ephemeral gullies at study sites.
Site Date Crop Cover"
Event Rainfall
Rainfall Duration
Soil Voidage mm hours Mg ha'
Olmsted 4/3/89 Corn 15r 15 7.5 0.5
Olmsted 8/4/89 Corn 100c 49 2 1.0
Rice 4/1/89 Soybeans 7r 7 2 2.1
Mowert 5/13/86 Soybeans 25r 53 24 6.9
Mowert 7/5/86 Soybeans 25c 25 6 2.4
Mowerf 7/26/86 Soybeans 80c 53 16 0.5
Mowert 7/8/87 Soybeans 35c 48 7 5.5
Mower 4/3/89 Soybeans 15r 15 7 0.2
Mower 7/11/89 Soybeans 80c 35 4.5 0.6
Surface cover given for crop (c) or residue (r). t Unpublished data of USDA SCS
Bulk density (Mg m 3) Olmsted 1.15; Rice 1.23; Mower 1.22 meters have been derived from
topo-graphic attributes.
Parameters such as topographic posi-tion, aspect, slope, surface curvature parallel (profile), and perpendicular (planform) to direction of maximum slope, length of contributing slope (up-stream distance), and a parameter relat-ed to unit area (A), definrelat-ed as upstream contributing area divided by unit con-tour length, have been related to soil properties in landscapes (4, 12, 15).
Unit contour length is defined as the size of land surface unit that forms the basis of calculated hydrologic parame-ters (10). Indices listed above also are related to soil water content (8). An ad-ditional composite parameter, unit area divided by slope (As), has been shown to successfully describe differences in soil water content across the landscape
(2, 11). Thome et. al. (19) employed a composite topographic index (CTI), the product of upstream contributing area, slope, and planform curvature, as an index of the erosive power of concen-trated flow to predict where ephemeral gullies occur in the landscape. Two composite parameters were employed by Moore (11) for the same purpose. At lower positions in the catchment, ephemeral gully locations were best predicted from the composite parameter (unit area •slope) or ABS; whereas at upper catchment positions, location of gullies were predicted by log of As (LNAS).
The objectives of this research were three-fold: 1) identify the pattern of ephemeral erosion and measure chan-nel voidage occurring across small wa-tersheds in three contrasting soilscapes of southeast Minnesota; 2) determine how soil properties are related to topo-graphic parameters and examine the re-lationship between either soil properties or topographic parameters with ephemeral gully erosion; and 3) test the following hypothesis—ephemeral gully erosion may be modeled simply as a process in which topsoil is removed from an area immediately adjacent to recurrent channels and deposited at low lying positions. We will refer to this hy-pothesis as the conventional ephemeral erosion model.
Study area and methods
Mean annual precipitation in the re-gion studied is about 735 mm (29 in); 67 percent falls during the growing sea-son from May to September. Thunder-storms occur on about 45 days during the warm months from April to
Septem-ber. Soil frost develops around Decem-ber 1 and thaws in mid-April. Precipita-tion has fluctuated wildly over the last decade. September 1986 marked the abrupt end of one of the wettest decades on record. Subsequent years were droughty. Southeastern Minnesota warm-season precipitation was 80-90 percent of normal in 1987, 50-75 per-cent of normal in 1988, and 75 perper-cent of normal in 1989 (20).
Study sites were subject to severe ephemeral erosion and were represen-tative of regional soil and cropping pat-terns (corn and soybeans). Minimal conservation practices were employed. Tillage practices included conventional clean tillage across slope to prepare seedbed and plant, a single mid-season cultivation to control weeds, and fall chisel or disking with 5-25 percent crop residue remaining.
Sites were named for the county in which they were located. Figure 1 de-scribes soils at the study sites. The Olm-sted site was located about 7 km (4 mi) north of Rochester (SE 1/4, NE 1/4, SE 1/4, Sec. 10, T. 107 N., R. 14 W.). Its wa-tershed encompasses an area of 1.8 ha (4.4 ac), has a vertical relief of about 18.5 m (60 ft), a mean slope of 8.6 per-cent, and a predominant south-south-west aspect. Soils formed in a mantle of loess that ranges from one to more than two meters in thickness. Port Byron silt loam, 1-5 percent slopes (fine-silty, mixed, mesic Typic Hapludolls) occurs on summit and backslope positions; Lindstrom silt loam, 6-16 percent slopes (fine-silty, mixed, mesic Cumulic Haplu-dolls) occurs on footslope and toes-lopes.
The Rice site was located approxi-mately 66 km (40 mi) south of Min-neapolis (NE 1/4, SE 1/4, SE 1/4, Sec.
26, T. 111 N., R. 22 W.) on a 2.4 ha (6 ac) watershed with a mean slope of 6.1 percent and a westward aspect. Vertical relief is about 14 m (46 ft). This water-shed lies in a glacial wastage landscape that is characterized by a complex topography and deranged drainage pat-tern. Lerdal silty clay loam, 2-6 percent slopes, and 6-12 percent slopes, eroded (fine, montmorillonitic, mesic Udollic Ochraqualfs) occur on backslopes and Lura silty clay loam (fine, montmoril-lonitic, mesic Cumulic Haplaquolls) oc-cupies footslope and toeslope positions. The Mower site lies about 24 km (15 mi) southwest of Rochester (NE 1/4, SE 1/4, SE 1/4, Sec. 15, T. 104 N., R. 15 W.). Mower is a 3.15 ha (8 ac) water-shed with a mean slope of 3.4 percent, a southerly aspect, and a vertical relief of about 19 m (62 ft). Soils developed in firm glacial till overlain by a thin mantle of loess from 0.09 to 0.5 m (.3-1.5 ft) thick. Tripoli silty clay loam (fine-loamy, mixed, mesic Typic Hap-laquolls) occurs on summits and back-slopes while Readlyn silt loam (fine-loamy, mixed, mesic Aquic Hapudolls) occupies swales and footslopes.
Air temperature, humidity, wind speed and direction, and rainfall were measured at Rice. Recording rain gauges were installed at Mower and Olmsted, and field measurements were begun in late May 1988. During the summer of the 1988 drought, rain-storms were not sufficiently intense or persistent to produce ephemeral ero-sion. During 1989, ephemeral gullies developed at each site during early spring before fields were planted, and again at Mower and Olmsted in late summer. Figure 2 presents rainfall data associated with ephemeral erosion events at each site.
Table 2. Pearson's coefficients for all significant correlations between topo-graphic parameters and field properties.
Topographic Parameter
Correlated Correlations
Property Olmsted Rice Mower Channel cross- Sand (18-35cm) 0.56t 0.36* -0.42*
sections A horizon thickness 0.10 -0.22 -0.53* Planform curvature 0.49t 0.56t 0.37$ Deposition type Organic carbon (5-15cm) -0.47t 0.29 0.26 (extent of depo- Bulk density (5-15cm) 0.54t -0.28 -0.35 sition present in Bulk density (18-35cm) 0.41* -0.12 -0.61f channel) Sand (18-35cm) 0.42* 0.18 0.21
Clay (18-35cm) -0.18 -0.44* -0.27 A horizon thickness -0.10 0.38* 0.05
Slope -0.60* -0.42 -0.62t
Distance to Organic carbon (5-15cm) 0.38* 0.09 0.45* channel Clay (5-15cm) -0.50t 0.05 0.24
Sand (18-35cm) -0.47t -0.28 -0.04 A horizon thickness -0.47t 0.21 0.39 Planform curvature -0.35$ -0.72t 0.21 Upstream area Organic carbon (5-15cm) 0.38* 0.16 0.30 Slope Organic carbon (5-15cm) 0.04 -0.60t -0.34 Sand (5-15cm) -0.23 0.37* 0.19 Bulk density (18-35cm) -0.37* 0.54t 0.69t Sand (18-35cm) -0.47* 0.22 -0.31 A horizon thickness 0.17 -0.71t -0.06 Planform curvature Sand (18-35cm) 0.39* 0.08 -0.38t CTI§ Organic carbon (5-15cm) 0.38* -0.12 0.26 (Unit area slope) Sand (5-15cm) 0.02 -0.46* -0.12 (Unit area•slope) Organic carbon (5-15cm) 0.39* -0.01 0.27
*, t, # Significant at 0.05, 0.01, and 0.075 level, respectively
§ CTI = (Upstream contributing area•slope•planform curvature)
Topographic analysis. Watershed topography was characterized using a Geodimeter Model 136 (1) survey in-strument. The program SPLIN2G (9) fit a Laplacian Smoothing spline surface to the irregularly spaced field data, and in-terpolated elevation values for X and Y coordinates of a uniform 3 x 3 m (10 x 10 ft) grid. The resulting digital elevation models (DEM) described the surface configuration of each watershed. Eleva-tion error associated with DEMs was es-timated to be ±0.025 m (.08 ft).
A FORTRAN program
(14)
analyzed each DEM and estimated five principal topographic indices for surface points corresponding to all nonperipheral grid nodes, including: 1) slope-the maxi-mum rate of change of elevation of the surface (m/m); 2) aspect-the compass bearing of the maximum downward slope (degrees clockwise from north); 3) profile curvature-second derivative of an arc defined by the intersection of the surface with a vertical plane that passes through slope vector and node (m/m2, positive-convex); 4) planform curva-ture-second derivative of the arc formed at the surface by a vertical plane perpendicular to slope vector andpass-ing through node (m/m2, positive-con-cave); and 5) upslope contributing area-the entire upstream area (m2) that contributes flow to the surface point corresponding to each node. Topo-graphic parameters described in the in-troduction are simply combinations or transformations of these basic attributes. Finally, we included a parameter that described the shortest horizontal dis-tance from the location of interest to a known ephemeral channel position.
Ephemeral erosion. Data on size and pattern of ephemeral gullies that formed at Mower during 1986-88 sea-sons were provided by the USDA-SCS; measurements were made with a tape. In 1989, measurements at all sites were made in the following manner: Ephemeral gullies were identified as channels in which development and ori-entation were associated with incipient drainageways. These gullies, which were oriented at angles to furrows, were readily distinguished from rills that formed in, and ran parallel to, tillage marks. Ephemeral gullies that formed were measured before the next tillage operation. Channels and deposition zones were delineated and partitioned
into reaches of similar size and configu-ration. Channel area of each reach was measured at two or three locations using a micro-relief meter for large channels and a photographic technique for small gullies. In the latter method, cross-sec-tional gully areas were measured from photos taken on-site. Channel voidage was computed by summing the prod-ucts of channel length and average channel area (for each reach) over all channel sections and reaches compris-ing the gully. Based on the accuracy of the relief meter and estimated unmea-sured channel sinuosity, we estimate a maximum of 15 percent error was asso-ciated with these soil voidage measure-ments.
Soil sampling. At each site, ephemer-als were divided into three blocks, in-cluding lower channel (depositional), mid-channel, and upper channel. Within each block four "affected" plots were lo-cated over the ephemeral channel, if present, or in the swale bottom. The term "affected" refers to field areas di-rectly impacted by erosive or deposi-tional processes of ephemeral gullies. "Nonaffected" plots were randomly lo-cated on one side of the channel, at least three meters along the furrow and away from the affected plot. "Nonaffect-ed" areas were considered to be beyond the influence of present ephemeral gul-lies, but were subject to interrill and rill processes. Each plot consisted of 3 m (10 ft) of crop row. Three of the four pairs of affected/nonaffected plots were randomly selected for sampling in the fall of 1989. A preliminary examination of soil profiles beneath affected areas re-vealed that significant variability in soil texture occurred at the 0.18-0.35 m (.6-1 ft) depth. In each selected plot, soil sam-ples were taken from two narrowly de-fined layers (0.05-0.15 m and 0.18-0.35 m) in order to better observe these tex-tural contrasts. Samples consisted of 2.3
cm (1 in) diameter cores, taken at the lowest point in each swale, but to one side of any channel. In addition, a five or six sample transect was made across the mid-channel zone of two different ephemeral gully systems in each land-scape. Particle size analysis, total organic carbon, and bulk density were deter-mined for the two layers sampled in each core.
Table 3. Soil properties* of plots that are either affected or nonaffected by ephemeral erosion processes. Data are given on the basis of site and channel position.
( 1 ) (2) (3)
Channel Position Lower Mid Upper •
Erosion Status Affected Non-aff Affected Non-aff Affected Non-aff Overall Site: Olmsted (1)
OC1 (%) 1.84a§ 2.11b 2.07a 2.00a 2.04a 2.04a 2.01A
BD1 (g 1.31 b 1.13a 1.12a 1.06a 1.17a 1.13a 1.12A
BD2 (g cm 3) 1.21a 1.15a 1.19a 1.15a 1.08a 1.09a 0.04A
S1 (%) 10.6a 9.0a 9.9a 9.7a 7.6a 10.0a 9.6A
S2 (%) 9.0a 8.4a 10.5b 7.4a$ 5.6a 2.8a 7.5A
CL1 (%) 28.9a 23.3a 26.1a 23.9a 28.3a 18.0a 24.5A
CL2 (%) 25.8a 27.1a 25.7a 24.4a ' 28.4a 28.9a 26.3A
ATHK (cm) 60.2a r,Je 74.0a 65.9a 52.7a ..:__e n*- 80. 3a t : 65.3a 60.9A
Site: Rice (2)
OC1 (%) 2.7a 2.9a 1.58a 1.55a 1.72a 1.70a 1.85A
BD1 (g cm.3) 1.12a 1.15a 1.13a 1.30b 1.32a 1.42a 1.25A
BD2 (g cm3) 1.18a 1.22a 1.32a 1.40a 1.32a 1.22a 1.32AB
S1 (%) 21.3a 23.7a 31.7a 31.3a 29.3a 29.2a 29.1B
S2 (%) 16.7a 31.2a 37.1b 29.2a 25.7a 33.1a 29.5B
CL1 (%) 27.0a 34.4a 34.2a 38.0a 34.1a 33.0a 34.9B
CL2 (%) 32.9a 44.3a 37.8a 45.4a 46.0a 41.3a 42.3B
ATHK (cm) 60.0a 60.0a 24.8a 20.5a 20.3a 24.8a 29.8B
:ft
Site: Mower (3)
OC1 (%) 3.96a 4.44b 2.29a$ 3.1514 3.17a 3.49a 3.26B
BD1 (g cm-8) 1.03a 0.97a 1.30a 1.18a 1.13a 1.12a 1.15A
BD2 (g cm .3) 1.11a 1.06a 1.36a 1.29a 1.38a 1.34a 1.27B
S1 (%) 23.9a 22.9a 25.8b 19.0a 26.3a 28.5a 23.0B
S2 (%) 17.7a 11.7a 10.6a 15.7a 5.3a 11.2b 1.3A
CL1 (%) 33.5a 37.0a 28.3a 30.9a 30.614 27.04 30.9AB
CL2 (%) 36.6a 33.3a 29.9a 32.4a 34.5a 36.1a 33.1B
ATHK (cm) 42.3b 32.7a 21.1a 36.3b 29.5a 36.5a 33.3B AT19
• ATHK = A horizon thickness; OC = total organic carbon; BD = bulk density; S = sand; CL = clay; 1 = 0.05-0.15m sampling depth; 2 = 0.18-0.35m sampling depth
-I- Dissimilar uppercase letters indicate significant differences (P = 0.05) between sites for a given soil property $ Affected and non-affected values are different at P = 0.075 significant level
§ Dissimilar lower case letters indicate significant differences (P = 0.05) between affected and non-affected values at each channel position
Regression models. A stepwise
re-gression analysis (16) was employed to determine how topographic characteris-tics (independent variables) at a given location influenced local occurrence or severity of ephemeral channel develop-ment (dependent variable). In this statis-tical analysis, a search algorithm selects the subset of independent variables (i.e., derives a suitably-fitted model) that best explains variation of the independent variable. The model fitted is:
CA P. + P1T1 +132T2 .-+ r3nTn + Ei
where CA is a channel formation vari-able and T1 are topographic characteris-tics selected in the analysis.
Results and discussion
Ephemeral erosion. A section of ephemeral gully was composed of a sin-gle channel or from two to four parallel channels. Cross-sectional area of a chan-nel ranged from 0.0016 to 0.032 m- (.02-.3 ft2). Ephemeral gully voidage esti-mates measured in 1989 at each of the watersheds are presented in Table 1. Soil loss to ephemeral erosion on these watersheds was much less than that re-ported by Spomer and Hjelmfelt (17) in
Iowa, for a 28 ha (69 ac) loess water-shed with 4-12 percent slopes [6.8 Mg/ha (3 ton/ac) in 1984, 17 Mg/ha (8 ton/ac)] in 1985; by Grissinger and Mur-phey (7) in northern Mississippi, for 1.9 ha (5 ac) loess watershed with 0-6 per-cent slopes [14.7 Mg/ha (7 ton/ac) in 1985] ; and by Thomas and Welch (18)
in Georgia, for 1.2 (3 ac) and 0.8 ha (2 ac) watersheds with clayey residual soils and 2-8 percent slopes [33.0 Mg/ha (15 ton/ac) average from July 1984 to De-cember 1986]. The disparities are pri-marily due to a difference in number and intensity of rain storms over water-sheds and length of erosion seasons. For example, mean annual rainfall is 1200 mm (47 in) at the Georgia location, 1400 mm (55 in) at the Mississippi loca-tion, and 735 mm (29 in) at our sites. Precipitation during the period of obser-vation was 823 mm (32 in) at Georgia and averaged 1071 mm (42 in) per year at Mississippi. This is compared to 330 and 437 mm (13 and 17 in) recorded for the two seasons of our study in
south-east Minnesota (1988 and 1989).
Annual soil voidage for Mower (Table 1) in 1986 and 1987 was nearly ten times greater than that observed in
1989. However, comparable events oc-curred on 7/26/86 and 7/11/89 with
re-spect to intensity and time of season, and resulted in similar soil losses [0.5 and 0.6 Mg/ha (.2 and .26 ton/ac), re-spectively]. This suggests that although drought reduced ephemeral erosion during 1988 and 1989, relative size and spatial information provided by channel measurements during 1989 were realis-tic and adequate for analyses of associ-ated topographic relationships.
Soil property-topographic para-meter relationships. Pearson's correla-tion analysis of topographic parameters and soil properties included soil data from sample sites in and adjacent to channels, in addition to five to six sam-ples comprising a cross-section of the mid-channel gully. Correlation analysis was conducted independently for each site (Table 2). In general, correlations with soil properties were not significant across all sites. Most of the significant correlations were site specific, even to the extent that, for a given soil property, correlations were reversed from one site to the next. About 54 percent of signifi-cant correlations were observed for the Olmsted location. Stronger soil
ty/topographic parameter relationships occur at Olmsted because the overall landscape configuration is more ex-treme, as exemplified by its greater mean slope.
Soil property-channel parameter relationships. The correlation analysis described above also included channel formation parameters. Channel cross-sectional area, a measure of gully ero-sion severity, was positively correlated to sand content at 0.18-0.35 m (.6-1 ft) depth at Olmsted and Rice sites, but negatively correlated at Mower site (Table 2). The conventional ephemeral erosion model predicts that the surface horizon of eroded soils becomes more similar to that of the subsoil as erosion proceeds. Accordingly, when Olmsted and Rice soils are eroded, sand content should remain constant with depth. In-stead, sand content at 0.18-0.35 m depth increases in areas where gully size was larger, suggesting that dilution or diminution of silts and clays occurred in the 0.18-0.35 m layer in affected loca-tions. Increasing sand may be a conse-quence of preferential removal of silts and clays by concentrated flow. Evi-dence supporting a dilution process was
observed in a soil profile excavated at a mid-channel affected location. Lenses of sand 0.18 to 0.30 m (.59 to .98 ft) thick and 4 to 6 m (13-20 ft) wide were ob-served in the upper 0.5 m (1.5 ft) of the soil profile. These sand bars probably formed during past ephemeral episodes and were covered by fill from tillage.
It is not clear whether a cause-effect relationship exists between strongly de-veloped ephemeral channels and in-creasing sand content with depth. Re-gardless of the cause, this evidence suggests that both degrading and ag-grading processes occur at mid-channel positions. This contradicts the conven-tional ephemeral erosion model (see last paragraphs in Results and Discus-sion section). The duplicity in process probably is caused by the dynamic na-ture of individual hydrologic events, or variation between successive events. Channel scouring can occur during event peak flows, but as runoff slows, velocity and transport capacity in stream flows decrease, and sediment is deposit-ed in the scourdeposit-ed channels. The heavier sand fraction dominates deposits of the higher-energy, mid-channel flows. Smaller rainfall events that follow heavy
rainstorms yield less runoff, and pro-duce channel flows that terminate be-fore fully traversing the previously in-cised gullies. Sediment from abbreviated flows is deposited in mid-channel reach-es. Such duplicity may produce greater variation among soil properties associat-ed with ephemeral channels and rassociat-educe our chances of observing consistent re-lationships; however, the above exam-ple was statistically significant, indicat-ing that some soil property patterns may be generally reflective of ephemeral erosion processes.
The only other soil property signifi-cantly correlated with channel area was A horizon thickness at Mower. As chan-nel area increased, thickness of the A horizon decreased, a situation that sup-ports the conventional ephemeral ero-sion model. Other ephemeral eroero-sion parameters "deposition type"—a mea-sure of extent of deposition occurring in channels and "distance to channel" had significant, though unique, relationships to specific soil properties. Increasing or-ganic carbon at 0.05-0.15 m (.2-.5 ft) depth with distance from channel was significant for both Olmsted and Mower sites and suggests that classical erosion
Study Sites
Olmsted
Mower
Rice
0
Loess
Loess
Glacial
Till
0.5 -
Firm
Glacial
Till
1.0 -
m
4-10%
2-6%
3-18%
slopes
slopes
slopes
A horizon
B horizon
Granular
1====1
Fine ABK
BEN
Medium ABK
11111
MOWER
•
- •
♦ = Erosion Event
•
I
.
ILA..
1.1rn rn
co CO CO
7
LEI co
1
rn
CO
C7)
CO
rn
03
7
•
OLMSTED
I
1 L
is occurring in the affected area, i.e., re-moval of the organic rich epipedon.
Ephemeral channel-topographic parameter relationships. Two associ-ations were consistently significant for all landscapes. The first, channel cross-sectional area, a measure of ephemeral erosion severity, was positively correlat-ed to planform curvature (i.e., as plan-form curvature became more concave, channel area increased). The second, occurrence of deposition, was negative-ly correlated with slope. In addition, dis-tance to channel was negatively corre-lated with planform curvature for both Olmsted (P<0.07) and Rice (P<0.01) sites.
To examine the relationship between erosion severity and topographic para-meters, a stepwise regression analysis was conducted with channel area as the dependent variable and topographic at-tributes as independent variables. Be-tween 18 and 22 extra points were ran-domly selected from portions of the watershed not previously sampled, and included in this analysis. Since these points were outside the affected areas, a channel area value of zero was assigned to each point. Model parameters select-ed for each site were different. Planform curvature was included as one of two parameters in all models. The second parameter for Olmsted was ABS (unit area•slope); the second for Rice was LNAS, Ln(unit area/slope); and the other parameter for Mower was CTI (up-stream contributing area • slope • plan-form curvature). Regression (R2) values and significance of model fit were 0.27 (P=0.0001) for Mower, 0.39 (P=0.0001) for Olmsted, and 0.42 (P=0.0013) for Rice. Several factors may have con-tributed to this low explanation of vari-ance, i.e., other influential topographic parameters may need to be considered; additional factors such as soil strength, soil hydraulic conductivity, and runoff need to be incorporated into the model; a larger number of watershed samples may be needed to identify subtle rela-tionships with topographic attributes; and DEM grid resolution [3 m (10 ft)] may not have been sufficient to accu-rately compute parameter values in all cases.
Burt and Butcher (3) found that plan-form curvature was a good predictor of saturated areas in watersheds. Ephemer-al gullies would be most likely to form in such areas because critical shear stress of saturated soils is reduced, and convergence increases the probability that concentrated flow will develop on
60
E
E
50 -J --I 40Z
•
30 7ztCC 20
>-▪ 10
0
60
50
40
30
20
10
0
60 E
50
—I 40 IL
Z 30
CC 20 >-—1
•
100
the surface (19). The importance of ABS in the Olmsted regression most likely is a reflection of this factor's influence on sediment transport capacity of surface flow processes (11). Moore (10), O'Loughlin (13), and Beven and Kirkby
(2)
found LNAS to be the best predictor of soil water content and surface satura-tion. The combination of LNAS with planform curvature in the Rice regres-sion leads us to believe that saturation may play a relatively greater role in de-velopment of ephemeral gullies at this site. The majority of erosion at all sites occurred in early spring, while soil frost was present at some depth in thepro-file. Permeability of frozen soil is very low. Water perched above the frozen layer soon saturates the soil and induces significant subsurface flow. Thorne et al. (19) combined planform curvature in a product (CTI) that also included up-stream contributing area and slope; the latter two providing an index of stream power. The presence of both planform curvature and CTI in the Mower regres-sion indicates that interaction effects be-tween upstream area, planform curva-ture, and slope, do not alone explain severity of ephemeral gully develop-ment.
The relationship between occurrence
— Spring • • • Fall
Watershed
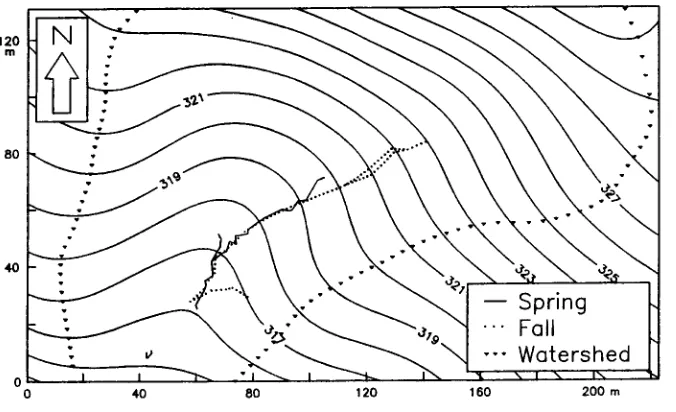
Figure 3. Olmsted ephemeral gully pattern, spring and fall, 1989 (units in me-ters.
of ephemeral gullies and topographic parameters was examined by utilizing the "distance from point to channel cen-ter" parameter as the dependent vari-able in regression models for each site. Additional watershed points selected for the channel area regression were also included in this analysis. Distance to channel for these points was estimated from DEM contour maps. The coeffi-cient of multiple determination (R2) and significance of model fit for the three models ranged from 0.28 (P=0.0001) for Rice, 0.51 (P=0.0001) for Olmsted, and 0.80 (P=0.0001) for Mower. Again, the models employed different parameters. Planform curvature, however, was com-mon to all models and accounted for a dominant portion of explained variation at each site. Variation in channel occur-rence at Olmsted was best explained using planform curvature, slope, and a combined index—profile curvature • slope (PSLP). Proximity to a channel in-creases as planform curvature becomes more concave and when slope decreas-es. PSLP has not been employed in pre-vious research. Its use in this regression implies that when profile curvature comes more concave and slope be-comes less steep, the proximity to a channel is increased. Zasla ysky and Sinai (21) reported that profile curvature was of primary importance in determin-ing the distribution of soil water con-tent. We believe PSLP identifies areas where concavity encourages accumula-tion of soil water and low slope hinders subsurface lateral drainage. Channels tend to form in these areas where infil-tration is reduced and surface flow down slope is sustained. Gully
occur-rence at Rice was most closely related to planform curvature and the combined indices LNAS and CTI. For Mower, much of the variation in proximity to channels was explained by planform curvature, slope, and combined in-dices—LNAS, ABS, and PSLP.
Soil properties of affected/nonaf-fected areas. Table 3 presents mean soil properties of affected and nonaffect-ed areas for each site. Of 72 affectnonaffect-ed versus nonaffected comparisons exam-ined, only nine pairs were significantly different (P<0.05). These are included in Table 3. Differences were observed in each reach but only one of the nine oc-curred in the upper channel position. Clearly, ephemeral gully erosion has its greatest impact on local soil properties at mid- and lower-channel positions. Soil properties most influenced were A horizon thickness and percent organic carbon, bulk density, and percent sand at 0.05-0.15 m (.2-.5 ft) depth. In gener-al, percent organic carbon at 0.05-0.15 m depth in affected areas was 12 per-cent less than in nonaffected areas in lower channel positions. At mid-channel positions, the most systematic difference observed was in sand content of either 0.05-0.15 or 0.18-0.35 m (.6-1 ft) layers; affected areas had approximately 30 percent greater sand than nonaffected areas in one of these layers.
A lack of overall relationships sug-gests that each site (landscape) respond-ed differently to ephemeral erosion processes. For example, in some land-scapes, ephemeral gullies do not recur in precisely the same position in the swale each year. Instead, they may be initiated at various positions in the
swale, depending on microtopographic variation in furrow configuration, swale planform curvature, or random weak-ness in tillage ridges that cross the swale and dam water. Channel wandering was observed at the Olmsted site; Figure 3 depicts early and late season ephemeral gully patterns that significantly diverge from one another. At the sampling scale used, the random formation of channels and subsequent filling would tend to minimize soil differences observed be-tween affected/nonaffected locations. We believe this may explain why few differences were noted between affect-ed and nonaffectaffect-ed areas at Olmstaffect-ed (Table 3).
Conclusions
Soil voidage associated with ephemeral erosion during dryer than normal seasons was one tenth that ob-served in wetter years. However, com-parable storm events resulted in similar soil losses irrespective of season. The greatest impact of ephemeral erosion was observed at middle and lower reaches of the gully channel. A simple model describing 1) at upper gully posi-tions, the removal of A horizon soil and tillage induced mixing with the B hori-zon, and 2) deposition of this sediment at lower gully positions, did not fully explain observed soil property relation-ships. The influence of ephemeral ero-sion on soil property patterns varied be-tween sites as a function of relative 1) contributions from rill and interrill processes, 2) proclivity for channel drift-ing, and 3) occurrence of depositional sorting in channels. The lack of a con-sistent pattern of topography/erosion correlations between sites suggests that hydrologic processes occurring in ent watersheds are significantly differ-ent. Our results suggest that one, two, or even three topographic parameters may not adequately describe ephemeral erosion hazards in various landscapes. Also, topographic parameters alone are not adequate to predict effects of ephemeral erosion on soil property pat-terns at a given site.
REFERENCES CITED
1. Aveyard, J., GJ. Hamilton, IJ. Packer, and P.J. Barker. 1983. Soil conservation in crop-ping systems in southern New South Wales. J. Soil Cons. New South Wales 39: 113-120. 2. Beven, K. and MJ. Kirkby. 1979. A
physi-cally based variable contributing area model of basin hydrology. Hydrol. Sci. Bull. 24: 43-69.
3. Burt, T.P. and D.P. Butcher. 1985. Topo-graphic controls of soil moisture distribu-tion. J. Soil Science 36: 469-486.
Bunting. 1981. The influence of topography on the development of alfisols on calcareous clayey till in Denmark. Catena 8: 111-136. 5. Foster, G.R. 1982. Channel erosion within
farm fields. Preprint 82-007. American Soci-ety of Civil Engineers, New York.
6. Foster, G.R. 1986. Understanding ephemer-al gully erosion. pp.90-128. In C. Carlson (ed.) Soil conservation: Assessing the na-tional resources inventory, Vol. 2. National Academy Press, Washington D.C.
7. Grissinger, E.H. and J.B. Murphey. 1989.
Ephemeral gully erosion in the loess up-lands, Gordwin Creek Watershed. Northern Mississippi, USA. In International Research and Training Center on Erosion and Sedi-mentation (ed.) Proceedings of the Fourth International Symposium on River Sedi-mentation, Beijing, China. June 5-9, 1989. China Ocean Press, Beijing.
8. Hanna, A.W., P.W. Harlan, and D.T. Lewis. 1983. Effect of slope on water balance under center-pivot irrigation. Soil Sci. Soc.
Am. J. 47: 760-764.
9. Hutchinson, M.F. 1984. A summary of some surface fitting and contouring programs for noisy data. Consulting Rep. No. AGi84/6, CSIRO Div. Water and Land Res.
10. Moore, I.D., E.M. O'Loughlin, and G.J. Burch. 1988b. A contour-based topographic model for hydrological and ecological ap-plications. Earth Surface Proc. and Land-forms 13: 305-320.
11. Moore, I.D., G.I. Burch, and D.H. MacKen-zie. 1988a. Topographic effects on the distri-bution of surface soil water and the loca-tion of ephemeral gullies. Trans. ASAE 31: 1098-1107.
12. Mueller, R.G. 1982. Soil genesis as influ-enced by three-dimensional landsurface form in two low-order drainage basins in the Flint Hills of Kansas. Ph.D. digs. Univer-sity of Kansas, Lawrence. (Diss. Abstr. DA8301737).
13. O'Loughlin, E.M. 1981. Saturation regions in catchments and their relations to soil and topographic properties. J. Hydrol. 53: 229-246.
14. Panuska, J.C. and I.D. Moore. 1991. Water quality modeling: Terrain analysis and the agricultural non point source pollution (AGNPS) model. Tech. Rpt. No. 02/89. Water Resources Center, Univ. Minnesota, St. Paul, March 1991.
15. Pierson, F.B., and DJ. Mulla. 1990. Aggre-gate stability in the Palouse region of Wash-ington: Effect of landscape position. Soil Sci. Soc. Am. J. 54: 1407-1412.
16. SAS Institute Inc. 1988. SAS/STAT User's Guide, Release 6.03 edition. SAS Institute Inc., Cary, NC.
17. Spomer, R.G. and A.T. Hjelmfelt Jr. 1986.
Concentrated flow erosion on conventional and conservation tilled watersheds. Trans. ASAF, 29: 124-128.
18. Thomas, A.W. and It. Welch. 1988. Mea-surement of ephemeral gully erasion. Trans. ASAE 31: 1723-1728.
19. Thorne, C.R., L.W. Zevenbergen, E.H. Grissinger, and J.B. Murphey. 1986.
Ephemeral gullies as sources of sediment.
pp.152-161. In Proceedings of the Fourth Federal Interagency Sedimentation Confer-ence, Mar 24-27, 1986, Las Vegas, NV. 20. U.S. Department of Commerce National
Oceanic and Atmospheric Administration, Environmental Data Service. 1986-9. Cli-matological data annual summary, Min-nesota, Vol. 95, No. 13. National Climatic Data Center, Ashville, NC.
21. Zaslaysky, D. and G. Sinai. 1981. Surface hydrology. J. Hydraulics Div., ASCE 07:
1-64.
q
Purchased by the U.S. Department of Agriculture, Agricultural Research Service,
for official use