http://dx.doi.org/10.22161/ijeab/2.6.29 ISSN: 2456-1878
Determination of Yield and Yield Components of
Vetch and Cereal Mixture and Evaluation Using
by GGE-Biplot Analysis
H. S. Tenikecier
*, A. Orak, İ. Nizam, A. K. Demirkan
*Department of Field Crops, Tekirdag Namık Kemal University, Turkey
Abstract—This study was carried out to determine forage
and seed yield and its effecting component in different vetch and cereal mixtures, ecological condition of
Tekirdağ-Thrace region of Turkey. The study was
conducted using a total 5 vetch and cereals varieties includes three different vetch species orakefe, Hungarian
vetch species sarıefe, narbon vetch candidate variety 570,
two different cereals (barley variety scarpia, oat variety sebat) and their mixture combinations, each species were sown as sole, double and triple mixtures (8 combinations for each genotype) a randomized complete block design with 3 replications was laid out on 2013-2015 growing season. Eight mixture combinations for each genotype (common vetch, Hungarian vetch, Narbon vetch, barley and oat) were evaluated for yield and major plant structural characteristics. Genotype-Trait (GT) biplot analyses were used. Applying type of analyses to the multiple trait data revealed that GT biplot graphically displayed the interrelationships among traits and facilitated visual comparison of mixtures and selection for each genotype. Wide variation was observed for traits plant structure and components (plant height, branch number and pod number/plant, 1000 seed weight, individual genotype ratio). It was found that; seed yield, 1000 seed weight, plant height, branch and pod number /plant were the highest value in pure stand NV570. In addition (570+sebat) had maximum dry forage yield,
sarıefe as pure stand has the maximum plant height and
seed yield value. On the other had sarıefe+scarpia combination showed very high value for pod number/plant, branch number/plant and fresh and dry forage yield. Pure stand scarpia was the best performer in seed yield. CV+NV+scarpia had the highest 1000 seed weight, fresh and dry forage yield. Maximum planth height was determined from sebat+scarpia, CV+O+B and CV+HV+B combinations. Favorable seed yield and 1000 seed weight value was produced under pure stand sebat seeding. Intercrop NV570+O combination had the higher fresh and dry forage yield. CV+HV+O, CV+NV+O and CV+B+O combination had the highest plant height of sebat.
Keywords— GGE-Biplot, Forage Crops, Vetch, Cereal,
Yield
I. INTRODUCTION
http://dx.doi.org/10.22161/ijeab/2.6.29 ISSN: 2456-1878
and because of losing leaves 324, its forage and quality decrease. Vetch should be sown mixture with cereals in order to overcome spreading. As a result, forage yield and quality start to decrease due to the decomposition of herbage. Due to this, it is sown with winter-sown small grains, such as oats (Avena sativa L.), wheat (Triticum aestivum L.), barley (Hordeum vulgare L.) and triticale (x
Triticosecale Wittmack). In mixtures, companion cereals provide structural support for common vetch growth, improve light interception and facilitate mechanical harvest, whereas common vetch in mixtures improves the quality of forage [28], [11], [18]. So far, there has been no report on what cereal is the best companion crop for vetch [10], [30]. [28] reported that the most suitable cereal for mixtures with common vetch is wheat. Because high cereal rate in botanic composition of legume + cereal mixture cause low protein content which is one of the most important factors to determine the forage quality [7], [4]. Use of cereals and grasses in mixtures with legumes not only increases forage yield, but also providesphysical support to, which facilitates mechanical harvestingand other benefits of these mixtures includegreater use of light, greater uptake of water and nutrients,enhanced weed suppression, and increased soil conservation, [24], [6]. Disadvantages of mixtures may include extra work in preparing and planting seed and lack of mixed crop tolerance to herbicides. Higher yields have been documented for intercropping oats and vetches [13]. Generally green herbage and dry matter yield and percentage of mixture decreased by increasing seed rate of legume in the mixture [19], [28], [7]. Mixtures containing 25-50 % legumeproduced more quality forage and yield per unit area than those of pure sowings [27], [5], [9]. [31] and [8] found the highest forage yield at the ratio 75:25 (oats: vetch) differences in soil fertility might be a factor in this response. As any of the species increased in the mixture yield gradually decreased, minimum yield was found when each species were sown alone and the yield was 55% lower than the maximum. Dry weight was affected by the common vetch ratio as was reported before [8], [31], [11]. The highest protein and digestibility contents were found in common vetch sown alone, as the proportion of oats increased there was a gradual reduction in both protein and digestibility, the lowest contents for both were with oats sown alone, with no difference (P>0.05) between oats cultivars. [11] also pointed out that protein content of rainfed oat-common vetch mixture depends on vetch proportion. Recently, many new researches have been conducted where vetch species were grown with different cereals in an intercropping system, whereas generally associated with oat; wheat and barley have been carried in recent years. However few related with more than double mixture have been carried in recent
years. [32] developed a site regression methodology which contains genotype main effect plus genotype by environment (GGE) using biplot procedure as a graphical tool for analysis of multi environment trials dataset. A biplot is a plot that simultaneously displays the effects of genotypes and the environment [14]. The biplot according to GGE model is a biplot that displays the GGE of multi-environment trials dataset. It is constructed by plotting the fi rst two principal components (PC1 and PC2) derived from singular value decomposition of the environment-centered data [36]. However, it can also be equally used for all types of two-way data that assume a two way structure. The genotypes can be generalized as rows and the multiple traits as columns. [34] used a genotype by trait (GT) biplot, which is an application of the GGE biplot technique to study the genotype by trait data. The objectives of this study were to evaluate the forage production capacities of vetch and cereals mixtures, to assess the effects of different mixture levels on the yield, yield components of the mixtures. And also determining the most convenient mixture combinations and interactions in this intercropping systemvetch and cereal mixtures using by GT biplot technique, under the seacost condition of Northern Turkey.
II. MATERIALSANDMETHODS 2.1 Field Experiments
Plant materials, common vetch (Vicia sativa L.”Orakefe”)
Hungarian vetch (Vicia pannonica Crantz. “Sarıefe”)
Narbonne vetch (Vicia narbonensis candidate variety “570”), Oats (Avena sativa variety “Sebat” and Barley
(Hordeum vulgare variety “Scarpia”) were used as plant
http://dx.doi.org/10.22161/ijeab/2.6.29 ISSN: 2456-1878
designated. Plot combination of each species was planned different ratio. Plant materials were sown Orakefe” (CV), Candidate variety Narbon vetch “570” Cultivar “Sarıefe”(HV), Cultivar “Sebat” (O), Cultivar “Scarpia” (B) as sole crop, double combinations (CV-NV, CV-HV, CV-O and CV-B) and triple combinations (HV-NV-CV; HV-B-CV and HV-O-CV) . Yield and yield characters were determined for each cultivar in all combination individually. The experimental design was randomized complete block design with three replications combined over years. All the data were subjected to analysis of variance (ANOVA) procedures using the MSTATC statistical software package. The weed Control by hand was carried out twice when density was high, in the preflowering and postflowering stages. The meteorological data of the experimental area during growing season from October to July was given at table 1. It has a longterm rainfall of 477,9 mm during growing season, while the average temperature of the first (13.8 °C) and second growing season (13,3 °C) was higher than the long term average value (12.5°C). The total precipitation was 524.2 mm and 598,1mm during the 2013-2014 and 2014-2015 growing seasons respectively.
2.2Statistical analysis
The Anderson and Darling normality test was used to normality test of dataset using MINITAB version 14 (2005) software. Cluster analysis is a tool for classifying objects into groups. The GT biplot analysis was performed on the eight cluster groups and eight for legume base and six for cereal base quantitative traits. The genotype by trait (GT) biplot method [34] was used to show the vetch+cereal mixture by trait two-way data in a biplot. These statistical methods have been described in detail by [32] and [34]. All biplots presented in this study were generated using the software GGEbiplot package [33].
2.2.1Principal component analysis (PCA)
Principal component analysis (PCA) of the quantitative data was performed to investigate the importance of different characters in explaining vetch and cereals mixtures and the most commonly is useful tools for screening mixtures, and thus guide in the choice of combination for high and quality production. Biplot was used to assess the GGE biplot method [32] to assess the patterns of relations among morphological attributes, mixtures and their combinations and conducted in the dimension of first two principal components (PC1 and PC2), using a singular-value decomposition procedure.
2.2.2 Cluster analysis
In order to determine the similarities or differences among mixtures, a cluster analysis was performed as well. The
statistics of the cluster analysis based on the seven morpho-agronomic traits for eight different mixture combinations for legumes. In addition, six morpho-agronomic traits for eight different mixture combinations were examined for cereals.
III. RESULTS AND DISCUSSION
The mixture combinations and evaluated of characters for each genotype were given individual as well.The following can be seen from fig. 1. The combinations of each genotype characters Orakefe (CV), 570(NV) +CV, Sarıefe (HV), Sebat (O)+CV, Scarpia(B)+CV, HV+NV+CV, HV+B+CV, HV+O+CV were given an individual. The first one was given as common vetch variety and its combination can be seen from fig. 1. The GT biplot for Common vetch variety “Orakefe and its mixtures with cereals dataset, based on proposed method of [32] explained 66% of the total variation of the standardized data. This relatively moderate percentage reflects the complexity of the relationships among the measured traits. The first two principal components (PC1 and PC2) explained 44% and 22%, respectively. In the GT biplot, a vector is drawn from the biplot origin to each marker of the mixture to facilitate visualization of the relationships between and among the characters as well as mixture combinations
http://dx.doi.org/10.22161/ijeab/2.6.29 ISSN: 2456-1878
Figure 1. Polygon view, presents data of Common vetch
variety “Orakefe” with 8 different mixture combinations in
seven different traits.
Table 1. Correlation coefficient among seven Common vetch varieties Orakefe and its mixtures traits
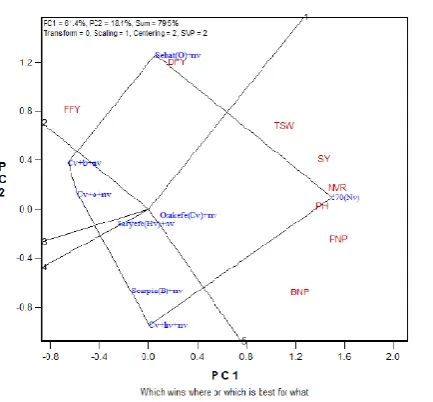
Figure 2. Clusters dendogram of Common vetch variety Orakefe with 8 different mixture combinations in seven
different traits
The number of clusters was verified by multivariate analysis of variance test. This relatively moderate percentage reflects the complexity of the relationships among the measuret parameters. Thus reducing entry numbers of mixtures from 8 combinations to 6 clusters.
Additional, 6 clusters are necessary to explain 66.67% similarity of the mixture combinations.
Figure 3. Vector view mixtures by trait biplot, showing the interrelationship among measured traits for Common
vetch variety Orakefe with 8 mixtures combinations
In the Fig. 3, the correlation coefficient between any two traits is approximated by the cosine of the angle between the vectors. The correlation coefficients among the traits indicate that the biplot currently shows relationship among the traits that had relatively large loading on both PC1 and PC2. Therefore, the most prominent relations by this fi gure (8 mixtures and seven traits) are: a strong positive association among SY and PNP, among SY and CVR, among DFY and FFY had positive correlation as well. There was a near zero correlation between BNP and TSW with SY, PNP and CVR (Fig. 3) as indicated by the near perpendicular vectors (r= cos 90 = 0). Some of mentioned results can be verified using correlation coefficients of Table. 1.
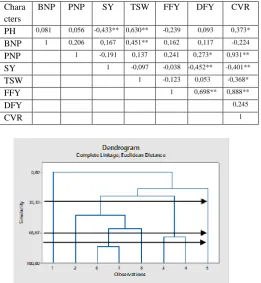
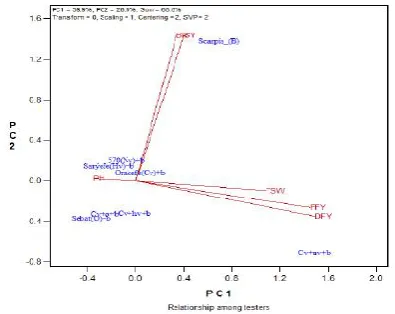
The GT biplot for Narbon vetch candidate variety (NV570) and its mixtures with cereals based on method of [34] explained 66% total variation of standardized data. The principle component vectors (PC1 and PC2) explained 61.4 % and 18.1 %, sum of the vectors was 79.5%. In the GT biplot, this view helps identify mixtures with highest values for one or more traits. The scores of six traits seed yield (SY), plant height (PH), narbon vetch ratio (NVR), tausand seed weight (TSW), pod number /plant (PNP) and branch number /plant (BNP) fel in the NV570 sector. NV570 had heighest and nearest heighest values for this traits. Orakefe+NV570 combination was second to NV570 for these traits. Similarly combination of sebat+NV570 mixture was the highest in fresh and dry forage yield, other mixture combination. CV+B+NV570 had the heighest fresh forage yield. Since the biplot did not explain all variation of these predictions may not exactly reflect the observed values.
Chara cters
BNP PNP SY TSW FFY DFY CVR
PH 0,081 0,056 -0,433** 0,630** -0,239 0,093 0,373* BNP 1 0,206 0,167 0,451** 0,162 0,117 -0,224 PNP 1 -0,191 0,137 0,241 0,273* 0,931** SY 1 -0,097 -0,038 -0,452** -0,401** TSW 1 -0,123 0,053 -0,368* FFY 1 0,698** 0,888**
DFY 0,245
http://dx.doi.org/10.22161/ijeab/2.6.29 ISSN: 2456-1878
Figure 4. Polygon view, presents data of “Narbon vetch
candidate variety” with 8 different mixture combinations
in seven different traits
Fig. 5 displays the tree diagram. The figure provides a graphical view of the clusters. Cluster analysis was approved as a suitable method for data classifying and suggested by [22]. Based on the cluster analysis in Fig. 5, we can divide the 8 mixture combinations can divide into 6 clusters based on the studied agronomic characters. In other words, 6 clusters are necessary to explain 66.67% similarity of the mixture combinations.
Fig. 5. The cluster dendogram of Narbon vetch candidate variety with seven different traits of eight mixture
combinations.
Figure 6. Vector view mixtures by trait biplot, showing the interrelationship among measured traits for Narbon vetch
candidate variety with 8 mixtures combinations.
The correlation coefficients among the seven traits are presented in Table 2. The vector view of a GGE biplot provides a succinct summary of the interrelationships among the traits [34]. Figure 6 is the vector view of the GGE biplot, in which the mixture combination is connected with the biplot origin via traits. This view of the biplot aids understanding of the interrelationships among mixture combination. The cosine of the angle between the vectors of two traits approximates the correlation coefficient between them. Therefore, the most prominent relations were: (a) near-zero correlations between TSW and DFY, between PNP and TSW, and between BNP and DFY as indicated by the near-perpendicular vectors (r = cos90 = O); and (b) positive associations among PH, NVR, PNP and SY, and between PNP and BNP as indicated by acute angles.
Table 2. Correlation coefficient among seven traits of Narbon vetch candidate variety 570 and its mixtures combinations
Character s
PH BNP PNP SY TSW FFY DF Y
NVR
PH 1 0,511** 0,651** 0,724** 0,168 -0,357** -0,049 0,868** BNP 1 0,561** 0,441** 0,018 -0,438** -0,110 0,647** PNP 1 0,804** 0,269 -0,385** 0,041 0,960** SY 1 0,334* -0,314* 0,088 -0,409** TSW 1 0,074 -0,006 0,226 FFY 1 0,612** 0,948**
DFY 1 0,732**
NVR 1,000
http://dx.doi.org/10.22161/ijeab/2.6.29 ISSN: 2456-1878
66% total variation of standardized data. The principle component vectors (PC1 and PC2) explained 41.8 % and 25.7 %, sum of the vectors was 67.5%. The biplot representing a polygon view (Fig. 7), having some vertex mixturess while the rest are inside the polygon. These vertex mixtures are supposed to be the most responsive since they have the longest distance from the biplot origin. Responsive mixtures are either best or poorest at one or all mixtures [34]. Thus it seems that Scarpia (B) +HV and CV+ Scarpia (B) +HV mixture combinations had the highest values for DFY, BNP, PNP, FFY and TSW. The other vertex mixture combination which fall in its sector were good for plant height (PH), Hungarian vetch ratio (HVR) and seed yield (SY). The other vertex mixtures (CV+HV and CV+NV+HV) and related sectors were not good performance for the measured traits.
Figure 7. Polygon view, presents data of Hungarian vetch
variety Sarıefe with 8 different mixture combinations in
seven different traits.
Figure 8. The cluster dendogram of Hungarian vetch
variety Sarıefe with seven different traits of eight mixture
combinations
Based on the cluster analysis in Fig. 8, we can divide the 8 mixture combinations can divide into 4 clusters based on the studied agronomic characters in similarity level 33.33 % of mixture combination. In other words, 4 clusters [1, 2, (3,6), (4, 7, 8), 5] are necessary to explain 33.33% similarity of the mixture combinations.
Figure 9. Vector view mixtures by trait biplot, showing the interrelationship among measured traits for Hungarian
vetch variety Sarıefe with 8 mixtures combinations.
The mixtures-traits vectors and groups illustrate the specific interactions of each mixture with each trait (Fig 9). The biplot showed DFY that was highly correlated in terms of PNP (Fig.9). Positive correlations were found between FFY (Fresh forage yield), DFY (Dry forage yield), PNP (Pod number/plant) and BNP (Branch number/plant), as indicated by the acute angles (vector angles < 90°) of their respective vectors. There was a near zero correlation between BNP, PNP and FFY with PH (fig 7) as indicated by near perpendicular vectors (r=cos 90=0). The biplot of the relationship between traits negative correlation was observed between BNP and PNP with PH as indicated by the large obtus angles between their vectors. Having same result observed from Table 3.
Table 3. Correlation coefficient among seven traits of
Hungarian vetch variety Sarıefe and its mixtures
combinations
Charact ers
P H
BN P
PNP SY TS W
FF Y
DFY HVR
PH 1 -0,459** -0,497** 0,339* 0,020 -0,035 0,144 0,848** BNP 1 0,637** 0,167 0,029 0,348** 0,273 -0,350** PNP 1 0,222 0,108 0,414** 0,419** -0,278 SY 1 0,233 -0,030 0,128 -0,352** TSW 1 0,085 0,081 0,084 FFY 1 0,939** 0,747**
DFY 1 -0,018
http://dx.doi.org/10.22161/ijeab/2.6.29 ISSN: 2456-1878
The GT biplot can be used to compare mixture combination on the basis of multiple traits and to identify mixture that are particularly good in certain aspects and therefore can be candidates for high production in mixture sowing. The GT biplot for oat variety “Scarpia” and its mixtures with cereals based on method of [34] explained 66% total variation of standardized data. The principle component vectors (PC1 and PC2) explained 39.9 % and 28.2 %, sum of the vectors was 68.8%. The perpendicular lines to the polygon sides facilitate comparison between neighboring mixtures. Specifically, comparison between CV+NV+ (Scarpia) B and (Scarpia) B neigboring vertex mixtures. According to [34] we have used the GT biplot to compare mixture combinations on the basis of multiple traits and to identify mixtures or groups of mixtures that are particularly good in certain aspects and therefore can be determined the best combination in vetch species+ cereal mixtures. The equality lines, which originate from the centre of biplot and are perpendicular to the sides of polygon, divide the graph into four sectors. The partitioning of GT interaction through GT biplot analysis shows that the first and second principal components (PC1 and PC2) together can explain 68% of the total variation. The yields of these mixtures were either the highest or lowest in one or more test environments. From the polygon view of biplot analysis, the genotypes fell into four sections and the test environments can be grouped in three sections (Section 1, 2 and 3). CV+NV+ B (Scarpia) combination were the highest tousand seed weight (TSW), fresh forage yield (FFY) and Dry forage yield (DFY). In addition Barley variety (Scarpia) was the highest seed yield (SY) and barley ratio value (Fig. 10). On the otherhand these vertex pure stant Scarpia and its mixtures, NV570+B, HV+B and CV+B were the highest value of Barley ratio and seed yield. (Fig 10). Heighest plant height of Scarpia (B) was recorded on O+B;CV+O+B and CV+HV+B mixture combinations.
Cluster analysis was given in fig 11. According to the result of Scarpia combination can diveded in to 3 clusters based on studied. Five mixture combinations were extracted from the 8 studied combinations. In fact, with this method, 8 mixture combinations were reduced to three in 33.33 % similarity level of the mixture combination (Fig. 11). Another explanation, Three clusters [(1, 2, 3, 7, 8), (4, 5), 6] are necessary to explain %33 similarity level of the mixture combinations.
Figure 10. Polygon view, presents data of “Oat variety
Scarpia” with 8 different mixture combinations in seven
different traits
Figure 11. The dendogram of Oat variety Scarpia with seven different traits of eight mixture combinations using hierarchial cluster analysis (Ward’s method and squared
Euclidean distance
Figure 12, Vector view mixtures by trait biplot, showing
http://dx.doi.org/10.22161/ijeab/2.6.29 ISSN: 2456-1878
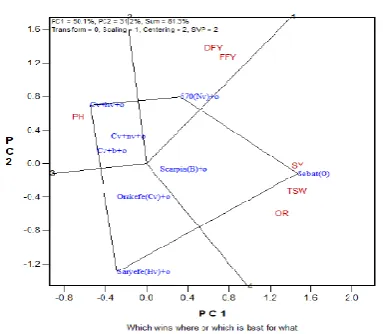
The correlation between these traits supports this theory that plant height and Scarpia ratio can improve Scarpia seed yield. The correlation coefficient between Scarpia seed yield and TSW is positive. TSW is one of the improtant components for increasing yield production, so, this is normal and expected. There is a positive and significant correlation between TSW and FFY; DFY. It is seen a close and positive association between FFY and DFY traits in many studies. The GT biplot for Barley variety “Sebat” and its mixtures with cereals based on method of [34] explained 66% total variation of standardized data. The principle component vectors (PC1 and PC2) explained 39.9 % and 28.2 %, sum of the vectors was 68.8%. The biplot representing a polygon view (Fig. 1). Having some vertex hybrids while the rest are inside the polygon. These vertex hybrids are supposed to be the most responsive since they have the longest distance from the biplot origin. Responsive hybrids are either best or the poorest at one or all locations [34]. Thus, hybrid Sebat was the highest seed yield and thousand seed weight and sebat ratio (OR). Similarly, in the next sector where the vertex 570(NV)+O excelled for Fresh and Dry forage yield. In addition sector where the vertex combination CV+(HV)+O followed by CV+(NV)+O and CV+B+O exceled for plant height. None of the traits fell in the sectors with Sarıefe (HV)+O and Orakefe (CV)+O as the vertices genotypes, indicating that these mixture combinatios were not best in any of the trait, Sebat (O) and 570(NV)+O combinations seemed to be heighest- yielding for seed yield, thousand seed weight, Fresh and Dry forage yield in two mentioned combinations.
Table 4. Correlation coefficient among seven traits of Scarpia and its mixtures combinations
Characters PH SY TSW FFY DFY BR PH 1 0,319* 0,267 0,102 0,017 -0,247 SY 1 0,326* -0,099 0,011 0,139 TSW 1 0,288* 0,321* 0,029 FFY 1 0,886** 0,760** DFY 1 -0,158
BR 1
Figure 13. Polygon view, presents data of “Barley variety
Sebat” with 8 different mixture combinations in seven
different traits.
Fig. 14. The cluster dendogram of Barley variety Sebat with seven different traits of eight mixture combinations.
Analysis of the results showed that the cultivar was clustered in to four main clusters in 33.33 % similarity level (Fig. 14). In the second cluster were included 1 (NV )+O and 7 (CV+HV+O) and third clusters were included 3 (CV+O), 8 (CV+B+O); 5 (B+O); 6 (CV+NV+O) which were similar each other. Four mixture combinations were extracted from the 8 studied combinations. In fact, with this method, 8 mixture combinations were reduced to four in 33.33 % similarity level (Fig. 14).
http://dx.doi.org/10.22161/ijeab/2.6.29 ISSN: 2456-1878
Fig. 15, Vector view mixtures by trait biplot, showing the
interrelationship among measured traits for “Barley variety Sebat” with 8 mixtures combinations.
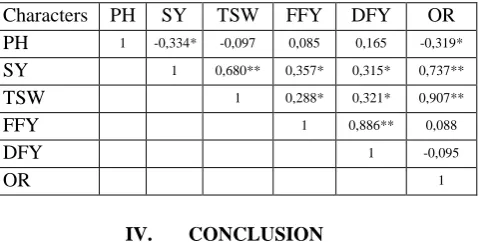
Table 5. Correlation coefficient among seven traits of Barley variety Sebat and its mixtures combinations
Characters PH SY TSW FFY DFY OR PH 1 -0,334* -0,097 0,085 0,165 -0,319* SY 1 0,680** 0,357* 0,315* 0,737** TSW 1 0,288* 0,321* 0,907** FFY 1 0,886** 0,088 DFY 1 -0,095
OR 1
IV. CONCLUSION
The GT biplot analysis of 8 different combinations showed variable ranges of purestand and mixtures of vetches and cereals. According to polygon view of traits and combination; seed yield, pod number /plant and plant height were found to be heighest value from pure stand Orakefe. Seed yield, tausand seed weight, planth height, Branch and pod number /plant were the heighest value in pure stand NV570. In addition NV570+sebat had maximum dry forage yield. Sarıefe as purestand has the maximum planth height and seed yield value. On the other hand Sarıefe+Scarpia combination showed very high value for pod number/plant, branch number/plant, and fresh and dry forage yield. Purestand Scarpia was the best performer in seed yield. CV+NV+Scarpia had the highest tausand seed weight, fresh and dry forage yield. Maximum planth height was determined from Sebat+ scarpia, CV+O+B and CV+HV+B combinations. Favurable seed yield and tausand seed weight value was produced under purestand sebat seeding. Intercrop NV570+O combination had the higher fresh and dry forage yield. CV+HV+O, CV+NV+O
and CV+B+O combination had the highest plant height of sebat.
REFERENCES
[1] Abd El Moneim, A.M., Cocks P.S., Swedan, Y., 1988. Yield stability of selected forage vetches (Vicia spp.) under rain fed conditions in West Asia. Journal of Agriculture Science, 111: 295-301.
[2] Acikgoz, E. 1982. Cold tolerance and its association with seedling morphology and chemical composition in annual forage legumes. II. Vetch (Vicia) species. Plant Breeding, 88: 278-286.
[3] Açikgoz, E. 1988. Annual forage legumes in the arid and semi-arid regions of Turkey. In: Nitrogen Fixation by Legumes in Mediterranean Agriculture. (Eds.: D.B. Beck and L.A. Materon). Martinus Nijhoff Publ., pp. 47-54.
[4] Açikgöz, E., 2001. Forage Crops. U.U. Güçlendirme Vakfı Yayın No: 182, 584 pp., Bursa.
[5] Alemu, D., W. Mwangi, M. Nigussie, and D. J. Spielman. 2007. An Analysis of Maize Seed Production and Distribution Systems in Ethiopia’s Rift Valley. Ethiopian Institute of Agricultural Research (EIAR) Research Report 72. Addis Ababa: EIAR.
[6] Anil, L., Park, J., Phipps, R.H., Miller, F.A., 1998. Temperate intercropping of cereals for forage: a review of the potential for growth and utilization with particular reference to the UK. Grass Forage Sci. 53, 301–317. Association of Official Analytical Chemists (AOAC), 1980. Official Methods of Analysis, 11th ed. AOAC, Washington, DC, p. 125.
[7] Anlarsal A., Yücel C., "The Effect Of Different Sowing Times And Seeding Rates On The Potential Of Forage Production Of Fenugreek Lowland Conditions ", Agricolture Mediterranea. , vol.125, pp.172-176, 1995.
[8] Ansar M., M. A. Mukhtar, R. S. Sattar, M. A. Malik, G. Shabbir, A. Sher and M. Irfan. 2013. Forage yield as affected by common vetch in different seeding ratios with cereals in Pothohar region of Pakistan. Pak. J. Bot. 45(SI):401-408.
[9] Buyukburc, U. and Y. Karadag, 2002. The amount of NO3-N transferred to soil by legumes, forage and seed yield, and the forage quality of annual legume + triticale mixtures. Turk J. Agric For., 26: 281-288. [10]Caballero, R., Goicoechea, E.L., 1986. Utilization of
winter cereals as companion crops for common vetch and hairy vetch. In: Proceedings of the 11th General Meeting of the European Grass. Fed. pp. 379–384. [11]Caballero R., E. L. Goicoechea, P. J. Hernaiz. 1995.
http://dx.doi.org/10.22161/ijeab/2.6.29 ISSN: 2456-1878
sown at varying seeding ratios and seeding rates of vetch. Field Crops Research. 41:135-140.
[12]Droushiotis, D.N., 1989. Mixtures of annual legumes and small-grained cereals for forage production under low rainfall. J. Agric. Sci. 113, 249– 253.
[13]Ercoli, R., J. García, L. Salvini, A. Izzo and J. Bartozzetti. – 1997. Manual del dispositivo de seletividad de langostino con doble grilla Disela II. INIDEP, Inf. Téc. Int., Julio, 1997: 1-7.
[14]Gabriel, K. R. (1971). The biplot graphical display of matrices with application to principal component analysis. Biometrika 58, 453–467. doi: 10.1093/biomet/58.3.453.
[15]Geno, L., and B. Geno, 2001. Polyculture Production: Principle, benefits and risk of multiple cropping. A report for the Rural Industry Research and Development Corporation (RIRDC), Publication, No. 01134.
[16]Hauggaard-Nielsen H, Ambus P, Jensen ES 2003. The comparison of nitrogen use and leaching in sole cropped versus intercropped pea and barley. Nutr Cycl Agroecosyst 65:289–300).
[17]http://www.fao.org/ag/agp/agpc/doc/counprof/Turkey /Turkey.htm
[18]Lithourgidis, A.S., Vasilakoglou, I.B., Dhima, K.V., Dordas, C.A, Yiakoulaki, M.D. 2006). Forage yield and quality of common vetch mixtures with oat and triticale in two seeding ratios. Field Crop Res 99: 106–113.
[19]Lunnan, T. 1989. Barley-pea mixtures for whole crop forage. Effects ofdifferent cultural practices on yield and quality. Norwegian J. Agric. Sci, 3.
[20]Martiniello, P. and A. Ciola. 1995. Dry matter and seed yield of Mediterranean annual legume species. Agron. J., 87: 985-993.
[21]Minitabm 2005. Analysis of variance. minitab 14 Help to-go-field. http:// www. Minitab.com/support/docs/re114/14 help files/ Statistics. Analysis of variance. Pdf. Retrived November 19, 2007.
[22]Mohammadi, S.A., Prasanna, B.M. 2003. Analysis of genetics diversity in crop plants: salient statical tools and considerations. Crop Sci 43: 1235-1248.
[23]MSTAT-C, 1988. A Microcomputer Program for the Design, Management, and Analysis of Agronomic Research Experiments. Crop and Soil Sciences Department, Michigan State University, East Lansing.
[24]Osman, A.E. and A.M. Osman, 1982. Performance of mixtures of cereal and legume forages under irrigation in the Sudan. J. Agric. Sci., 98: 17–21 [25]Papastylianou, I. 1995. Effect of rainfall and
temperature on yield of Vicia sativa under rainfed
Mediterranean conditions. Grass and Forage Science, 50: 456-460.
[26]Papastylianou, I. 2004. Effect of rotation system and N fertilizer on barley and common vetch grown in various crop combinations and cycle lengths. J. Agric. Sci. 142, 41–48.
[27]Qamar I.A., Keatinge J.D.H., Mohammad N., Ali A., Khan M.A. 1999. Introduction and management of common vetch/barley forage mixtures in the rainfed areas of Pakistan. 3. Residual effects on following cereal crops, Aust. J. Agr. Res. 50, 21–27
[28]Roberts, C.A., Moore, K.J., Johnson, K.D. 1989. Forage quality and yield of wheat-common vetch at different stages of maturity and common vetch seeding rate. Agron. J. 81, 57–60.
[29]Shiri, M.R. 2013. Grain yield stability analysis of maize (Zea Mays L.) hybrid under different drought stress conditions using GGE biplot analysis. Crop Breeding Journal, 3, 107— 112.
[30]Thompson, D.J., Stout, D.G., Moore, T. 1992. Forage production by four annual cropping sequences emphasizing barley irrigation in southern interior British Columbia. Can. J. Plant Sci. 72, 181–185. [31]Tuna, C. and Orak, A. 2007. The role of
intercropping on yield potential of common vetch (Vicia sativa L.)/ oat (Avena sativa L.) cultivated in pure stand and mixtures. J. of Agric. and Bio. Sci., 2 (No.2): 14-19.
[32]Yan, W., L.A. Hunt, Q. Sheng and Z. Szlavnics, 2000. Cultivar evaluation and mega-environment investigation based on the GGE biplot. Crop Sci., 40: 597-605.
[33]Yan, W., P.L. Cornelius, J. Crossa and L.A. Hunt, 2001. Two types of GGE Biplots for analyzing multi-environment trial data. Crop Sci., 41: 656-663. [34]Yan, W. and I. Rajcan, 2002. Biplot analysis of test
sites and trait relations of soybean in Ontario. Crop Sci., 42: 11-20.
[35]Vandermeer, J.H. 1992. The Ecology of Intercropping. Publisher: Cambridge University Press.
[36]Yan, W. 2001. GGE biplot—a Windows application for graphical analysis of multi-environment trial data and other types of two-way data. AgronJ 93(5): 1111-1118.