6
Copyright © 2017. Vandana Publications. All Rights Reserved.
Volume-7, Issue-6, November-December 2017
International Journal of Engineering and Management Research
Page Number: 6-11
Promotional Mix as the Strategic Tool for Improving Brand Equity
(A Case in Franchise Fast Food Restaurants in Sri Lanka)
S.F.Fasana1, A.G. Haseena2
1,2Uva Wellassa University, Badulla, SRI LANKA
ABSTRACT
Brand equity is an important concept for associating a brand and influencing customers in making purchase decisions for particular brand products. In developing the concept of brand equity, a number of factors are playing key roles and marketers are using promotional tools with the expectation of positioning their brands by creating value for the brand and increasing the ability to recall or recognize it. This study sought to analyze brand equity with perceived promotional mix strategies in franchise fast food restaurants in Sri Lanka. The present
study empirically evaluated five promotional mix
dimensions (advertising, sales promotion, personal selling, direct marketing, public relation) and their impact on brand equity in franchise fast food restaurants in Sri Lanka. The sample consisted of 90 customers of 9 franchise fast food restaurants. Primary data were gathered through a structured questionnaire among the respondents in sample. The research findings revealed that there is a strong positive relationship between perceived promotional mix strategies and brand equity of the franchise fast food restaurants. However, advertising and direct marketing are the key factors that influence mostly on brand equity in franchise fast food restaurants. Further, almost all the consumers show their acceptance towards the prevailing promotional mix strategies adopted by fast food restaurants. In the light of the results, possible managerial implications are discussed and future research subjects are recommended. This research contributes to the growing literature on the promotional mix strategies and brand equity of the fast food business chains.
Keywords-- Perceived Promotional Mix Strategies, Brand equity, Franchise Fast Food Restaurants
I.
INTRODUCTION
Today’s business atmosphere is a dynamic and competitive due to the continuous and rapidly changing elements in the market and dramatic innovation in the information technology. Also business enterprises have to adopt many different types of strategic tools to survive in the changing market. Organizations are trying to achieve its goals through applying effective marketing practices. In every business customers are the assets or
center of success. In order to be successful, every organization has to follow some promotional strategies and business strategies such as franchising and contracting. Franchisee-owned locations accounted for 56.3%, of fast food industry’s total locations in 2001. McDonald's (MCD) operates as one of the world's largest fast food chains, and earns 82% of annual revenue from franchising businesses approximately
31,230 restaurant locations and only 16% of the revenue from its company operated locations in 2016 (Annual Report of McDonalds, 2016).
Promotional mix is a term used to describe the set of tools that a business can use to communicate effectively to the benefit of its product and services to its customers. It consists of five elements called advertising, sales promotion, personal selling, direct marketing and public relation (Principles of marketing /Frances Brassington, Stephen pettitt.-4th ed, 2006). Aaker (1991) approaches brand equity as a set of fundamental dimensions grouped into a complex system comprising mainly brand awareness, brand perceived quality, brand loyalty and brand associations.
Further, Udurawana (2013) mentioned, fast food means simple, fast and convenience food. Fast food consumption is rapidly growing with the people’s hard-working professional living, and busy life styles in all over the world. Fast food restaurants are playing a major role among the people .According to that there are huge numbers of meals eaten outside home and expenditure on these is increasing in many countries. Hence, nowadays fast food restaurants are growing rapidly with a higher demand. For an example, Subway has opened its 40,000th outpost worldwide. The extensive chain has already added 1,761 outlets since the start of 2013 and plans to add another 10,000 new locations by 2017 (www.businessweek.com Aug 26, 2013). McDonald’s the world’s second biggest fast-food chain and there are nearly 36, 899 restaurants have opened in 2016 (Annual Report of McDonalds, 2016).
7
Copyright © 2017. Vandana Publications. All Rights Reserved.
service. Thus, it becomes difficult for any restaurant to achieve a competitive advantage over another; therefore they adopt the promotional tools to obtain more market segment (Bryant and Dundes, 2008). Brand equity is expensive to build; it is the difficult to differentiate one fast food restaurant from another. Most of the fast food restaurants make serious effort to build recognizable brand names. (Aseambankers, 2007) explained that Global brands, such as McDonald’s, KFC, and Pizza Hut are excellent in managing brand; this is because of the investment had made in branding and marketing research. Fast food brand equity has a multidimensional model. It is made of perceived quality, brand awareness, brand familiarity, brand image, and brand loyalty (Tan et al., 2011) Fast food restaurants are highly liable to building strong brand names because of highly similar services and foods are provided.
Promotional mix
Cole (1996) defines promotion mix as “the way to bring customers from a state of relative unawareness to a state of actively adopting the product” it elaborates communicating with individuals, groups, or organizations to directly or indirectly informing and educating one or more target audience. It is the direct way in which an organization tries to communicate with various target audiences. It consists of five main elements; advertising represents non-personal, mass communication; personal selling deals with covering face-to-face, personally customized messages; sales promotion involves short term encouragements to motivate customers; public relation is about maintaining relations with external parties; direct marketing involves creating one-to-one relationship with customers (Principles of marketing /Frances Brassington, Stephen pettitt-4thed, 2006).
Berkowitz et al (1997) defined promotion as a means of communication between the trading parties who are seller and buyer. A company can use one or more of the promotional alternatives that is personal
selling, advertising, sales promotion and public relation to communicate with the customers. Further, Fische (1996) noted and argued that three of the promotional mix elements, which include advertising, sales promotion and public relation, are often used in mass selling because they are used with groups of potential buyers. Promotional mix is the important tool between the service providers and the customers in building up a good relationship among them. It is the stimuli factor to the service consumers (S.Sivesan 2013).
Brand Equity
(Aaker, 1991) has defined brand equity is a set of assets and liabilities align with the brand, which add value to a product in relationship with customers. Further the researcher believed that the value of brand equity came from five brand equity assets; brand loyalty, brand awareness, perceived quality, brand association, brand image). (Neal, 2000) explained brand equity is the major weapon. It means building sustainable competitive advantage and creating a differential advantage. Fast food service chain restaurants are willing to build strong brand names because they are providing similar services and foods. Brand equity contributes to possibility of brand extension to other product categories. Successful brand extensions contribute to higher brand equity of the original brand and unsuccessful brand extensions reduce the brand equity of the parent brand (Aaker and Keller, 1990). (Keller, 1993) defined that brand equity is the differential effect of brand recognition and identification on consumer response to the marketing of that brand. (Farrquhar, 1989) suggested brand equity is a power that a brand have achieved it in a market because of its name, sign and logo.
8
Copyright © 2017. Vandana Publications. All Rights Reserved.
II.
METHODOLOGY
This study has utilized convenience sampling method and sample consisted of 90 customers of 9 franchise fast food restaurants in capital city of Sri Lanka. The data for the study were collected through structured questionnaires. Questionnaire consists three parts. First part is acquiring demographic information about consumers of Franchise fast food restaurants such as gender, age, income, etc. This part was used to get overall view about consumers. Other part questions were organized regarding promotional mix and brand equity. Questions have created based on five point Likert Scale in order to identify the impacts of promotional mix on brand equity. The scale is ranging from strongly agree (SA) to strongly disagree (SD). Further, study has adopted descriptive
analysis, correlation and regression analysis to achieve the objectives.
III.
DATA ANALYSIS AND
INTERPRETATION
In any research reliability of questions must be checked before finishing the data collection. In order to achieve it alpha test has been done. It explains the reliability of questions which were made to measure the variables. Further it explains the consistency between the questions and can identify the weaker consistence question. Accordingly all the promotional mix elements scored alpha value more than 0.7
3.1 Descriptive Analysis
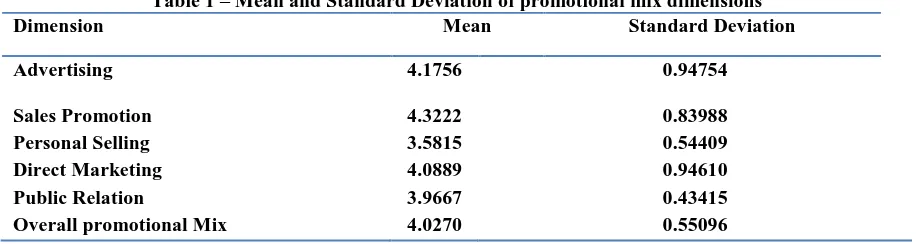
Table 1 – Mean and Standard Deviation of promotional mix dimensions
Dimension Mean Standard Deviation
Advertising 4.1756 0.94754
Sales Promotion 4.3222 0.83988
Personal Selling 3.5815 0.54409
Direct Marketing 4.0889 0.94610
Public Relation 3.9667 0.43415
Overall promotional Mix 4.0270 0.55096
According to the Table 1, “mean” of all the variables fall under the range of 3.5<=X<5. This illustrates that almost all the participants agree with the existing situation of advertising, sales promotion, personal selling, direct marketing and public relation in franchise fast food restaurants. Mean value and standard variation of Advertising is 4.1756 and 0.94754 respectively. This mean value implies that customers are agreeing with the existing situation of Advertising in franchise fast food restaurants. Customers agree with the current situation of publicity, television advertisement and printed advertisement in franchise fast food restaurants. When consider sales promotion dimension, its mean is 4.3222 and standard deviation is 0.83988. It also implies that customers are agreeing with the existing situation of sales promotion of franchise fast food restaurants. Product based sales promotion, coupons; door to door sales promotions are available for customers of franchise fast food restaurants For the personal selling, mean and standard deviation are 3.5815
and 0.54409 respectively. It emphasizes customers agree with the existing situation of personal selling in franchise fast food restaurants. Customers agree with the situation of sales staff, representative sales man, personal communication. According to mean value of direct marketing, it is 4.0889 and which implies that customers are moderately agreeing with the current situation of direct marketing. Customers agree with the existing direct marketing communication methods, direct response arrangements and face to face marketing. Mean and standard deviation of public relation dimension is 3.9667 and 0.43415 respectively. It is obvious that customers are agreeing with the existing situation of franchise fast food restaurants’ public relation like organized social events and websites of franchise fast food restaurants create better public relation. For an example McDonald’s introduced its own sauce bottle for the customers and the money collected through it funded to the people who are affected by cancer disease.
3.2 Correlation coefficient analysis
Table 2 - Correlation between Promotional Mix Dimensions and Overall Brand Equity
Dimension Pearson correlation P-value
Advertising 0.848 0.000
9
Copyright © 2017. Vandana Publications. All Rights Reserved.
Personal Selling 0.551 0.000
Direct Marketing 0.837 0.000
Public Relation 0.199 0.061
Above Table 2 illustrates the correlation between Promotional mix dimensions and Brand equity. For the Advertising, it denotes an amount of 0.848 correlations with brand equity which is suggested that there is strong positive relationship between independent variable advertising and dependent variable brand equity. Further, there is a significant association between these two variables.
Correlation coefficient of sales promotion and brand equity is 0.494 and which implies that there is a weak relationship between sales promotion and brand equity. Personal selling and brand equity is 0.551 and which implies that there is a strong positive relationship between personal selling and brand equity. Correlation coefficient of direct marketing is 0.837 to the brand equity. This indicates that there is a strong positive relationship between these two variables. For the public relation there is a 0.199 correlation coefficient value
with brand equity, indicating that there is a weak positive relationship between public relation and brand equity. In addition, p-value of 0.061 indicates that there is no any significant association between these two variables at 0.05 level of significant. It can be concluded that advertising, personal selling and direct marketing have strong positive significant association with brand equity. Further, sales promotion has weak positive significant association with brand equity. While public relation has weak positive insignificant association with brand equity.
3.3 Regression Analysis
3.3.1 Multiple Linear Regression
Model summary of multiple linear regressions was presented in the following Table 3 and it was included value of R value, R Square value and adjusted R square value and value of standard error of estimate.
Table 3- Model Summery of Multiple Linear Regression Analysis
Figure Value
R Square 0.821
Adjusted R Square 0.810
Standard Error of Estimate 0.42580
According to Table 4, the R Square or Coefficient of determination for the model is obtained as 0.821. It suggested that 82.1 per cent of variation in dependent variable promotional mix is explained by independent variables advertising, sales promotion, personal selling, direct marketing and public relation. Therefore it can be identified that there is 17.9 per cent of unexplained variation in this model. Furthermore,
0.821 is substantially high and therefore it is significant. Adjusted R square is represented the modification of R square that adjusted for the number of explanatory in a model.
Analysis of variance was presented in the following Table 4 and it included sum of squares, degree of freedom, F value and P value.
Table 4 - Analysis of Variance for Multiple Linear Regressions Model Sum of Squares Degrees of
Freedom
F Significant
Regression 69.740 5 76.930 0.000
Residual 15.230 84
Total 84.969 89
It is revealed that out of 84.969 of total sum of square, 69.740 of variation can be explained by regression and 15.230 of variation of dependent variable
brand equity is explained by residual. Thus, it can be concluded that model was fitted well because large proportion is contributed by regression.
Table 5 - Multiple Linear Regression Analysis of Promotional Mix dimensions versus Brand Equity Predictor ß Coefficients Standard Error T-value P-Value
Constant 0.177 0.523 0.338 0.736
10
Copyright © 2017. Vandana Publications. All Rights Reserved.
Sales Promotion 0.212 0.058 3.641 0.000
Personal Selling 0.188 0.099 1.908 0.040
Direct Marketing 0.434 0.094 4.606 0.000
Public Relation -0.258 0.113 -2.285 0.025
According to table 5, constant (ß0) was 0.177 which implies that while all promotional mix dimensions remain zero, customer satisfaction is 0.177. It means without promotional mix, brand equity is lower. P- Value of constant term was 0.736 and which stated it was statistically insignificant at 0.05 level of significant. In addition, most of the beta coefficient values represented positive values and thereby it is obvious that there is a positive relationship between promotional mix and brand equity.
When consider advertising, the ß coefficient of 0.418 indicates that when advertising increased by one unit while other variables remain constant, brand equity increased by 0.418 units. It can be seen that advertising contributed significantly to the model since p-value of 0.000 is less than 0.05 level of significant. Therefore null hypothesis H0 was rejected and alternative hypothesis H2 was accepted. Hence, there is a significant relationship between advertising and brand equity.
According to coefficient of sales promotion, one unit of increase in sales promotion while other variables remain constant, brand equity was increased by 0.212. Further, this was significantly contributed to the model as p-value of 0.000 is less than the 0.05 level of significant. Therefore null hypothesis H0 was rejected and alternative hypothesis H3 was accepted. Hence, there is a significant relationship between sales promotion and brand equity.
When looking at personal selling, it can be identified when personal selling increased by one unit while other variables remain constant, it result in increase of brand equity by 0.188 unit. This is significant
at 0.05 level of significant since its p-value of 0.040 is less than 0.05. Therefore null hypothesis H0 was rejected and alternative hypothesis H4 was accepted. Hence, there is a significant relationship between personal selling and brand equity.
When consider coefficient of direct marketing, one unit of increase in direct marketing while other variables remain constant, brand equity was increased by 0.434. Further direct marketing significantly contributed to the model as its p-value of 0.000 is less than 0.05 level of significant. Therefore null hypothesis H0 was rejected and alternative hypothesis H5 was accepted. Hence, there is a significant relationship between direct marketing and brand equity
It was indicated that coefficient of public relation was -0.258, which meant when one unit of increase in public relation while other variables remain constant. Further, p-value of 0.025 stated that public relation was significantly contributed to the model. Therefore null hypothesis H0 was rejected and alternative hypothesis H6 was accepted. Hence, there is a significant relationship between public relation and brand equity.
According to above information, advertising, sales promotion, personal selling, direct marketing, public relation were highly significant for the model as its p-values were less than 0.05. Among these variables brand equity was highly impacted by direct marketing (0.434) and advertising (0.418) respectively. However, public relation was not impacted highly on brand equity (-0.258).
By using above information, multiple regressions model can be articulated as follows.
BE = 0.177 + 0.418 AD + 0.212 SP + 0.188 PS + 0.434 DM – 0.258
IV.
CONCLUSION AND
IMPLICATIONS
Major objectives of this research were to identify the existing situation of promotional mix and brand equity, to identify relationship between promotional mix and brand equity, and to identify the impact of promotional mix and brand equity in franchise fast food restaurants.
The results of multiple regression analysis show that the all elements of promotional mix impact on brand equity in franchise fast food restaurants. Advertising, sales promotion, personal selling, direct marketing and public relation are significantly impact on brand equity in franchise fast food restaurants.
11
Copyright © 2017. Vandana Publications. All Rights Reserved.
providing sales promotion a restaurant can build a long-term relationship with customers. Over a period of lifetime, the restaurants should offer customer seasonal benefits in celebrations. Therefore it can maintain a successful relationship with customers. Moreover, personal selling is also significantly influence on brand equity in franchise fast food restaurants. It means that customers are satisfied with the sale persons’ activities, order making system of sales representatives and direct communication of employees. Moreover personal selling is improved continuously by the franchise fast food restaurants. The last factor which influence on brand equity in franchise fast food restaurants in Sri Lanka is public relation. Also it is negatively impact on brand equity, it has a significant relationship. Therefore restaurants keep considerations on social and welfare campaign for society.
This research is conducted to identify the impact of promotional mix on brand equity in franchise fast food restaurants in Sri Lanka. This study further shows that five promotional mix dimensions (Advertising, Sales promotion, Personal selling, Direct marketing, Public relation) have an impact on brand equity. Because this study shows that there is a positive relationship between promotional mix dimension and brand equity with special reference to franchise fast food restaurants. In practical terms, this means that improving promotional mix will increase brand equity in franchise fast food restaurants.
The impact of promotional mix dimension on brand equity is considered as most influential dimension and lead to have higher response from customers. Direct marketing is the most influential dimension and advertising is the second dimension. And public relation is less influential dimension on brand equity in franchise fast food restaurants. However, the results and recommendation of this study can be used for promotional mix improvements, innovation strategies and consequently improving brand equity in franchise fast food restaurants.
Our research findings suggest fertile directions for future research. First, further investigation might be directed toward other service sector while evaluating the impact of promotional mix elements on brand equity. The limitation is that geographically the area concerned only Capital city of Sri Lanka. It can be done in other parts of the country or for the whole country. And the questionnaires were given to 90 respondents in 9 franchise fast food restaurants. It also can be widen to a large number of respondents. Further this study has been done by using main branches of whole population but fewer amounts of respondents due to the time constraints. Therefore future researchers can be move towards a considerable population including branches of franchise fast food restaurants and wide area by expanding sampling frame.
Furthermore, future studies could focus on other direct marketing factors and could examine the dimensions that drive the brand equity of customer. Another future research might be innovation aspect of
the fast food industry as well as further empirical research should be done on the service quality, marketing mix and brand equity.
REFERENCES
[1] Aaker, D.A. (1991). Managing brand equity. New York: Maxweel Macmillan-Canada.
[2] Aaker, D.A. (1996). Measuring brand equity across products and markets. California Management Review, 38(3), 102-120.
[3] Agarwal, M.K., & Rao, V.R. (1996). An empirical comparison of consumer-based measures of brand equity. Marketing Letters, 7(3), 237-247.
[4] Onditi, A.A. (2012). An evaluation of promotional elements influencing sales of an organization: a case study of sales of agricultural and non-agricultural products among women groups, homa bay district, kenya. International Journal of Business and Social
Science, 3(5), 296-313.
[5] Sunday, A. & Bayode, B. (2011). Strategic influence of promotional mix on organisation sale turnover in the face of strong competitors. Business Intelligence
Journal, 4(2), 343-350.
[6] Madiba, G. & Roberts-Lombard, M. (2011). Measuring the attitude and intention to purchase different cohorts towards a fast food retailer. African
Journal of Business Management, 5(9), 3649-3665.
[7] Abdelhamied, H.H.S. (2013). The effects of sales promotion on post promotion behaviors and brand preferences in fast food restaurants. Tourismos: An
International Multidisciplinary Journal of Tourism, 8(1),
93-113.
[8] Mohammad,B.G., Sayyed M.B. & Samira.H. (2013). Examining of promotion mix situation and relationship between promotional mix factors with customer acquisition in the bank. Advanced Research in Economic
and Management Sciences, 11, 261-268
[9] Kanina, M.P. (2013). Influence of promotion mix strategies on the growth of customers of pathologists lancet Kenya (Doctoral Dissertation, School of Business,
University of Nairobi). Available at:
http://chss.uonbi.ac.ke/sites/default/files/chss/Mbogo%2 0Final%20project%20november%202013.pdf
[10] Muthenya, D.M. (2006). The extent of the use of sales promotion tools by fast food restaurants within Nairobi's central business district (Doctoral dissertation). Available at:
http://erepository.uonbi.ac.ke/handle/11295/22043 [11] Keller, K.L. (2003). Strategic brand management:
Building, measuring, and managing brand equity. New
Jersey.
[12] Morgan, R. P. (2000). A consumer-oriented framework of brand equity and loyalty. International
Journal of Marketing Research, 42(1), 65-78.
[13] Shafi & Madhavaiah. C. (2013). An emprical study on impact of promotional mix elements on brand equity: