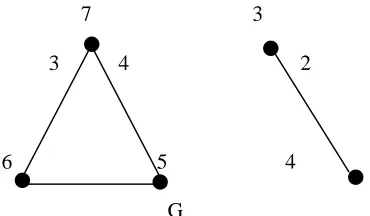
Connectivity Analysis of a Network by Levels
Full text
Figure

Related documents
19% serve a county. Fourteen per cent of the centers provide service for adjoining states in addition to the states in which they are located; usually these adjoining states have
For example, the rule “Magenta ˄ Mostly gray ˄ Medium dark ⇾ Purple” is defined by manually classifying the color produced by the HSV triple, such that the values of
Figure 6 below shows the graph for different values of network loss v/s the simulation run-time keeping the total number of nodes fixed at 3000..
Post Graduate Dept. of Biotechnology, Alva’s College, Moodbidri-574 227, Karnataka, India. Biodiversity hotspots like Himalayan region and Western Ghats are bestowed with
122 | P a g e concepts (X=2.84); adapting teaching methods to meet indiv iduals student’s needs (X=2.74); linking students’ ideas, values and beliefs to their classroom
Field experiments were conducted at Ebonyi State University Research Farm during 2009 and 2010 farming seasons to evaluate the effect of intercropping maize with
The IC 50 values of methanolic extract of Artocarpus heterophyllus were found 35.26 µgm/ml and 35.27 µgm/ml against A549 cell line by MTT and SRB assay methods respectively
As a result of national developmental projects such as increased accessibility to safe water during recent years in Iran, contaminated water is not a main rout of