ISSN: 2347-6346
Available online at http://ijpdr.com
Original Research Article
FORMULATION, DEVELOPMENT AND EVALUATION OF
BUFFER ESOMEPRAZOLE TABLET IN TABLET
PREPARATION
Parag Das1*, Debajyoti Das2
1. Jeypore College of Pharmacy, Randapally, Jeypore, Odisha.
2.
School of Pharmaceutical Sciences, Sikshya- O- Anusandhan University, Kalinga Nagar, Ghatikia, Bhubaneswar, Odisha.*Correspondence Info
Parag Das
Jeypore College of Pharmacy, Randapally, Jeypore, Odisha. Corresponding Author’s Email: [email protected]
Received 15 March 2014; Accepted 21 May 2014
Received 10 April 2014; Revised 18 April 2014; Accepted 30 April 2014
ABSTRACT
Esomeprazole is the S-isomer of omeprazole, which is a mixture of the S- and R- isomers. The stability of Esomeprazole magnesium is a function of pH; it rapidly degrades in acidic media, but it has acceptable stability under alkaline conditions. As the API is acid Habile, so the main strategy was to develop a formulation giving protection to API as well as safe and effective release so as to impart its action in an effective manner. So first of all conventional formulations were designed having drugand buffer part compressed together (Tablet in Tablet), along with alkalizing agent. The purpose of the research work as the esomeprazole is acid Habile, so the main strategy was to develop a formulation giving protection to API as well as safe and effective release so as to impart its action in an effective manner. So first of all conventional formulations were designed having drug and buffer part compressed together (Tablet in Tablet), along with alkalizing agent. The formulation is designed as a way to have release as well as, to give protection to drug part against acid environment of stomach, for that tablet in tablet strategy was followed in such a way that buffer part of final tablet provide protection to drug part by mechanism of raising pH as well as by maintaining that pH range for a period of sufficient time so that total drug from inner tablet is released and absorb from that pH. The prepared batches of tablets were evaluated for hardness, friability, drug content, wetting time, dispersion time, disintegration time and dissolution studies. Based on tested for in-vitro drug release pattern (in 0.1N HCL) and short term stability studies. Among the promising formulations, the formulation F6 emerged as the overall best formulation based on drug release characteristic.
INTRODUCTION:
The oral route of drug administration is the most common and preferred method of delivery due to convenience and ease of ingestion. From a patient’s perspective, swallowing a dosage form is a familiar means of taking medication. As a result, patient compliance and hence drug treatment is typically more effective with orally administered medications as compared with other routes of administration (Bagman et.al.2013). The concept of pH does not apply to solids, the terms microenvironmental pH or surface pH have been used in conjunction with solid formulations (Badawy et.al. 1999). Those terms have been loosely used to describe hydrogen ion activity in non-crystalline regions such as sorbed water layers or water-plasticized amorphous domains (Glombitza et.al. 1994, Glombitza and Schmidt, 1994). The microenvironmental pH has been implicated as a factor influencing drug degradation of solid dosage forms. Microenvironmental pH also affects dissolution behavior and hence bioavailability of many compounds, especially weak bases. The concept of microenvironmental pH, however, is not well defined and there are no well-established techniques available to measure it (Zinchuck et al. 2005).
The objective can be designed in such a manner
that a tablet of esomoprazole will be
manufactured by using direct compression/dry
granulation method, than after tablet
compression, film coating of same tablet, then
will be further compressed with the buffer
granules contains (tablet in tablet). After
administration of the tablet in tablet, it will be
disintegrate in the stomach immediately.
MATERIAL AND METHODS:
API (Esomeprazole magnesium trihydrate) and
other necessary excipients were kindly provided by
Torrent Pharma Ltd, Ahmedabad, Gujrat, India. All
the reagents and solvents used in the experimentation
were of AR grade unless otherwise specified.
Methods:
Formulation of Esomoprazole Inercoat tablet:
Immediate release tablets of Esomoprazole were
prepared by wet granulation method according to
the formula given in Table 1. Esomoprazole,
microcrystalline cellulose and crosspovidone sifted
through sieve No. 40 and thoroughly mixed in a
Rapid Mixer Granulator (RMG) for 10 min. PVP
K30 dissolved in sufficient quantity of IPA, and
used as a binder solution. Wet granules were dried
in fluid bed dryer (FBD) at 60-65C till a LOD
(Loss of drying) of dried granules obtained not
more than 2% w/w. Dried granules were passed
through sieve No.24. The dried granules were
lubricated for 2 min with Magnesium Stearate and
talc. The lubricated granules were then
compressed in to tablets on an 8 station rotary
Formulation of Outer coat tablet of Esomoprazole:
After punching of inner coat, microcrystalline
cellulose, cross carmellose sodium, crosspovidone,
sifted through sieve No. 40 and thoroughly mixed
in a Rapid Mixer Granulator (RMG) for 10 min
according to the formula given in Table 2. PVP
K30 dissolved in sufficient quantity of IPA, and
used as a binder solution. Wet granules were dried
in fluid bed dryer (FBD) at 60-650C till a LOD
(Loss of drying) of dried granules obtained not
more than 2% w/w. Dried granules were passed
through sieve No.24. The dried granules were
lubricated for 2 min with Magnesium Stearate and
talc. The lubricated granules were then
compressed in to tablets on an 8 station rotary
machine to get a tablet of 1500 mg weight.
Table 1: Formulation of Inner coat tablet of Esomoprazole:
Ingredients F1 F2 F3 F4 F5 F6 Esomeprazole
Magnesium
44.60 44.60 44.60 44.60 44.60 44.60
Microcrystalline
Cellulose (PH-102) IP
111.39 109.60 107.85 111.39 109.60 107.85
Cross Carmellose Sodium -- -- -- 3.0 5.0 7.0
Crospovidone XL -10 3.0 5.0 7.0 -- -- --
Polyvinyl pyrrolidone
(K-30)
0.13 0.13 0.13 0.13 0.13 0.13
IPA q.s. q.s. q.s. q.s. q.s. q.s.
Talc 0.17 0.17 0.17 0.17 0.17 0.17
Magnesium stearate 0.25 0.25 0.25 0.25 0.25 0.25
Table 2: Formulation of outer coat tablet of Esomoprazole:
Ingredients F1 F2 F3 F4 F5 F6 Microcrystalline
Cellulose (PH-102) IP
170.00 170.00 170.00 170.00 170.00 170.00
Peppermint flavor /
Cardamom flavor
7.000 7.000 7.000 7.000 7.000 7.000
Sodium Bicarbonate
(Crystalline powder)
1100.00 1100.00 1100.00 1100.00 1100.00 1100.00
Colloidal silicon
dioxide(Aerosil)
3.00 3.00 3.00 3.00 3.00 3.00
Crospovidone XL -10 21.00 21.00 21.00 21.00 21.00 21.00
Polyvinyl pyrrolidone
(K-30)
13.00 13.00 13.00 13.00 13.00 13.00
IPA Qs Qs Qs Qs Qs Qs
Talc 13.00 13.00 13.00 13.00 13.00 13.00
Magnesium stearate 3.00 3.00 3.00 3.00 3.00 3.00
EVALUATION OF TABLET: Evaluation of Powder Blend 6-9 Bulk density:
It is a ratio of mass of powder to bulk volume. The
bulk density depends on particle size distribution,
shape and cohesiveness of particles. Accurately
weighed quantity of powder was carefully poured
in to graduated measuring cylinder through large
funnel and volume was measured, which is called
initial bulk volume (Ohwoavworhua et. al. 2004).
It is expressed in gm/ml and is given by the
formula
Bulk density=M/Vo
Where, M = mass of the powder
Vo = bulk volume of the powder
Tapped density:
Ten gram of powder was introduced into a clean,
dry 100 ml measuring cylinder. The cylinder was
then tapped 100 times from a constant height and
the tapped volume was read (Bultman et.al. 2002).
It is expressed in gm/ml and is given by
Tapped density=M/Vt
Where, M = mass of the powder
Vt = final tapping volume of the powder
Angle of repose (θ)
It is defined as the maximum angle possible
the horizontal plane. Fixed funnel method was
used. A funnel was fixed with its tip at a given
height ‘h, above a flat horizontal surface to which
a graph paper was placed. Powder was carefully
poured through a funnel till the apex of the conical
pile just touches the tip of the funnel (Mashadi
et.al. 1987). The angle of repose was then
calculated using following equation
Angle of repose (Ø) = tan-1(h/r) Where, h=height of the pile
r = radius of the pile
Compressibility index (Carr’s index)
Compressibility index is used as an important
parameter to determine the flow behavior of the
Powder. It is indirectly related to the relative flow
property rate, cohesiveness and particle size. It is
Simple, fast and popular method for predicting
flow characteristics. Carr’s index can be
represented by Equation
Hausner’s ratio
Hausner’s ratio is used to predict the flow ability
of the powders (Hancock et.al. 2000). This
method is similar to compressibility index.
Hausner’s ratio can be represented by Equation
EVALUATION OF TABLETS 10-13
All the tablets were evaluated for different
parameters as thickness, hardness, friability,
uniformity of weight, disintegration time, drug
content and in vitro dissolution study (Lachman
et.al 1987, Liberman et.al 1989, Shoukri et.al
2009, Tejakrishna et. al. 2013).
Dimensional Analysis The thickness and diameter of tablets was determined using Vernier Caliper.
Twenty tablets from each batch were used and
average values were calculated.
Hardness
The Monsanto hardness tester was used to
determine the tablet hardness. The tablet was held
between affixed and moving jaw. Scale was
adjusted to zero; load was gradually increased until
the tablet fractured. The value of the load at that
point gives a measure of the hardness of the tablet.
It is expressed in kg/cm2. For each formulation,
the hardness of six tablets was determined and
average value was calculated.
Weight variation
Randomly selected twenty tablets were weighed
individually and together in a single pan balance.
The average weight was noted and standard
deviation calculated. The tablets pass the test if not
more than two tablets fall outside the percentage
limit and none of the tablet differs by more than
double percentage limit.
Where, PD = Percentage deviation,
Wavg = Average weight of tablet,
Winitial = Individual weight of tablet
Drug content
Tablets were crushed and the powder equivalent to
100mg of drug were accurately weighed and
transferred to 50 ml volumetric flask. To this flask,
sufficient amount of distilled water was added to
dissolve the tablets completely. Then, the volume
of flask was made up to the mark with same
solvent. From this solution, 1ml of the sample was
pipette out and transferred to 10 ml volumetric
flask. The volume in the second flask was made up
to the mark with distilled water. From this 0.6ml,
0.8ml, and 1ml samples were withdrawn and
volume was made up to 10ml to maintain
concentration within the beer’s range. This final
diluted solution was estimated UV
spectrophotometrically at 298 nm.
Friability
Twenty tablets samples were weighed accurately
and placed in friabilator (Roche Friabilator). After
the given specification (4 min at 25 rpm), loose
dust was removed from the tablets. Finally tablets
were weighed. The loss in weight indicates the
ability of the tablets to withstand this type of wear.
The % friability was then calculated by
% Friability = (Loss in weight / Initial weight) × 100
Disintegration test
Disintegration is evaluated to ensure that the drug
substance is fully available for dissolution and
absorption from the gastrointestinal tract.
Disintegration test was carried out using tablet
disintegration test apparatus (EI Instrument, India)
using distilled water without disk at room
temperature (37±2C).
In vitro Drug release studies
In vitro drug release studies were carried out in
900 ml of 0.1N HCl for the first 2 h using a USP
XXII type 1 dissolution apparatus (Electrolab
TDT-08L) at 60 rpm and 37 ± 0.5 °C. At
predetermined time intervals during the
dissolution test, samples (10 ml) were withdrawn
for assay and replaced with equivalent volume of
fresh medium to maintain conditions. All
dissolution studies were performed in triplicate.
The samples were filtered, diluted appropriately
and then analyzed spectrophotometrically
(Systronics, India) for esomeprazole at 298 nm.
Stability Study:
Stability studies were conducted on buffer tablets
of select batch to assess their stability with respect
to their Hardness, weight variation and release
characteristics after storing at 25˚C under 60%
relative humidity (RH) and 40˚C under 75% RH
for 3 months. At an interval of 7 days, the tablets
variation and in vitro dissolution test (Bansal
et.al. 2013)
Result and Discussion:
Evaluation of Esomeprazole Granules:
Esomeprazole powder and the prepared granules
were evaluated for angle of repose, poured
density, tapped density and compressibility index
which was shown in Table 3. The angle of repose
of pure Esomeprazole powder could not be
measured because the powder was too cohesive
to flow through the funnel, where as the value of
prepared granules ranged from 26-31. The
housner,s ratio for granules ranged from
1.18-1.40, which shows good flow property as a result
of increase in particle size owing to granulation.
Tapped density of the granules was decreased
due to increase in the particle size compared with
the pure drug. The % compressibility value for
pure Esomeprazole was found to be 15.96-25.47,
which shows that the pure drug have very poor
flowability
Table 3: Evaluation of Pre compressed Powder Blend
Formulati on Code
Bulk Density (gm/ml)
Tapped Density (gm/ml)
Angle of
Repose (θ) Carr’s Compressibility Index
Hausner’s Ratio
F1 0.36±0.021 0.46±0.043 28 ±0.424 21.14±0.53 1.26±0.68
F2 0.32±0.030 0.45±0.048 31 ±0.413 28.95±0.63 1.40±0.67
F3 0.35±0.032 0.45±0.042 29 ±0.436 22.56±0.63 1.29±0.68
F4 0.35±0.024 0.48±0.041 26 ±0.301 25.47±0.62 1.34±0.63
F5 0.43±0.022 0.53±0.042 28 ±0.536 18.17±0.58 1.22±0.58
F6 0.46±0.037 0.55±0.046 27 ±0.465 15.96±0.61 1.18±0.67
All values are presented as Mean ±S.D.
Evaluation of Esomeprazole Tablet in Tablet: Weight Variation:
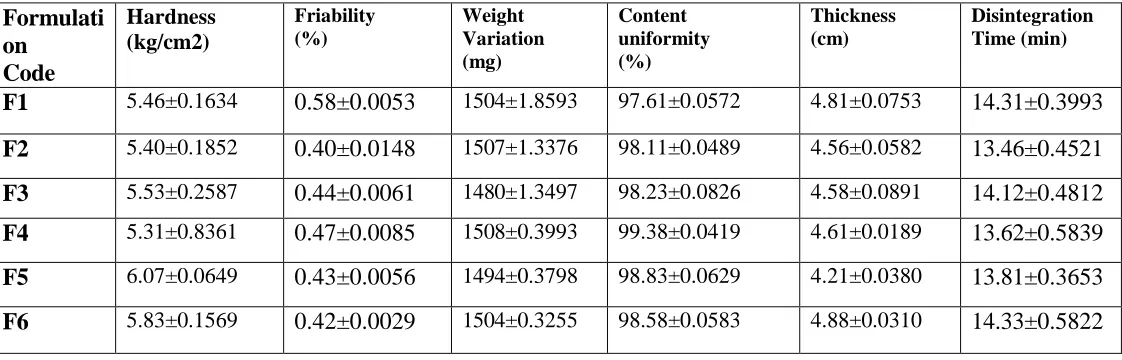
The weight variation was prominent in the
formulations with more lactose because of poor
flow Properties of the powder mixture. It ranged
from 1480 mg to 1508 mg with very high values
of standard deviation. On increasing
microcrystalline cellulose the weight variation
was significantly reduced. The results are shown
in table no. 4. All formulations pass the weight
Thickness:
The tablets from 4.21-4.81mm in thickness with
minimum standard deviation values, it assumed
that the tablets show uniformity in thickness. The
results are given in Table 4.
Hardness:
The hardness of the tablets was found to be 5.31 -
6.07 kg/cm2. The hardness of tablet varied
although compression force was constant. The
results are given in Table 4.
Friability:
The friability of the tablets was found to be
0.40-0.58%. The results are given in Table 4
Drug Content:
Drug content in the tablets was the limit of 97.61
-98.83 %. The results are given in Table 4.
Drug release:
Comparative cumulative percentage drug release
data of all formulations are given in table no. 5.
Dissolution profiles of formulations F1 to F6 are
shown in Figure 1. Drug release for different batches was found to be 91.69 to 95.96 within 45
minute. The maximum drug release was
observed in F6 among all formulations in 45
minute.
Table 4: Evaluation of Buffer Tablets of Eosmoprazole
Formulati on Code
Hardness (kg/cm2)
Friability (%)
Weight Variation (mg)
Content uniformity (%)
Thickness (cm)
Disintegration Time (min)
F1 5.46±0.1634 0.58±0.0053 1504±1.8593 97.61±0.0572 4.81±0.0753 14.31±0.3993
F2 5.40±0.1852 0.40±0.0148 1507±1.3376 98.11±0.0489 4.56±0.0582 13.46±0.4521
F3 5.53±0.2587 0.44±0.0061 1480±1.3497 98.23±0.0826 4.58±0.0891 14.12±0.4812
F4 5.31±0.8361 0.47±0.0085 1508±0.3993 99.38±0.0419 4.61±0.0189 13.62±0.5839
F5 6.07±0.0649 0.43±0.0056 1494±0.3798 98.83±0.0629 4.21±0.0380 13.81±0.3653
F6 5.83±0.1569 0.42±0.0029 1504±0.3255 98.58±0.0583 4.88±0.0310 14.33±0.5822
Table 5: Comparative In vitro % drug release profiles of formulations (F1-F6)
Time (Min) Cumulative % of Drug release
F1 F2 F3 F4 F5 F6
0 0.000 0.000 0.000 0.000 0.000 0.000
5 44.93 45.79 45.63 44.0 40.90 41.91
15 62.68 54.37 55.06 55.04 54.30 55.01
20 67.09 58.86 62.64 60.22 58.38 59.03
25 71.62 63.23 67.74 67.62 65.53 66.26
30 74.87 67.94 80.34 77.27 72.21 72.80
35 70.54 72.94 81.67 80.43 76.86 78.46
40 81.45 81.86 87.68 87.02 82.25 86.59
45 91.69 93.73 94.24 94.30 93.52 95.96
Fig 1: Invitro Drug Release of various Esomoprazole buffer tablet formulations.
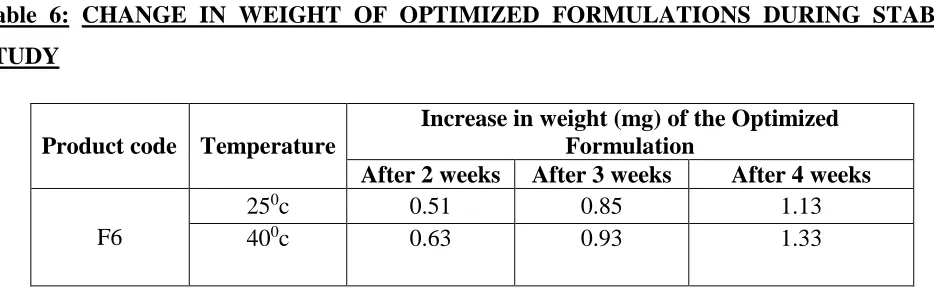
Stability Study:
Twenty tablets of optimized formulation (F6)
were placed in Petridish. Which was kept in
desiccators containing calcium chloride
(desiccant) at room temperature for one day.
Then the tablets were weighted and placed in
humidity chamber, which was maintained at
250C fewer than 60% relative humidity (RH) and
40˚C under 75% RH for 1 month.
Tablets were evaluated for weight
variation, hardness and in-vitro dissolution at
each predetermined intervals (after 1,2,3,4
weeks).
Table 6: CHANGE IN WEIGHT OF OPTIMIZED FORMULATIONS DURING STABILITY STUDY
Product code Temperature
Increase in weight (mg) of the Optimized Formulation
After 2 weeks After 3 weeks After 4 weeks
F6
250c 0.51 0.85 1.13
400c 0.63 0.93 1.33
0 20 40 60 80 100 120
0 20 40 60
C
umul
at
iv
e
% o
f
D
ru
g R
e
le
ase
Time (min)
F1
F2
F3
F4
F5
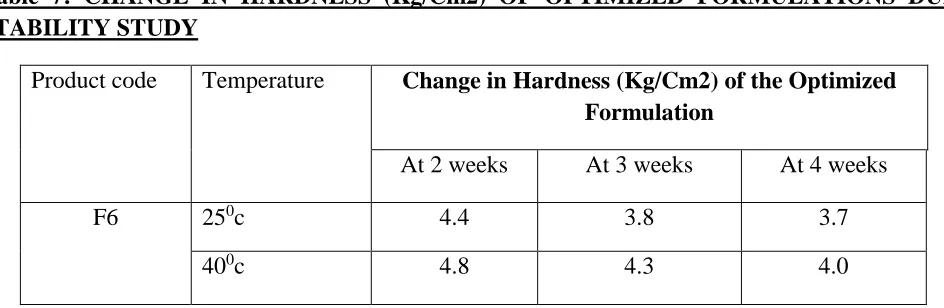
Table 7: CHANGE IN HARDNESS (Kg/Cm2) OF OPTIMIZED FORMULATIONS DURING STABILITY STUDY
Product code Temperature Change in Hardness (Kg/Cm2) of the Optimized Formulation
At 2 weeks At 3 weeks At 4 weeks
F6 250c 4.4 3.8 3.7
400c 4.8 4.3 4.0
Table 8: CHANGE IN IN-VITRO DRUG RELEASE PROFILE OF OPTIMIZED FORMULATION DURING STABILITY STUDY
Product code Temperature In-vitro % Drug release profile
At 2 weeks At 3weeks At 4 weeks
F6 250c 93.58 92.69 91.29
400c 94.58 93.76 92.32
CONCLUSION
All formulations were found to be satisfactory
when evaluated for thickness, weight uniformity,
hardness, friability, drug content uniformity,
disintegration time and in-vitro drug release. The
tablet disintegration time was less than one
minute for all the tablet formulations. The in
vitro drug release in optimized formulation F6
was found to be 95.96 % in 45 min. The
optimized formulation F6 also showed
satisfactory hardness (5.83±0.1569 kg/cm2),
friability (0.42±0.0029), drug content
(98.58±0.0583), weight variation (1504±0.3255
mg), and disintegration time (14.33±0.5822
minutes) and stability.
Reference:
Badawy SIF, Williams RC, Gilbert D. Effect of
different acids on solid state stability of an ester
prodrug of a IIb/IIIa antagonist. Pharm Dev
Technol. 1999;4: 325-331.
Bagman UR, Jade PS, Linked AS, Uttar war SG.
Formulation and in-vitro evaluation of immediate
release tablet of fexofenadine hydrochloride,
Ameriacal journal of pharmatech research, 2013;
Bansal M, Bansal S, Garg G. Formulation and
Evaluation of Immediate Release Tablets of
Zaltoprofen, Sch. Acad. J. Pharm., 2013;
2(5):398-405.
Bultman JM; Multiple Compaction of
Microcrystalline Cellulose in a Roller
Compactor. Eur. J. Pharm. Biopharm., 2002; 54:
59–64.
Glombitza BW, Oelkrug D, Schmidt PC. Surface
acidity of solid pharmaceutical excipients. Part 1.
Determination of the surface acidity. Eur J
Pharm Biopharm. 1994;4: 289-293.
Glombitza BW, Schmidt PC. Surface acidity of
solid pharmaceutical excipients. Part 2. Effect of
the surface acidity on the decomposition rate of
acetylsalicylic acid. Eur J Pharm Biopharm.
1995;41: 114-119.
Hancock BC, Christensen K, Clas SD;
Microscale Measurement of the Mechanical
Properties of Compressed Pharmaceutical
Powders, Part 1: The Elasticity and Fracture
Behavior of Microcrystalline Cellulose. Int. J.
Pharm., 2000; 209: 27–35.
Lachman L, Lieberman HA, Kanig JL; The
Theory and Practice of Industrial Pharmacy. 3rd
edition, Varghese Publishing House, Bombay.
1987: 294, 336, 413.
Lieberman HA, Lachman L, Schwartz JB;
Pharmaceutical Dosage Forms, 2nd edition,
Marcel Dekker Inc, New York.1989; 1: 195-229.
Mashadi AB, Newton JM; Assessment of the
Mechanical Properties of Compacted Sorbitol.
Instant. J. Pharm. Pharmacol., 1987; 39: 67.
Ohwoavworhua F, Adelakun T; Phospho- ric
acid-mediated depolymerisation and
decrystallization of a-Cellulose Obtained from
Corn Cob: Preparation of Low Crystallinity
Cellulose and Some Physicochemical Properties.
Tropical journal of Pharmaceutical Research,
2004; 4(2): 509-516.
Shoukri RA, Ahmed IS, Shamma RN; In vitro
and in vivo Evaluation of Nimesulide
Lyophilized Orally Disintegrating Tablets.
European Journal of Pharmaceutics and
Biopharmaceutics, 2009; 73: 162–171.
Tejakrishna M, V.Sai Kishore, K.V.S. Prasada
Rao, B.Sudheer, Formulation and Evaluation
of Mucoadhesive Micro- beads of Glimepiride,
Scholars Academic Journal of Pharmacy, 2013;
2(3):199-208.
Zinchuck AV, Hancock BC, Shalaev EY, Reddy
RD, Govindarajan R, Novak E. The influence of
measurement conditions on the Hammett acidity
function of solid pharmaceutical excipients. Eur J