A comparison of contrast sensitivity in early
mild and early intermediate age-related macular
degeneration after adjusting for age and visual
acuity
Correspondence to: Rasa Liutkevičienė, Department of Ophthalmology, Medical Academy, Lithuanian University of Health Sciences, Eivenių St. 2, Kaunas, Lithuania. E-mail: rliutkeviciene@gmail.com
Rasa Liutkevičienė1, 2,
Rasa Čiumbaraitė3, Mantas Banevičius3
1 Department of Ophthalmology,
Medical Academy,
Lithuanian University of Health Sciences, Lithuania
2 Neuroscience Institute,
Lithuanian University of Health Sciences
3 Medical Academy,
Lithuanian University of Health Sciences
Background. It has been suggested that contrast sensitivity can pro-vide valuable information about visual function in addition to visual acuity assessment. Some patients retain relatively good visual acuity, yet complain of poor vision. In these patients, other tests of visual function such as contrast sensitivity should be evaluated.
Methods. We examined patients with early mild stage age-re-lated macular degeneration (group 1), and early intermediate stage age-related macular degeneration (group 2). Digital analysis meth-odology was used for retina drusen localisation and its diameter measurement. Functional acuity contrast sensitivity tests (FACT) were performed using a Ginsburg Box, VSCR-CST-6500.
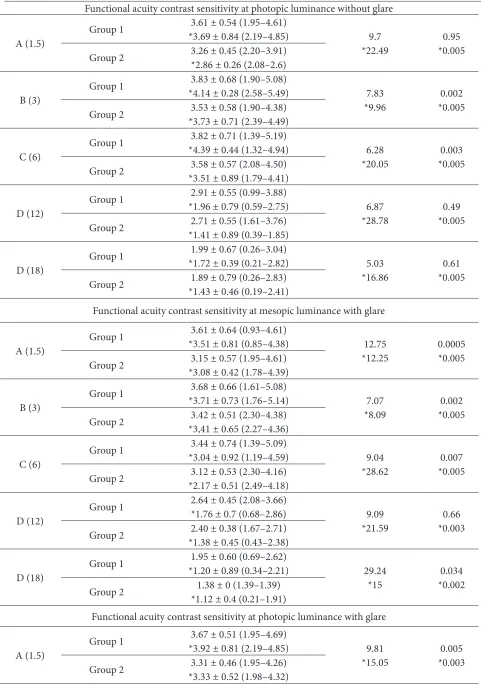
Results. The nighttime results without glare in group 2 were worse at 1.5, 3, 6 and 18 cycles per degree of the visual angle, the day-time results without glare were worse at 3 and 6 cycles per degree. The nighttime results with glare were worse at 1.5, 3, 6 and 18 cycles per degree, and the daytime results with glare were worse at 1.5 and 3 cycles per degree. Results after adjusting for age and visual acuity to 1.0 in the group 1 patients were better compared to the group 2 patients and the p value was 0.0005.
Conclusions. The test results in patients with early intermedi-ate age-relintermedi-ated macular degeneration, in comparison to early mild age-related macular degeneration, showed a significant decrease mostly in the nighttime either with or without glare in high and me-dium spatial frequencies (cycles/degree). After adjusting for age and visual acuity the FACT results were even worse in early intermediate AMD patients.
BACKGROUND
Age-related macular degeneration (AMD) affects the macula and is a leading cause of significant and irreversible loss of central visual acuity. AMD is the most common cause of visual loss in persons aged over 60 in developed countries (1). Population estimates have placed the prevalence of AMD ap-proximately from 7 to 10% in adults aged between 40 and 90 years (2–6). More than 30% of adults >75 years of age have AMD; in ~6–8% of these individ-uals, the disease progresses, causing the most severe degree of visual loss (3). The numbers of persons with AMD are expected to double between 2000 and 2030 (4). However, the aetiology of this con-dition remains unclear and treatment options are limited. AMD is a multifactorial etiology disease, the development of which is determined by en-vironmental risk and genetic factors (7). Risk fac-tors such as age, gender, cigarette smoking, colour of the iris, nutrition, body mass index, oxidative stress, inflammatory process, and genetic factors and their interrelationship may influence the de-velopment of age-related macular degeneration. For a detailed visual examination, various functions are tested, such as cognitive perception and the cen-tral processing function. Studies have shown that the assessment of visual acuity tested by the typical Snellen chart using the Landolt rings (C optotypes) alone is insufficient for visual function testing, be-cause it provides limited information about the cen-tral vision, and it is necessary to determine not only the visual acuity but also the contrast sensitivity (8). Contrast sensitivity is an important measurement of visual function in patients with AMD, and visual acuity together with contrast sensitivity might pro-vide complementary (9) and valuable information about visual function (10–12).
AMD includes early and advanced stages.Early AMD consists of a combination of multiple small drusen and several intermediate (63–124 μm dia-meter) drusen, or retinal pigment epithelial abnor-malities; intermediate AMD is characterized by the presence of extensive intermediate drusen and at least one large giant druse (≥125 μm diameter), or geographic atrophy (GA) not involving the cen-tre of the fovea (13).
So, the aim of this research is to assess the scores of contrast sensitivity in patients with early mild and early intermediate age-related macular
degen-eration, and also to compare results after adjusting for age and visual acuity to 1.0 in patients with early mild and early intermediate AMD.
MATERIALS AND METHODS
Of the 410 AMD patients who had visited the De-partment of Ophthalmology at the Lithuanian Uni-versity of Health Sciences during the period of 2nd January 2009 to 20th December 2012, and agreed to participate in this ophthalmologic study, 109 (217 eyes) patients were enrolled in further anal-ysis according to the subject inclusion and exclu-sion criteria. Patients were divided into two groups acording to the Age-Related Eye Disease Study clas-sification: early mild AMD (group 1), and early in-termediate AMD (group 2).
Having obtained Permission No. BE-2-14 from the Kaunas Regional Biomedical Research Ethics Committee, the study was conducted in the De-partment of Ophthalmology, Lithuanian University of Health Sciences.
The exclusion criteria for subjects were the fol-lowing: (i) unrelated eye disorders, e. g. high refrac-tive error, cloudy cornea, lens opacity except minor opacities (nuclear, cortical, or posterior subcapsu-lar cataract), keratitis, acute or chronic uveitis, glau-coma, or diseases of the optic nerve; (ii) systemic illnesses, e. g. diabetes mellitus, malignant tumors, systemic connective tissue disorders, chronic in-fectious diseases, or conditions following organ or tissue transplantation; (iii) ungraded colour fundus photographs resulting from obscuration of the oc-ular optic system or because of fundus photograph quality; (iv) patients whose functional acuity con-trast sensitivity test values were 0.
The inclusion criteria for subjects were as fol-lows: (i) patients aged ≥50 of both genders, diag-nosed with early mild or early intermediate AMD in whom no other eye disorders were found on detailed ophthalmologic examination; (ii) the di-agnosis confirmed by colour fundus photography; (iii) participation consent.
subjects were evaluated by slit-lamp biomicroscopy to assess corneal and lenticular transparency. For a detailed evaluation of the macula, stereoscopic colour fundus photographs of the macula, centered at 45° and 30° to the fovea, were obtained.
The classification system of AMD formulat-ed by the Age-Related Eye Disease Study (13) was used: early mild AMD consisting of a combination of multiple small drusen and several intermediate drusen (63–124 μm diameter), or retinal pigment epithelial abnormalities; early intermediate AMD characterized by the presence of extensive inter-mediate drusen and at least one large giant druse (≥125 μm diameter), or geographic atrophy (GA) not involving the centre of the fovea; and advanced stage AMD was characterized by GA involving the fovea and/or any of the features of neovascu-lar AMD (13). Diagnosis of early mild stage AMD was made if confirmed by two ophthalmologists and by one ophthalmological technician, and if no other eye disorders were found during a detailed ophthalmological examination. All patients’ fun-dus photography was also analysed by a genetic opthalmologist, and in some cases genetic research was done to avoid inherited macular dystrophies. Optical coherence tomography(OCT) was per-formed on all AMD patients, and fluorescence an-giography was performed on patients where there was a suspicion of advanced AMD after the OCT examination. Advanced AMD was diagnosed in two patients and these patients were excluded from further study. Five patients were excluded from this study because inherited macular dystro-phies were suspected.
DIGITAL ANALYSIS OF RETINAL IMAGES WAS EMPLOYED TO LOCATE DRUSEN IN THE RETINA AND TO MEASURE THEIR DIAMETERS
For retina drusen localization and drusen diame-ter measurement a digital analysis was used (14). A standard mobile grating comprised of three con-centric circles with diameters of 1 000, 3 000 and 6 000 μm was used for measurements. A real drus-en diameter was estimated according to the aver-age diameter of the optic nerve disc, and having calculated a coefficient which allowed computing the distances in digital pictures of the ocular fun-dus in microns (14).
The estimations of the real calculated diameter of the drusen in the digital picture:
– according to the diameter average of the optic nerve disc (1 500 μm), a coefficient k was de-fined which allowed computing the distances in a digital picture of the ocular fundus in microns: k = ϕ˳/Ɩ˳, where ϕ˳ is the known diameter of the optic nerve disc (μm), Ɩ˳ is the diameter of the optic nerve disc computed in the digital photo-graph and expressed in points;
– the estimated diameter of the drusen in the digital photograph Ɩd, expressed in points; – the real calculated diameter of the drusen ϕd, (μm):
ϕd = Ɩd k (14).
Contrast sensitivity was measured employing a Ginsburg Box, VSCR- CST-6500 with a Functional Acuity Contrast Test chart at photopic (85 cd/m) and mesopic (3 cd/m) luminance with and without glare at five standard spatial frequencies: 1.5; 3; 6; 12; 18 cycles per degree of the visual angle (15). The log of the obtained values was taken to obtain the contrast sensitivity values. A difference level of 0.15 log unit between the test at given spatial frequency was se-lected to determine clinical significance. Functional acuity contrast sensitivity was performed in the case of the best-corrected visual acuity.
A statistical analysis was performed using the computer program SPSS/W 13.0 (Social Sciences Statistical Package Program for Windows, Inc., Chicago, Illinois, USA). The data are present-ed as real numbers (per cent), the average values and standard deviations. In order to determine the difference between two independent groups, the Mann–Whitney U criterion was used. The c2
test was used for comparing frequencies of quali-tative variables. A statistically significant difference was considered if p < 0.05.
RESULTS
50 to 93 years. The group 2 patients were statis-tically significantly older. The results of the study show that the visual acuity in group 1 was signifi-cantly higher than that in group 2 (Table 1).
Our results revealed that in patients with early intermediate age-related macular degeneration, in comparison to early mild age-related macular degeneration, the subjects showed a significant decrease in all spatial frequencies, except in 12 cy-cles per degree of the visual angle, and it decreased
Table 1. The contingent/factor of the groups 1 and 2 patients
Contingent/factor Group 1 patients, n = 79 (158 eyes) (early AMD) (59 eyes) (intermediate AMD)Group 2 patients, n = 30 p value
Males, n (%) 24 (30.2) 9 (29.1) DSI
Females, n (%) 55 (69.8) 21 (70.9) DSI
Age ± SD 62.85 ± 11.88 72.15 ± 9.93 0.047
Non-corrected visual acuity ± SD 0.53 ± 0.35 0.39 ± 0.32 0.014
Best-corrected visual acuity ± SD 0.82 ± 0.26 0.64 ± 0.31 0.0005
SD is standard deviation; DSI is difference statistically insignificant; p value is significance level.
from 5.58 to 29.24%. It is very interesting that the nighttime results without glare and with glare in 12 cycles per degree decreased by 23.42 and 29.24%, respectively. The daytime results without glare decreased only in medium spatial frequen-cies (3 and 6 cycles per degree), and the daytime results with glare decreased at low (1.5 cycles per degree) and at medium (3 cycles per degree) fre-quencies. The daytime results with and without glare were worse from 2.08 to 9.81% (Table 2).
Table 2. The results of functional acuity contrast sensitivity test (FACT) in groups 1 and 2 and the comparison of the results between groups 1 and 2 in time/per cent
Spatial
frequencies AMD form FACT results mean ± SD (minimum/maximum) Decrease between groups in per cent P value Functional acuity contrast sensitivity at mesopic luminance without glare
A (1.5)
Group 1 *3.71 ± 0.92 (0.76–5.52)3.61 ± 0.65 (1.10–4.61) 11.92
*19.41 *0.0050.005 Group 2 *2.99 ± 1.22 (0.95–5.88)3.18 ± 0.48 (2.12–4.26)
B (3)
Group 1 *4.62 ± 1.23 (1.58–5.41)3.78 ± 0.69 (1.90–5.08) 10.85
*25.11 *0.0050.005 Group 2 *3.46 ± 0.59 (1.21–4.94)3.37 ± 0.56 (2.30–4.74)
C (6) Group 1
3.41 ± 0.78 (1.39–4.86)
*3.45 ± 1.38 (1.22–4.58) 11.74
*27.83 *0.0050.015 Group 2 *2.49 ± 1.77 (0.89–3.85)3.01 ± 0.84 (1.39–4.23)
D (12) Group 1
2.69 ± 2.69 (0.99–3.76)
*1.91 ± 0.65 (0.52–2.75) 5.58
*20.95 *0.0040.849 Group 2 *1.51 ± 0.62 (0.34–1.56)2.54 ± 0.63 (2.08–3.76)
D (18) Group 1
1.58 ± 0.53 (0.26–2.08)
*1.24 ± 0.29 (0.19–1.49) 23.42
Table 2 (continued)
Functional acuity contrast sensitivity at photopic luminance without glare
A (1.5) Group 1
3.61 ± 0.54 (1.95–4.61)
*3.69 ± 0.84 (2.19–4.85) 9.7
*22.49 *0.0050.95 Group 2 3.26 ± 0.45 (2.20–3.91)*2.86 ± 0.26 (2.08–2.6)
B (3) Group 1
3.83 ± 0.68 (1.90–5.08)
*4.14 ± 0.28 (2.58–5.49) 7.83
*9.96 *0.0050.002 Group 2 *3.73 ± 0.71 (2.39–4.49)3.53 ± 0.58 (1.90–4.38)
C (6) Group 1
3.82 ± 0.71 (1.39–5.19)
*4.39 ± 0.44 (1.32–4.94) 6.28
*20.05 *0.0050.003 Group 2 *3.51 ± 0.89 (1.79–4.41)3.58 ± 0.57 (2.08–4.50)
D (12) Group 1
2.91 ± 0.55 (0.99–3.88)
*1.96 ± 0.79 (0.59–2.75) 6.87
*28.78 *0.0050.49 Group 2 *1.41 ± 0.89 (0.39–1.85)2.71 ± 0.55 (1.61–3.76)
D (18) Group 1
1.99 ± 0.67 (0.26–3.04)
*1.72 ± 0.39 (0.21–2.82) 5.03
*16.86 *0.0050.61 Group 2 *1.43 ± 0.46 (0.19–2.41)1.89 ± 0.79 (0.26–2.83)
Functional acuity contrast sensitivity at mesopic luminance with glare
A (1.5) Group 1
3.61 ± 0.64 (0.93–4.61)
*3.51 ± 0.81 (0.85–4.38) 12.75
*12.25 0.0005*0.005 Group 2 *3.08 ± 0.42 (1.78–4.39)3.15 ± 0.57 (1.95–4.61)
B (3)
Group 1 *3.71 ± 0.73 (1.76–5.14)3.68 ± 0.66 (1.61–5.08) 7.07
*8.09 *0.0050.002 Group 2 *3,41 ± 0.65 (2.27–4.36)3.42 ± 0.51 (2.30–4.38)
C (6)
Group 1 *3.04 ± 0.92 (1.19–4.59)3.44 ± 0.74 (1.39–5.09) 9.04
*28.62 *0.0050.007 Group 2 *2.17 ± 0.51 (2.49–4.18)3.12 ± 0.53 (2.30–4.16)
D (12)
Group 1 2.64 ± 0.45 (2.08–3.66)*1.76 ± 0.7 (0.68–2.86) 9.09
*21.59 *0.0030.66 Group 2 *1.38 ± 0.45 (0.43–2.38)2.40 ± 0.38 (1.67–2.71)
D (18)
Group 1 *1.20 ± 0.89 (0.34–2.21)1.95 ± 0.60 (0.69–2.62) 29.24
*15 *0.0020.034 Group 2 *1.12 ± 0.4 (0.21–1.91)1.38 ± 0 (1.39–1.39)
Functional acuity contrast sensitivity at photopic luminance with glare
A (1.5) Group 1
3.67 ± 0.51 (1.95–4.69)
*3.92 ± 0.81 (2.19–4.85) 9.81
The results after adjusting for age and visual acu-ity to 1.0 in the group 1 patients were better com-pared to those of the results of group 2 and the p val - ue was 0.0005 as shown in Table 2. The nighttime re-sults without and with glare were worse in all spatial frequencies, and decreased from 8.09 to 28.62%, and the daytime results without glare and with glare were worse from 9.96 to 28.78%.
DISCUSSION
There are no studies comparing functional acu-ity contrast sensitivacu-ity changes in these two early AMD forms. Our results revealed that in patients with early intermediate age-related macular degen-eration, in comparison to early mild age-related macular degeneration, subjects’ nighttime results without and with glare showed a significant decrease in all spatial frequencies, except in 12 cycles per de-gree of the visual angle, and it decreased from 5.58 to 29.24%, respectively. The daytime results with and without glare were worse from 2.08 to 9.81%. It appears that contrast sensitivity is the best test for quantifying early changes in the visual function, be-cause our results show that this test can detect even slight changes of visual system performance, and visual functions are mostly impaired at nighttime with and without glare. The results after adjusting for age and visual acuity to 1.0 in the group 1 pa-tients were better compared to those of the group 2
patients and the p value was 0.0005 as shown in Ta-ble 2. The nighttime results without and with glare were worse in all spatial frequencies, which means when we are trying to avoid the visual acuity role in FACT decreasing, it can be seen that the results are worse because of early intermediate AMD com-pared to early mild AMD.
There are not many studies analyzing FACT re-sults, changes in age-related macular degeneration especially in its early stages separately, and results analyzing contrast sensitivity in AMD patients are inconsistent. Some authors have suggested that functional acuity contrast sensitivity is dimin-ished (lower) in high spatial frequencies in AMD patients (16, 17), while the others having detect-ed such changes in both mdetect-edium and high spatial frequencies (18, 19), as we found in our study of patients with early intermediate AMD. Segato et al. reported that functional contrast sensitivity is low-er in all spatial frequencies in patients with early age-related macular degeneration (20). In a study by Žaliūnienė et al. it was assessed that contrast sensitivity at mesopic luminance or at photopic lu-minance in patients aged 60 years and older with an early mild and early intermediate AMD with or without glare was found to be more dependent on cataracts as opposed to AMD. As Žaliūnienė re-ported, the results of functional acuity contrast sen-sitivity testing were found to be better in AMD pa-tients compared to those who were diagnosed with
Table 2 (continued)
B (3) Group 1
3.97 ± 0.53 (2.30–5.08)
*4.48 ± 0.52 (3.12–5.41) 7.56
*10.05 0.0014*0.005 Group 2 3.67 ± 0.71 (1.19–4.43)*4.36 ± 0.81 (1.94–4.7)
C (6) Group 1
3.84 ± 0.70 (1.39–5.19)
*4.11 ± 0.54 (1.79–5.32) 2.08
*25.55 *0.0050.119 Group 2 3.76 ± 0.45 (2.71–4.50)*3.96 ± 0.21 (1.41–5.2)
D (12) Group 1
3.13 ± 0.54 (1.61–4.09)
*2.88 ± 0.57 (1.53–3.93) 4.79
*25.69 *0.0050.112 Group 2 *2.14 ± 0.67 (1.48–3.56)2.98 ± 0.50 (2.08–4.09)
D (18) Group 1
2.17 ± 0.53 (0.99–3.50)
*1.79 ± 0.47 (0.69–2.48) 6.45
*14.44 *0.0010.192 Group 2 *1.51 ± 0.54 (0.45–2.31)2.03 ± 0.60 (0.99–2.83)
cataracts or with both cataracts and AMD (21, 22). Žaliūnienė et al. results showed that following sur-gical treatment contrast sensitivity at photopic and mesopic luminance with or without glare improved in cataract patients and in patients with both cata-racts and AMD (21). However, contrast sensitivity remained minimal in patients diagnosed with both illnesses. This could be explained by the higher in-fluence of cataracts on the decrease in contrast sen-sitivity in comparison to the decrease in the visual acuity (21). To check this hypothesis it was decided to compare these two groups with early mild AMD patients with normal visual acuity, but the results were even worse in patients with early intermediate AMD.
It should be noted that the prognostic value of visual acuity is better in AMD patients whose con-trast sensitivity is less affected or intact in compar-ison to other patients whose contrast sensitivity is worse (23). Moreover, for AMD patients treatments with vascular endothelial growth factor inhibitors, as well as both photodynamic therapy and laser pho-tocoagulation were found to be more effective only if contrast sensitivity is less affected (24). It should also be noted that early diagnosis of AMD can help prevent blindness in the future and functional acuity contrast sensitivity might be useful for early detec-tion of the age-related macular progress in the ab-sence of clinical changes in fundus when compared to previous fundus photography. Haegerstrom-Port-noy’s results demonstrate that low contrast vision functions can successfully predict subsequent loss of high contrast visual acuity (25).
The facts are that contrast sensitivity is affected more in patients with early intermediate age-re-lated macular degeneration, especially at mesopic luminance with and without glare, but the main limitation of this study was a relatively small sam-ple size. In group 2, especially when adjusted for age and visual acuity, it was very difficult to find persons with early intermediate AMD and visual acuity 100%. These results need to be confirmed in a large-scale cohort study involving patients with early mild and early intermediate AMD.
CONCLUSIONS
The test results in patients with early intermediate age-related macular degeneration, in comparison to early mild age-related macular degeneration,
showed a significant decrease mostly in the night-time results either with or without glare in high and medium spatial frequencies (cycles per degree), after adjusting age and visual acuity. The FACT re-sults were even worse in early intermediate AMD patients.
Received 7 December 2015 Accepted 14 December 2015
References
1. Klein R, Peto T, Bird A, Vannewkirk MR. The ep-idemiology of age-related macular degeneration. Am J Ophthalmol. 2004; 137: 486–95.
2. Friedman DS, O’Colmain BJ, Munoz B, Toma-ny SC, McCarty C, de Jong PT, et al. Prevalence of age-related macular degeneration in the United States. Arch Ophthalmol. 2004; 122(4): 564–72. 3. Duan Y, Mo J, Klein R, Scott IU, Lin HM,
Caul-field J, et al. Age-related macular degeneration is associated with incident myocardial infarction among elderly Americans. Ophthalmol. 2007; 114: 732–73.
4. Cimbalas A, Paunksnis A, Černiauskienė LR, Do-markienė S. Prevalence and risk factors of age-re-lated macular degeneration. Medicina (Kaunas). 2004; 39(12): 37–43.
5. Klein R, Klein BE, Tomany SC, Meuer SM, Hu-ang GH. Ten-year incidence and progression of age-related maculopathy: The Beaver Dam eye study. Ophthalmol.2002; 109(10): 1767–79. 6. Neverauskienė J, Chaleckienė G, Baniulienė D,
Ka-lasauskienė A. Blindness incidence in Lithuania. 2003.
7. Liutkevičienė R, Lesauskaitė V, Ašmonienė V, Ža-liūnienė D, Jašinskas V. Factors determing age-re-lated mcular degeneration: a current view. Medici-na (KauMedici-nas). 2010; 46(2): 89–94.
8. Ginsburg AP. Contrast sensitivity: determining the visual quality and function of cataract, intra-ocular lenses and refractive surgery. Curr Opin Ophthalmol. 2006; 17(1): 19–26.
10. Rubin GS, Bandeen-Roche K, Huang GH, Muñoz B, Schein OD, Fried LP, West SK. The as-sociation of multiple visual impairments with self-reported visual disability: SEE project. Invest Ophthalmol Vis Sci. 2001; 42: 64–72.
11. Arden GB. The importance of measuring contrast sensitivity in cases of visual disturbance. Br J Oph-thalmol.1978; 62: 198–209.
12. Rubin GS, Roche KB, Prasada-Rao P, Fried LP. Visual impairment and disability in older adults.
Optom Vis Sci.1994; 71: 750–60.
13. The Age-Related Eye Disease Study Research Group. The Age-Related Eye Disease Study sys-tem for classifying age-related macular degenera-tion from stereoscopic color fundus photographs: AREDS Report Number 6. Am J Ophthalmol. 2001; 132: 688–1.
14. Moitinho F, Mora A, Vieira P, Fonseca J. A Drusen volume quantification method based on a segmen-tation algorithm In: VIP Image – Proceedings of the ECCOMAS Thematic Conference on Com-putational Vision and Medical Image Processing. Porto, Portugal: University of Porto; 2007.
15. Ginsburg AP. Contrast sensitivity and functional vision. Int Ophthalmol Clin. 2003; 43(2): 5–16. 16. Kleiner RC, Enger C, Alexander MF, Fine SL.
Con-trast sensitivity in age-related macular degenera-tion. Arch Ophthalmol. 1988; 106(1): 55–7. 17. Brown B, Lovie-Kitchin J. Contrast sensitivity in
Central and Paracentral Retina in Age Related Mac-ulopathy. Clin Exp Optom. 1987; 70(5): 145–8. 18. Stangos N, Voutas S, Topouzis F, Karampatakis V.
Contrast sensitivity evaluation in eyes predisposed to age-related macular degeneration and
present-ing normal visual acuity. Ophthalmologica. 1995; 209(4): 194–8.
19. Valberg A, Per Fosse M. Loss of chromatic contrast sensitivity at low spatial frequencies in subjects
with age-related macular degeneration. Eye. 2005; 19(11): 1142–50.
20. Midena E, Degli Angeli C, Blarzino MC, Valenti M, Segato T. Visual function impairment in eyes with early age-related macular degeneration (AMD). Invest Ophthalmol Vic Sci. 1994; 35: 1054–65. 21. Žaliūnienė D, Glebauskienė B, Liutkevičienė R,
Špečkauskas M. A comparison of visual acuity and contrast sensitivity in patients with cataract and age-related macular degeneration implanted with foldable or rigid intraocular lenses. Medicina (Kaunas). 2006; 42(12): 975–82.
22. Zaliuniene D, Paunksnis A, Gustiene O, Brazdzio-nyte J, Zaliunas R. Pre- and postoperative C-re-active protein levels in patients with cataract and age-related macular degeneration. Eur J Ophthal-mol. 2007; 17(6): 919–27.
23. Alexander MF, Maguire MG, Lietman TM, Sny-der JR, Elman MJ, Fine SL. Assessment of visual function in patients with age-related macular de-generation and low visual acuity. Arch Ophthal-mol. 1988; 106(11): 1543–47.
24. Mones J, Rubin GS. Contrast sensitivity as an out-come measure in patients with subfoveal choroidal neovascularisation due to age-related macular de-generation. Eye. 2005; 19: 1142–50.
Rasa Liutkevičienė, Rasa Čiumbaraitė, Mantas Banevičius
FUNKCINIO KONTRASTINIO JAUTRUMO PALYGINIMAS TARP PACIENTŲ, SERGANČIŲ PRADINE LENGVA IR PRADINE VIDUTINE AMŽINE GELTONOSIOS DĖMĖS
DEGENERACIJA, SUVIENODINUS GRUPES PAGAL AMŽIŲ IR REGĖJIMO AŠTRUMĄ
Santrauka
Įvadas. Kontrastinis jautrumas gali suteikti vertingos informacijos apie regėjimo funkciją kaip papildomas ty-rimas po regos aštrumo įvertinimo. Kai kurie pacientai, pasižymintys geru regėjimo aštrumu, skundžiasi prastu regėjimu. Tokiems pacientams turėtų būti tiriamos ir kitos regėjimo funkcijos, pavyzdžiui, funkcinis kontras-tinis jautrumas.
Metodika. Ištyrėme pacientus, sergančius pradine lengva amžine geltonosios dėmės degeneracija (I grupė), ir pacientus, sergančius pradine vidutine amžine geltono-sios dėmės degeneracija (II grupė).
Drūzų lokalizacija ir drūzų skersmuo buvo nusta-tyti taikant tinklainės drūzų lokalizacijos, jų skers-mens matavimo bei šių vaizdų skaitmeninės analizės metodiką. Funkcinis kontrastinis jautrumas tirtas
pa-gal Arthuro P. Ginsburgo metodiką OPTEC 65VSCR- CST-6500 aparatu.
Rezultatai. II grupės pacientų rezultatai buvo blo-gesni nakties metu be akinančios šviesos esant 1,5; 3; 6; 18 erd viniams dažniams ir dienos metu be akinan-čios šviesos esant 3 ir 6 erdviniams dažniams. Nakties sąlygomis rezultatai buvo blogesni su akinančia šviesa esant 1,5; 3; 6 ir 18 erdviniams dažniams ir dienos są-lygomis su akinančia šviesa esant 1,5 ir 3 erdviniams dažniams. Atrinkus pacien tus pagal amžių ir regos aštrumą – p = 1,0; I grupės rezultatai buvo geresni už II grupės rezultatus (p = 0,0005).
Išvada. Rezultatai rodo, kad pacientų, sergančių pra-dine lengva amžine geltonosios dėmės degeneracija, pa-lyginti su pacientais, sergančiais pradine vidutine amžine geltonosios dėmės degeneracija, funkcinio kontrastinio jautrumo rezultatai statistiškai reikšmingai sumažėjo la-biausiai nakties metu su akinančia šviesa ir be akinančios šviesos esant aukštiems ir vidutiniams erdviniams daž-niams (ciklai / laipsnis). Suvienodinus grupes pagal am-žių ir regėjimo aštrumą, funkcinio kontrastinio jautrumo rezultatai vis tiek buvo blogesni sergant pradine vidutine amžine geltonosios dėmės degeneracija.