Published online March 10, 2015 (http://www.sciencepublishinggroup.com/j/ajtas) doi: 10.11648/j.ajtas.s.2015040201.12
ISSN: 2326-8999 (Print); ISSN: 2326-9006 (Online)
Performance analysis of powers of skewness and kurtosis
based multivariate normality tests and use of extended
Monte Carlo simulation for proposed novelty algorithm
Vishwa Nath Maurya
1, Ram Bilas Misra
2, Chandra K. Jaggi
3, Avadhesh Kumar Maurya
41
Department of Pure & Applied Mathematics and Statistics, School of Science & Technology, The University of Fiji, Lautoka, Fiji Islands
2
Division of Applied Mathematics, State University of New York, Incheon, Republic of Korea & Ex-Vice Chancellor, Dr. R. M. L. Avadh University, Faizabad, UP, India
3
Department of Operations Research, University of Delhi, New Delhi, India
4
Department of Electronics & Communication Engineering, Lucknow Institute of Technology, U. P. Technical University, Lucknow, India
Email address:
[email protected] (V. N. Maurya), [email protected] (V. N. Maurya), [email protected] (A. K. Maurya)
To cite this article:
Vishwa Nath Maurya, Ram Bilas Misra, Chandra K. Jaggi, Avadhesh Kumar Maurya. Performance Analysis of Powers of Skewness and Kurtosis Based Multivariate Normality Tests and Use of Extended Monte Carlo Simulation for Proposed Novelty Algorithm. American Journal of Theoretical and Applied Statistics. Special Issue: Scope of Statistical Modeling and Optimization Techniques in Management Decision Making Process. Vol. 4, No. 2-1, 2015, pp. 11-18. doi: 10.11648/j.ajtas.s.2015040201.12
Abstract:
An ample study of the comparative powers of a number of omnibus multivariate normality tests is main object in this paper. Since testing for multivariate normality tests is considerably more challenging process than for testing of univariate one and therefore, study of testing for multivariate normality tests has its increasing demand. Through this paper, we have explored several techniques for assessing multivariate normality (MVN) and as well as comparative analysis for their competence have also been demonstrated. The results of extensive Monte Carlo simulation study of the size corrected power of various tests of multivariate normality for drawn samples from contaminated normal distributions have been explored as well. Moreover, a novel algorithm has been proposed in order to evaluate the size corrected powers for testing multivariate normality. The algorithm proposed herein is a fast easily implementable algorithm and it can be applied for both types of univariate and multivariate normality tests. Using Different omnibus tests for sample size 50 and 200, graphs for empirical powers of multivariate normal data with lower and upper contamination have been presented. Finally, some significant conclusions of our present study have been drawn.Keywords:
Multivariate Normality Tests, Goodness-of-Fit Tests, Correlation Coefficient, Skewness, Kurtosis, Monte Carlo Simulation Technique1. Introduction
In statistics, multivariate normality tests are used for checking a given set of data for similarity to the multivariate normal distribution. Multivariate normality test is a fundamental predicament in statistics. The null hypothesis is that the data set is similar to the normal distribution; therefore a sufficiently small p-value indicates non-normal data. Though, the rigorous study of literature shows that since last six decades number of researchers contributed for various methods for assessing multivariate normality (MVN). Among these, here some noteworthy researchers Anscombe and Glynn [1], Bera [2], Bowman and Shenton [3], D'Agostino [7], Grianadesikan [11], Inhof [12], Kaziol [17],
the art is not developed as well. Most of the multivariate normality test procedures are extensions of univariate normality tests. The accessible tests of multivariate normality can be categorically described as following:
Procedures based on graphical plots and correlation coefficients
Goodness-of-fit tests
Tests based on measures of skewness and kurtosis Consistent procedures based on the empirical characteristic function.
In this paper, our main objective is to develop an implementable algorithm to calculate size corrected powers of competitive MVN tests that can be used to compare the efficiency of various multivariate normality tests. The organization of the paper is as follows. Section 2 discusses our emphasized tests for assessing MVN. In section 3, we describe comparative study of various multivariate normality tests. Section 4 concerns with a novel algorithm for multivariate normality tests and its empirical results have been explored by using an extended Monte Carlo simulation. Moreover, purpose of present study and its future scope is highlighted in section 5. By the end of paper, some valuable conclusive remarks have been drawn in section 6.
2. Literature Review
Rigorous study of literature shows that there is no shortage of methods for assessing multivariate normality (MVN). Among abundant available tests for testing MVN, here we stress only those multivariate normality tests which are mainly based on skewness and kurtosis. Numerous omnibus tests based on skewness, kurtosis are proposed by D'Agostino & Pearson [5], Bowman and Shenton [3], Pearson et al. [38], D'Agostino et al. [6], Loony [18], and the coordinate-dependent and invariant procedures described by Cox & Small [4] and Small [43] offers an overall test of multivariate normality that are quadratic forms involving multivariate normality tests explored by Mardia and Foster [20], Mardia [21,22] and Johnson’s (1949) Su transformation on a vector of the marginal skewness or kurtosis statistics. Mardia [22] developed multivariate extensions of multivariate skewness and kurtosis. The measures derived by Mardia [22] are affine invariant. The sample statistic for multivariate skewness is given as following:
(
) (
)
31 1
1 2
, 1
1
∑ ∑
= =
−
−
′
−
=
ni n
j
j i
p
y
y
S
y
y
n
b
And the corresponding sample statistic for kurtosis is as following:
(
) (
)
21
1 ,
2
1
∑
=
−
− ′
−
= n
i
i i
p y y S y y
n b
Here, we remark that skewness and kurtosis functions explored by Mardia [22] are functions of the squared Mahalanobis distances. This fact makes Mardia’s measures,
particularly the multivariate kurtosis measure, useful in multivariate outlier detection. We further remark that Mardia [21,22] determined the asymptotic distributions of the multivariate skewness and kurtosis statistics. However, Mardia's kurtosis statistic is skewed and converges very slowly to the limiting normal distribution. For medium size samples, the parameters of the asymptotic distribution of the kurtosis statistic are modified. For small sample tests empirical critical values are used. Tables of critical values for both statistics are given by Rencher [39] for k = 2,3,4. It can be further examined that Mardia's [22] multivariate normality tests are affine invariant but not consistent. For example, the multivariate skewness test is not consistent against symmetric non-normal alternatives.
If we consider A=nb1,p 6, it can be shown that A is asymptotically distributed as a chi-square random variable with p
(
p+1)(
p+2)
6 degrees of freedom. Similarly, the statistic B=[
b2,p − p(
p+2)
]
8p(
p+2)
nis asymptoticallydistributed as a standard normal random variable. The asymptotic distributions of functions of the multivariate skewness and kurtosis statistics were exploited by Mardia [20,21,22] to develop two tests for the multivariate normality.
Moreover, some other tests of MVN based on W-statistic were proposed by Malkovich and Afifi [19] presented a test based on Roy’s [41] union-intersection principle that utilized generalized measures of skewness and kurtosis. Subsequently, Isogai [13] introduced another measure of multivariate skewness to test of MVN and Isogai [14] used influence functions to develop two test statistics for MVN that was mostly related to Mardia’s measure of multivariate skewness.
Sample measures of multivariate skewness and kurtosis proposed by Srivastava [45] based on principal components have been discussed by number of previous researchers and using the measures of multivariate skewness and kurtosis calculated with the principal components method., they succeeded to find their research works in this direction which were very similar to Mardia [21,22]. Okamoto and Seo [36] derived the exact expectation and variance of Srivastava’s skewness and improvedχ2statistic defined by Srivastava [45] for assessing multivariate normality. Mardia and Foster [20] constructed six possible omnibus test statistics, three of which did consider the covariance between skewness and kurtosis. D’Agostino and Pearson [5] proposed an omnibus test based on the distributions of the standardized third and
fourth moments, 2
2 4 2 3 2 2 3
1 m m , b m m
b = = in random
samples of n observations from a univariate normal population. Here for a sample having its n-sample points
n
X X
X1, 2,…, , we define as following:
( )
∑
== n
i Xi
n
X 1 1
( )
1(
)
,1
r n
i i
r n X X
m =
∑
= −.
4
,
3
,
2
=
r
Jarque and Bera’s [15] test statistics using Srivastava’s [45] sample skewness and kurtosis which are asymptotically distributed as χ2-distribution were proposed by Koizumi et al.
have been discussed by many authors. A popular test of normality based on D'Agostino-Pearson 2
K statistic that combines these two statistics
1
b and b2 discussed in
D'Agostino, et al. [6]. Normalizing transformation for the skewness b1 into
z
1is as in D’Agostino [7] and another transformation for the kurtosis b2 intoz
2 based on the Wilson–Hilferty transformation as described in Doornik and Hansen [8]. The improved omnibus test was recently presented in Nakagawa et al. [35]. The above mentioned test statistics are all based on third and fourth sample moments.3. Compilation of Multivariate
Normality Tests
Numerous procedures have been proposed for assessing multivariate normality, some of them are discussed in the following paragraphs.
3.1. The Multivariate Jarque-Bera Test
In view of Enomoto et al. [9], let X1,X2,…,Xnbe samples
of size N from a univariate population. Now, if we consider
that
∑
= −
= n
i Xi
n
X 1 1 and
(
)
2 1 1 2∑
= − − = ni Xi X
n
S be the
sample mean and the sample covariance respectively. Then the univariate sample skewness is given by following equations: 2 2 4 2 3 2 2 3
1 m m , b m m
b = =
Where,
(
)
,1
1 n r
i i
r n X X
m = −
∑
= −Then Jarque and Bera [15] proposed the test statistic using univariate sample skewness and kurtosis for normality test is given by
( )
(
)
. 24 3 6 2 2 2 1 − += n b b
JB
It holds that JB statistic is asymptotically distributed as 2 2
χ distribution under normality.
On the other hand, Koizumi et al.[16] proposed multivariate Jarque and Bera test statistics as follows:
(
)
(
)
, 24 3 6 2 1 2 , 2 2 , 1 ∞ → → − += + N
b b np MJB p p p
χ
[ ]
(
[ ]
[ ]
)
21(
)
,
, 2 2 , 2 , 2 2 , 1 2 ,
1
+
−
→
→
∞
=
+ ∗N
b
Var
b
E
b
b
E
pb
MJB
p p p p p pχ
respectively.MJB ∗statistic is improved so that accuracy of upper percentile for approximate test statistic is better than that of MJB statistic for small N. Where for large N, the expectation of 2
, 1p
b and variance of
p
b2, when the population is
( )
µ,Σ pN are given by
[ ]
2(
6(
1)(
2)
3)
,
1 + +
− = N N N b E p
[ ]
(
(
)
)
1 1 3 , 2 + − = N N b E p[ ]
(
(
) (
)(
)(
)
)
5 3 1 3 2 24 2 , 2 + + + − − = N N N p N N N b Var p3.2. Multivariate Extensions of Skewness and Kurtosis
Multivariate extensions of skewness and Kurtosis based on coefficients b1 and
b
2 respectively are described here proposed by Small [43]. Small proposes a measure of multivariate skewness that is defined by,
1 1 1 1 1 z U z
Q = ′ −
where
z
1 is the p×1vector of sample skewness coefficients after each has been normalized using Johnson's (1949) Sutransformation and U1 is an estimate of the correlation matrix of the components of
z
1. Small [43] suggests that oneuse 3 ,1 ,
1 r j k p
u jk = jk ≤ ≤ ≤ where
r
jk denotes thesample correlation between Xj and
k
X , for the elements of
1
U .
Similarly, Small [43] proposes a measure of multivariate kurtosis that is defined by following function:
,
2 1 2 2
2
z
U
z
Q
=
′
−where
z
2 is the vector of Sunormalized kurtosis coefficientsand the elements of U1 are given by p
k j r
u2jk = jk4,1≤ ≤ ≤ . Moreover, Small [43] recommended that a χ2
( )
papproximation should be used for the null distributions of Q1andQ2, and also affirmed that
this approximation is adequate for 2≤ p ≤8 as long as
29 ≥
n . Furthermore, Small [43] proposed that one may use 2
1
3 Q Q
Q = + for an omnibus test of the MVN assumption, and argued that a χ2
( )
2p distribution can be used toapproximate the null distribution ofQ3.
3.3. The Multivariate Omnibus Test
This method was proposed by Doornik and Hansen [8]. Let X′=
(
x1,…,xp)
be ap n
×
matrix ofn
observationson a
p
-dimensional vector with sample mean andcovariance
∑
= −
= n
i Xi
n X 1 1 and
(
−)(
−)
′ = −∑
= X X X X n S i n i1 i1 .
(
ˆ2, , ˆ2)
,1 p
diag
V = σ … σ and form the correlation matrix
. 2 1 2 1 − −
=V SV
C Define the
p n
×
matrix Y′=(
y1,…,yp)
of transformed observations:
( )
,
2 1 2 1x
x
V
H
H
y
i=
Λ
−′
− i−
with Λ =d ia g
(
λ1,…,λn)
,the matrix with the eigen values of C on the diagonal. The columns of H are the corresponding eigenvectors, such that H H′ =IP and Λ =H CH′ .Consequently n 1Y′Y = Ip.
− Using the population values for
C and V, a multivariate normal can thus be transformed into independent standard normal; using sample values this is only approximately so.
We may now compute univariate skewness and kurtosis,
defining
(
)
1 11, , 1p ,
B′ = b … b
(
)
2 21, , 2p
B′ = b … b and
l
as ap
−
vector of ones, the test statistic:(
B
l
) (
B
l
)
a
( )
p
n
B
nB
2
~
24
3
3
6
2 2 2 11
−
χ
′
−
+
′
will again require large samples.
3.4. Extension of Jarque–Bera Test
An extension of Jarque and Bera’s [15] test was proposed by Nakagawa et al. [35], wherein they proposed a new test statistic based on the Jarque–Bera’s [15] test. Let
n X X
X1, 2,…, be a sample drawn from a normal population.
Using b1 andb2, the test statistic is given by
( )
24
6
2 2 2 1b
b
T
=
+
It is clearly indicated that T is invariant under origin and scale changes. We only consider the case of a sample from a standard normal population as a null hypothesis.
3.5. Omnibus 2
K Statistic Test
This test was explored by D’Agostino et al. [6]. In this multivariate normality test, statistic z( b1) and z(b2) can
be combined to produce an omnibus test of normality. By omnibus, we mean it is able to detect deviations from normality due to either skewness or kurtosis. The test statistics is given as following:
) ( ) ( 2 2 1 2 2 b z b z
K = +
where z( b1) and z(b2) are the normal approximation to
1
b and b2.
3.6. Transformed Skewness and Kurtosis Test
The transformed skewness and kurtosis test was proposed by Doornik and Hansen [8]. Another omnibus test of
normality is presented combining statistic
z
1 andz
2. Letz
1and
z
2 denote the transformed skewness and kurtosis, respectively, where they are transformed in a way that makes their distribution as close to standard normal as possible. The test statistic is (‘ ’denotes ‘approximately distributed as’):= + 2
The transformation for the skewness is based on D’Agostino [7], who uses Johnson SU to approximate the distribution of
1
b . The kurtosis is transformed from a
gamma distribution to a χ2distribution with non-integer degrees of freedom, which is then translated into standard normal using the Wilson–Hilferty cubed root transformation.
3.7. Modified Multivariate Jarque-Bera Test
Multivariate Jarque-Bera test was modified by Koizumi et al. [16]. Let bM,1 and bM,2 be the sample measures of multivariate skewness and kurtosis, respectively, on the basis of a random sample of size N drawn from Np
(
µ,Σ)
,Σ >0. Then, it is fairly easy to get following expression:1 , 1 ,
6
M Mb
N
z
=
is asymptotically distributed as χ2 distribution with
(
+1)(
+2)
6= p p p
f degrees of freedom, and
(
)
(
(
1)
)
28 ,2
2
, = + b − p p+
p p
N
zM M
is asymptotically distributed as N(0, 1).
By making reference to moments of bM,1 and bM,2 , Mardia [21] considered the following approximate test statistics as competitors of
z
M,1andz
M,2 : A modified is given by equation:* 2 , * 1 , * M M
M
z
z
MJB
=
+
*
M
MJB is distributed as 2 1
+ f
χ distribution asymptotically. Where,
(
)(
)(
)
(
)(
)
{
}
2( 1)( 2)61 , * 1 , ~ 6 1 1 3 1 1
6 + + − + +
+ + +
= M p p p
M a p N N N N p b N z
χ
(
)(
) (
{
)
(
)(
)
}
(
2)(
3)(
1)(
1)
~( )
0,18
1 2 1
5
3 ,2
* 2
, a N
p N p N N p p N p p b N N N
zM M
+ − − − − + − + − + + + =
4. Proposed Algorithm and Key Features
the cases their suggested approach was either based on the percentage of rejection or location and scale parameter contamination whether by increasing or decreasing the parameter value but in practice these types of contaminations cannot make data non-normal. That’s why we are considering the characteristics of normal distribution i.e. skewness and kurtosis. By contaminating the upper and lower percentages of data, say 10%, 20% or more, we are making them highly skewed or asymmetric by multiplying with a increasing constant c where c =1,2,3,… when c =1 then it will
calculate the power of null hypothesis as the value of
c
will increase it will go far from the null which expresses the departure from normality.4.1. Algorithm and Hypothesis Testing
In power study, a common practise is to choose the one with the highest empirical power, when several testing procedures are considered. However, this usage is difficult in few cases, so a widely employed practice is to report what is called size corrected power that is computing the empirical power with simulated critical values. In this work, we are also paying attention in evaluating size corrected power. To calculate the size corrected power of multivariate normality tests, we propose the following algorithm:
i Suppose
n
x x
x1, 2,…, is a random sample from a
p-variates multivariate normal population. ii Sort each variable ( ) ( ) ( )
1, 2 ,…,
i i in
x x x where (i=1, 2,..., )p in ascending order of magnitude.
iiiMultiply the upper k% of data or lower k% of data; say 5%, 10% by a positive constantc≥1.
ivCalculate the power on the basis of the hypothesis. The hypothesis can be stated as
1 :
0 c=
H (i.e., the distribution is normal) against
1 :
1 c>
H (i.e., the distribution is non-normal).
4.2. Simulation for the Proposed Algorithm
Simulation on which this study based is enumerated below. The considered null hypothesis is as follows-
d distribute normally
are ns Observatio H0:
d distribute normally
not are ns Observatio H1:
To evaluate whether size or level of test achieves advertised
α
, generate data under normality assumption and calculate proportion of rejections of0
H . To calculate power, we follow the 4 steps proposed above.
4.3. Monte Carlo Simulation Assessing Power
This section demonstrates powers of different omnibus multivariate normality tests using Monte Carlo simulation with contaminations. We remark here that simulation techniques pay a key role in exploring results in Mathematical and Computational Sciences. An extended Monte Carlo simulation with contaminations is one of the best techniques among different simulation techniques. Many more researchers including Maurya et al. [23-34] confined
their attention to explore significant results using different simulation techniques. For present purpose of using an extended Monte Carlo simulation here, we generate data for different sample sizes under the null hypothesis and carry out 10,000 repetitions to calculate size corrected powers with upper and lower contamination of a certain percentage say 10%, 20% or more and obtained powers are presented through power curves to emphasize on the comparative performances of the tests.
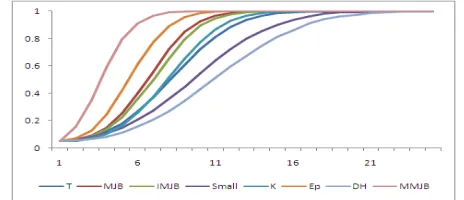
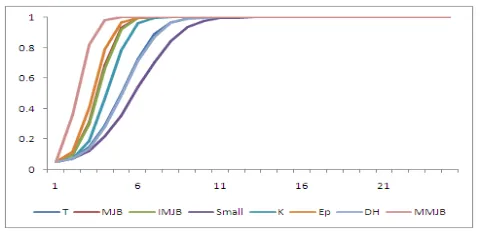
Using different omnibus tests for sample size
and the corresponding graphs of empirical powers of multivariate normal data with upper contamination are demonstrated in figures 1-2 respectively. Moreover, empirical powers of multivariate normal data with lower contamination are demonstrated in figures 3-4 respectively.
Fig. 1. Graph showingempiricalpowers of multivariate normal data with upper contamination whensample size
Fig. 2. Empirical powers of multivariate normal data with upper contamination whensample size
Fig. 4. Empirical powers of multivariate normal data with lower contamination when sample size
5. Purpose of Study and Future Scope
The purpose of the study was to provide general indication of the comparative effectiveness of the different multivariate normality test procedures. The omnibus measured tests in this study have optimum asymptotic power properties and good finite sample performance. Due to their simplicity, all of the omnibus tests should prove to be useful tools in multivariate statistical analysis. However, some general conclusions can be gleaned from the results. We observed that above power curves of the different omnibus multivariate tests show good power properties and their powers varies for different sample sizes and for unlike contaminations. In all cases, the omnibus test of transformed skewness and kurtosis EP shows utmost power. For the samples of lower contamination, though MMJB (modified multivariate Jarque and Bera) test have highest power but exhibits reverse power for upper contamination both for small and large samples. MJB(Multivariate Jarque and Bera) and IMJB(Improved multivariate Jarque and Bera) test have almost same power in most of the cases. Remaining omnibus multivariate tests have good and moderate powers for simulated samples.
6. Conclusions
Here, comparative powers of skewness and kurtosis based multivariate normality tests have been demonstrated and a novel implementable algorithm for MVN has been proposed. In addition to this, powers of different omnibus multivariate normality tests using Monte Carlo simulation with contaminations have also been successfully explored. Basically all the simulated results of this paper originated from empirical sampling studies and the information are intended to be broadly analytical. We propose an efficient algorithm for calculating size-corrected powers of multivariate normality tests and obtained powers of multivariate omnibus tests through the proposed algorithm are superior. In general, this algorithm is applicable to all tests of normality for the calculation of size-corrected power. Using different omnibus tests for sample size and the corresponding graphs of empirical powers of multivariate normal data with lower and upper contamination are demonstrated.
References
[1] Anscombe F.J. and Glynn W.J., Distribution of the kurtosis statistic
2
b for normal samples, Biometrika, Vol. 70, pp.227– 234, 1983.
[2] Bera A.K., A new test for normality, Economics Letter, Vol. 9, pp.263-268, 1982.
[3] Bowman K.O. and Shenton L.R., Omnibus test contours for departures from normality based on
1
b and b2, Biometrika,
Vol. 62, pp.243–250, 1975.
[4] Cox D.R. and Small N.J.H., Testing multivariate normality, Biometrika, Vol. 65, pp.267-372, 1978, doi:10.1093/biomet/65.2.263.
[5] D’Agostino R. and Pearson E.S., Tests for departure from normality: Empirical results for the distributions of b2 and
1
b , Biometrika, Vol. 60, pp.613–622, 1973.
[6] D'Agostino R.B., Belanger A. and Jr D'Agostino R.B., A Suggestion for Using Powerful and Informative Tests of Normality, The American Statistician, Vol. 44, pp.316-321, 1990.
[7] D'Agostino R.B., Transformation to Normality of the Null Distribution of
g
1, Biometrika, Vol. 57, pp.679-681, 1970. [8] Doornik J.A. and Hansen H., An Omnibus Test for Univariateand Multivariate Normality, Oxford Bulletin of Economics and Statistics, Vol.70, pp. 0305-9049, 2008.
[9] Enomoto R., Okamoto N., and Seo T., On the distribution of test statistic using Srivastava’s skewness and kurtosis, Technical Report No. 10-07, Statistical Research Group, Hiroshima University, 2010.
[10] Friedman J.H. and Rafsky L.C., Multivariate Generalizations of the Wald-Wolfowitz and Smirnov Two-Sample Tests, The Annals of Statistics Vol. 7(4), pp. 697, 1979. doi:10.1214/aos/1176344722.
[11] Grianadesikan R., Methods for statistical data analysis of multivariate observations, Wiley, New York, USA, 1977. [12] Inhof J.P., Computing the distribution of quadratic forms in
normal variables, Biometrika, Vol.48, pp.419-426, 1961. [13] Isogai T., On a measure of multivariate skewness and a test for
multivariate normality, Ann. Inst. Statist. Math, 34, pp.531-541, 1982.
[14] Isogai T., On using influence functions for testing multivariate normality, Ann. Inst. Statist. Math, Vol. 41, pp.169-180, 1989. [15] Jarque C.M. and Bera A.K., A test for normality of
observations and regression residuals, Internat Stat Rev, Vol. 55, pp.163–172, 1987.
[16] Koizumi K., Okamoto N. and Seo T., On Jarque–Bera tests for assessing multivariate normality, J Stat Adv. Theory Appl, Vol.1, pp.207–220, 2009.
[18] Looney S.W., How to use tests for univariate normality to assess multivariate normality, Amer. Statist, Vol. 39, pp.75-79, 1995.
[19] Malkovich J.F. and Afifi A.A., On tests for multivariate normality, Journal of the American Statistical Association, Vol. 68, pp.176–179, 1973.
[20] Mardia K.V. and Foster K., Omnibus tests of multinormality based on skewness and kurtosis, Commun. Statist, Vol.12, pp.207-221, 1983.
[21] Mardia K.V., Applications of some measures of multivariate skewness and kurtosis for testing normality and robustness studies, Sankhya, Vol. 36, pp.115-128, 1974.
[22] Mardia K.V., Measures of multivariate skewness and kurtosis with applications, Biometrika, Vol. 57, pp. 519-530, 1970. [23] Maurya A.K., Singh R.K., Maurya V.N. and Misra R.B.,
Analysis and simulation of harmonics current in power electronics equipment generated by nonlinear loads: hysteresis current control approach, American Journal of Engineering Technology, Academic and Scientific Publishing, USA, Vol.2(1), pp. 1-13, 2014
[24] Maurya Avadhesh Kumar and Maurya V.N., A novel algorithm for optimum balancing energy consumption LEACH protocol using numerical simulation technique, International Journal of Electronics Communication and Electrical Engineering, Algeria, Vol. 3(4), pp. 1-19, 2013, ISSN: 2277-7040
[25] Maurya V.N. and Maurya A.K., Polynomial simulation and refutation of complex formulas of resolution over linear equations in propositional proof system, American Journal of Modeling and Optimization, Science & Education Publishing, USA, Vol.2(2), pp. 34-38, 2014, ISSN (Print) 2333-1143, ISSN (Online) 2333-1267
[26] Maurya V.N., Arora Diwinder Kaur and Maurya Avadhesh Kumar, A survey report of parameter and structure learning in Bayesian network inference, International Journal of Information Technology & Operations Management, Academic and Scientific Publishing, New York, USA, Vol. 1(2), pp. 11-28, 2013, ISSN: 2328-8531
[27] Maurya V.N., Arora Diwinder Kaur, Maurya Avadhesh Kumar and Gautam Ram Asrey, Numerical simulation and design parameters in solar photovoltaic water pumping systems, American Journal of Engineering Technology, Academic & Scientific Publishing, New York, USA, Vol.1(1), pp. 1-09, 2013
[28] Maurya V.N., Arora Diwinder Kaur, Maurya Avadhesh Kumar and Gautam R.A., Exact modeling of annual maximum rainfall with Gumbel and Frechet distributions using parameter estimation techniques, World of Sciences Journal, Engineers Press Publishing, Vienna, Austria, Vol. 1(2), pp.11-26, 2013, ISSN: 2307-3071
[29] Maurya V.N., Maurya A.K. and Kaur D., A survey report on nonparametric hypothesis testing including Kruskal-Wallis ANOVA and Kolmogorov–Smirnov goodness-fit-test, International Journal of Information Technology & Operations Management, Academic and Scientific Publishing, New York, USA, Vol.1(2), pp. 29-40, 2013, ISSN: 2328-8531
[30] Maurya V.N., Misra R.B., Jaggi C.K., Arneja C.S., Maurya A.K. and and Maharaj Yogesh, Comparative analysis for the maximum precision using systematic and stratified random
sampling techniques, Edited Book on Dynamics of Business through Management, Engineering, Science & Technology, Mohit Publications, New Delhi, India, 2014
[31] Maurya V.N., Misra R.B., Jaggi Chadra K., Maurya A.K. and Arora D.K., Design and estimate of the optimal parameters of adaptive control chart model using Markov chains technique, Special Issue: Scope of Statistical Modeling and Optimization Techniques in Management and Decision Making Process, American Journal of Theoretical and Applied Statistics, Science Publishing Group, USA, 2014
[32] Maurya V.N., Numerical simulation for nutrients propagation and microbial growth using finite difference approximation technique, International Journal of Mathematical Modeling and Applied Computing, Academic & Scientific Publishing, New York, USA, Vol. 1(7), pp. 64-76, 2013, ISSN: 2332-3744 [33] Maurya V.N., Singh Bijay, Singh V.V., Maurya A.K. and Arora
D.K., Statistical modeling and parameter estimates of dbh-crown diameter prediction using sampling technique: A case study, Edited Book on Dynamics of Business through Management, Engineering, Science & Technology, Mohit Publications, New Delhi, India, 2014
[34] Maurya V.N., Singh V.V., and Yusuf Madaki Umar, Statistical analysis on the rate of kidney (renal) failure, Application and Future Scope of Fundamental Mathematical and Computational Sciences in Engineering & Technology, American Journal of Applied Mathematics and Statistics, Science & Education Publishing, USA, Vol. 2, No. 6A, pp. 6-12, 2014
[35] Nakagawa S., Hashiguchi H. and Niki N., Improved omnibus test statistic for normality, Computational Statistics, DOI 10.1007/s00180-011-0258-0, 2011.
[36] Okamoto N. and Seo T., On the distribution of multivariate sample skewness for assessing multivariate normality, Technical Report No. 08-01, Statistical Research Group, Hiroshima University, Hiroshima, 2008.
[37] Ozturk A. and Romeu J.L., A new method for assessing multivariate normality with graphical applications, Communications in Statistics-Simulation and Computation, Vol. 21, pp.15-34, 1992.
[38] Pearson E.S., D'Agostino R.B. and Bowman K.O., Test for departure from normality: Comparison of powers, Biometrika, Vol. 64, pp.231-246, 1977.
[39] Rencher A.C., Methods of Multivariate Analysis, New York: Wiley, 2002.
[40] Romeu J.L. and Ozturk A., A comparative study of goodness-of-fit tests for multivariate normality, Journal of Multivariate Analysis, Vol. 46, pp. 309-334, 1993.
[41] Roy S.N., On a heuristic method of test construction and its use in multivariate analysis, Ann. Math. Statist., Vol. 24, pp.220-238, 1953.
[42] Shenton L.R. and Bowman K.O., A bivariate model for the distribution of
1
b and b2, Journal of the American Statistical
Association, Vol. 72, pp. 206–211, 1977.
[44] Smith S.P. and Jain A.K., A test to determine the multivariate normality of a data set. IEEE Transactions on Pattern Analysis and Machine Intelligence, Vol. 10(5), pp. 757, 1988, doi:10.1109/34.6789.
[45] Srivastava M.S., A measure of skewness and kurtosis and a graphical method for assessing multivariate normality, Statist.
Probab. Lett, Vol.2, pp.263-267, 1984.