http://www.sciencepublishinggroup.com/j/jfa doi: 10.11648/j.jfa.20180606.13
ISSN: 2330-7331 (Print); ISSN: 2330-7323 (Online)
PITA 2011 and Voluntary Tax Compliance: Towards
Achieving Sustainable Revenue Generation in Kaduna
State Nigeria
Nyor Terzungwe
*, Jonathan Agnes Jummai, Mustapha Lateef Olumide
Department of Accounting and Management, Nigerian Defence Academy, Kaduna, Nigeria
Email address:
*
Corresponding author
To cite this article:
Nyor Terzungwe, Jonathan Agnes Jummai, Mustapha Lateef Olumide. PITA 2011 and Voluntary Tax Compliance: Towards Achieving Sustainable Revenue Generation in Kaduna State Nigeria. Journal of Finance and Accounting. Vol. 6, No. 6, 2018, pp. 150-161. doi: 10.11648/j.jfa.20180606.13
Received: November 1, 2018; Accepted: December 3, 2018; Published: January 2, 2018
Abstract:
Sustainable governance entails using the compulsory contribution paid to government by her citizens to support law and order, provide security and social amenities for the benefit of present and future generations. Nigeria's Personal Income Tax Act (PITA) 2011 was amended to provide for sustainable tax policies and administration that would secure voluntary tax compliance and guarantee sustainable revenue generation. The amendment introduced a more equitable tax system by providing realistic tax rates, and recommending an efficient and effective tax administrative system, and simpler tax laws. This study examines the determinants of voluntary tax compliance in Kaduna state Nigeria taking self-assessment, income tax rates, and penalties as provided by PITA 2011, with a view to ascertain whether the Act has significantly affected voluntary tax compliance in the State. The population of study is 4925 registered self-employed individuals who are subjected to Direct Assessment system in Kaduna State, Nigeria. A sample 370 respondents was arrived at using the Yaro Yamani formula. Descriptive statistics and multiple regression technique were used to analyze the data. The study reveals that the amended provisions of PITA 2011 on Self-assessment, Income tax rates and Penalty are capable of enhancing voluntary tax compliance but poor knowledge of the tax laws, unstable economy and administrative bottlenecks have affected the potency of the Act. The study therefore recommends among others that the Kaduna state Government employ measures to boost compliance, such as educating tax payers by summarizing the provisions of PITA 2011 in some widely spoken languages and communicating same.Keywords:
Sustainability, Governance, Voluntary, Tax, Compliance and Direct Assessment1. Introduction
Governments all over the world have the duty of protecting lives and property, maintaining law and order and promoting economic growth. To discharge these responsibilities require financial resources which governments generate through the taxation of her citizens. Sustainability means meeting the needs of the present generation without compromising the ability of the future generation to meet their own needs. Sustainable governance has to do with using the present resources to create enabling environment for the present and future generations to meet their needs. It entails using the compulsory contribution paid
to government by her citizens to support law and order, security and social amenities such as schools, electricity, portable water, roads and hospitals, which are for the benefit of present and future generations.
government, whether under the name of duty, custom excise, levy or other names. Taxes may be direct or indirect and may be imposed on individuals, entities, and assets [1]. Direct taxes are imposed on income, profits or gains of individuals, while indirect taxes are levied on a wide range of goods and services.
Personal Income Tax Act (PITA) 2011 was amended to provide for sustainable tax policies and administration that would secure voluntary tax compliance and guarantee sustainable revenue generation. The amendment introduced a more equitable tax system by providing realistic tax rates, and recommending an efficient and effective tax administrative system, and simpler tax laws. The thrust of the Amendment is in line with the National Tax Policy of the Government, which aims at tax burden reduction, equitable income redistribution, a shift from direct to indirect taxation and the introduction of a simplified process of compliance that encourages voluntary tax compliance and increase in tax revenue to the Government.
Sustainable revenue generation can only be achieved when citizens on their own voluntarily comply with tax laws without necessarily being forced to comply. PITA 2011 introduced some amendments that have direct effect on compliance, which are self-assessment, income tax rates and penalties. The amendments made a good combination of a relaxed tax regime that can be considered more tax -payer- friendly [2]. The amendments were specifically made to drive compliance and improve the effectiveness and efficiency of administrative process.
The persistent fluctuations in global oil prices, the exhaustible nature of mineral wealth and the insecurity in the Niger Delta caused by agitations for resource control have collectively brought to the fore the dangers in the country’s continued dependence on petrodollars. What now accrues to most State Governments is grossly inadequate to meet their constitutional obligations. This development has awakened the debate on more sustainable revenue sources to fund government programs and policies; with the result that taxation now occupies the front burner in national development discuss [3].
Previous studies on taxation in Kaduna state did not examine PITA 2011 and tax compliance. Reference [4] studied the determinants of tax compliance in Kaduna State but excluded PITA 2011. Referenced [5] researched on the effect of PITA 2011 on revenue generation and not how it enhances voluntary tax compliance in Kaduna State.
This study focuses on direct assessment because several studies in the past have confirmed that issues of Non-compliance are higher with this category of taxpayers [6 in 4] The PITA 2011 amends thirty six sections of the Personal Income Tax Act, Cap P8, Laws of the Federation of Nigeria, PITA 2004. It also modifies the First, Third and Sixth Schedules to the PITA 2011. However, this study looks at sections 44, 52, 60, 74, 94,95,96,97, 104 and the sixth schedule of the PITA 2011 that are of great significance to compliance if well applied. It is against this background that this study aims at assessing the impact of PITA 2011 on
voluntary tax compliance in Kaduna State, Nigeria.
This paper is divided into five sections. Section two is literature review which attempts to review relevant concepts and empirical studies by other authors. Section three provides the methodology of the study specifying the population and sample size and methods of collecting and analysing data. Section four presents the data and results of the analyses, tests the hypotheses of the study and discusses the findings of the study. Section five draws conclusions and offers recommendations for achieving sustainable revenue generation in Kaduna State, Nigeria.
2. Literature Review
This section reviews the concept of tax compliance and investigates the determinants of voluntary tax compliance with a focus on whether or not the amendment of the Tax Act have direct effect on compliance.
2.1. Theoretical Framework
Deterrence theory, Economic theory and psychological theory have attempted to explain the reasons why people will refuse to comply until they are forced. However, the deterrence theory is most related to this study. Hence, this study is anchored on the deterrence theory.
Deterrence theory is regarded as a model in tax compliance. The assumption of this model is that the probability that an increase in either the detection of crime or punishment for crime or both will decrease the economic reward of the criminal activity. Reference [4] explained the principle of the theory that, if the probability of detection is high and or punishment for the crime is high, this will deter individuals from committing crime. The theory posits that human behaviour is controlled by the potential cost and reward of a particular act. Deterrence can be achieved through a number of approaches, punitive and persuasive. That is, deterrence may take the form of increasing the probability of detection, increasing the tax rate or by the imposition of tougher penalties. Alternatively, it may take the form of better education, increased advertising/publicity and incentives. The punitive impact of penalties, sanctions and other enforcement factors shapes taxpayer compliance attitudes and behaviour.
2.2. Concept of Compliance
income, calculate their tax liability and file a tax return. Compliance with reporting requirement means that the taxpayer files all required tax returns at the proper time and that the returns accurately report tax liability in accordance with the Internal Revenue code, regulation and court decisions applicable at the time the return is filed [9 in 8]. Reference [7] has also pointed out issues that must be addressed to enhance compliance such as education of tax payers and administrators, tax service quality etc.
2.3. Determinants of Voluntary Tax Compliance
There are several determinants of voluntary tax compliance such as tax service quality, good utilization of tax payers money through provision on infrastructures, education of tax payers and administrators, self assessment, penalties, tax rates etc. However, this study focuses on those determinants that were amended in the PITA 2011 amendments. This is because the focus of this study is to examine the effect of the amendments on voluntary tax compliance in Kaduna State, Nigeria.
2.3.1. Self-assessment
Self-assessment was introduced to address the issues of non-compliance by making the process of tax assessment more tax payer friendly. Tax administration seeks to optimize tax collections while minimizing administration and taxpayer compliance costs. Voluntary compliance is best achieved through a system of self-assessment. Many tax administrations have introduced self-assessment principles in the income tax laws.
Reference [10] examines self-assessment scheme and revenue generation in Nigeria using well-structured questionnaire of three sections of thirty-eight items with an average reliability of 0.71 and data from other secondary sources. The data collected from the questionnaire were analyzed using relevant statistical models. The analysis reveals that self-assessment improves compliance significantly which in turn affects revenue generation in Nigeria. The analyses indicates that strong correlations exist between self-assessment, compliance rate and revenue generation. Therefore, the paper concludes that self-assessment scheme influences revenue generation and by extension, voluntary tax compliance. The weakness of this study is that, increase in revenue generation cannot be attributed to tax compliance due from self assessment alone.
On the contrary, Simon and Clinton are of the opinion that self-assessment increases the risk that a revenue service might resort too readily to a penalty driven compliance policy [11]. Their paper on tax compliance, self-assessment and tax administration argue that one risk with self-assessment is the temptation to rely on a harsher enforcement regime. It has been alleged from time to time, for example, that the Internal Revenue Service in the USA has sometimes relied on over-zealous enforcement or unduly punitive methods of securing compliance with their self-assessed income tax system.
2.3.2. Income Tax Rates
Reference [12] in their study on determinants of taxpayer compliance conclude that tax compliance is greater when individuals face a low tax rate and when they receive something for their tax. Reference [13] in their paper examined the correlation as well as the effect of tax rate on tax compliance in Africa using cross-country data. The study used all the African countries as population, upon which samples were selected using multi-stage approach. Data were analyzed using SPSS version 19.The findings showed that there is significant negative correlation between tax rate and tax compliance. Thus, it is recommended that countries with tax rates above average that are experiencing noncompliance should reduce their tax rate to the mean tax rate in Africa.
Reference [14] appraised the evasion of Personal Income Tax in Nigeria. A total of 160 questionnaires were administered to some selected self-employed individuals in Edo State comprising businessmen, contractors, professional practitioners like lawyers, doctors, accountants, architects and traders in shops as well as staff of Federal Inland Revenue Service in Benin City, Edo State, Nigeria. Tax rate showed a positive relationship with tax evasion. This means that the higher the tax rate the higher the tendency of tax evasion. They recommended that the Board should intensify Tax Payer Education and maintain a harmonious relationship capable of fostering voluntary compliance.
2.3.3. Penalties
Reference [2] in an explorative study based on review of relevant literature and reactions of stakeholders on new income tax amendment legislation highlighted the implication of the Nigerian Personal Income Tax (Amendment) Act 2011 on Personal Income tax administration and tax revenue against the background of the challenges it seeks to resolve. They submit that, the major implication of the act is that it provides good combination of a relaxed tax regime that is more taxpayer friendly than the principal Act, while also specifying stricter tax collection and enforcement regulations that prescribe stiffer penalties and controls over tax payments and remittances defaults. They conclude that despite what the amendment seeks to achieve, it has still not reflected in the bottom-line of most states of the federation, as compliance is still an issue of concern.
3. Methodology
The population of this study consist of 4925 eligible tax payers under Direct Assessment registered with Tax Identification Numbers (TIN) and comprehensive addresses with the Kaduna State Board of Internal Revenue Service (KBIRS) as at May 2017. The population is from the twenty one (21) tax offices across the entire state. The sample size for the study is determined using Yamane formula. Stratification is adopted in order to arrive at a more scientific technique that allows each element of the population an equal chance of being selected. See Appendix I to this study
Questionnaire structured on a five-point Likert scale ranging from Strongly Agree to Strongly Disagree was physically administered randomly to 370 eligible tax payers. Respondents were located using available addresses with the State Internal Revenue Board.
The independent variables of the study are Self-assessment, Income tax rate and penalties. A combination of dimensions of self-assessment as identified by [5, 10, 11, 17, 18], and [19] which include amongst others; Client focus taxpayer service, tax audit, Public governance quality, approach of tax administrators to non-compliance and quality of tax administration is adopted with modification as shown in table 1.
Table 1. Dimension and measurement of Self- Assessment variables.
Dimensions Measurement Sources of Dimension
Knowledge of the tax law.
1.Knowledge of taxpayer’s duty to assess self.
2.Knowledge of taxpayer’s power to engage a tax consultant to help with assessment processes. 3.Knowledge of the requirement to keep adequate and proper books of account for tax purpose
by the tax payer
[17, 10, 19, 18]
Ease of tax remittance
1.Filling of tax returns forms correctly 2.Ease of Computing tax liability 3.Ease of Making payment
4.Suitability of cut off time for filing returns
[17]
Service Quality
1.Administrative assessment 2.Audit of returns by tax payers.
3.Effort at reminding tax payers of their obligations
2001, [19, 17]
Source: Authors' compilation
3.1. Income Tax Rates
To enhance compliance, the income tax rate was amended in a progressive manner to reduce tax burden on the low and middle income earner. References [7, 20-22] have shown that
there is a relationship between income tax rate and compliance. Dimensions like knowledge of the tax law, Tax Burden and complexity of tax structure in these studies will be modified and used in this study as seen in Table 2.
Table 2. Dimension and Measurement of Income Tax Rate variables.
Dimensions Measurement Sources of Dimension
Knowledge of the Tax Law
1.Knowledge of the applicable tax rates
2.Knowledge of applicable relieves and allowances
3.Knowledge of the allowable deductions in arriving at chargeable income
[10, 17, 18, 19]
Perception of tax rate
1.Ease of determining and claiming available relieves and allowances and applying the new tax rate 2.Unstable and harsh Economic conditions
3.Tax burden
[20, 21, 23],
Source: Authors' compilation
3.2. Penalties
The application of penalties has been identified by several studies as a determinant of compliance. This study has adopted the knowledge of the tax audit and enforcement
strategies as the dimension for measuring penalties amongst several dimensions highlighted in related studies as seen in table 3. The efficacy in the application of penalties is believed to go a long way in enhancing compliance.
Table 3. Dimension and measurement of Penalty variables.
Dimension Measurement Sources of Dimension
Knowledge of the tax law
1.Knowledge of penalty for failure to deduct tax 2.Knowledge of penalty for making incorrect returns 3.Knowledge of penalty for making false statement
4.Knowledge of penalty for not keeping adequate or proper books of account 5.Knowledge of penalty for not paying on specified date
6.Knowledge of the provision to distrain for non-payment of tax
[10, 17, 18, 19]
Enforcement strategy
1.Service assessment notice assessment 2.Handling and resolving disputes 3.Audit process
[17]
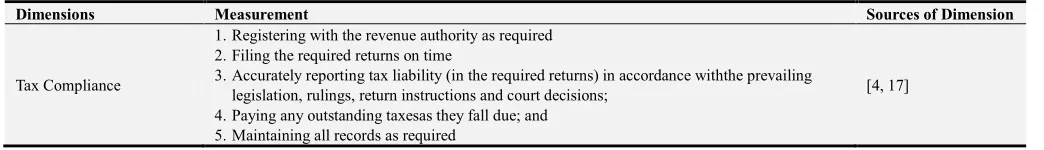
3.3. Measurement of Tax Compliance
The dependent variable of the study is Tax Compliance. Reference [23] pointed out three measures of compliance; Filing Compliance (the timely filing of any required return); reporting compliance (the accurate reporting of income and of tax liability) and Payment compliance (the timely payment of all tax
obligations). References [17, 22, 24-27,19] pointed out Voluntary registration with Relevant Tax Authority, Prompt and accurate filing of returns, Report correct tax liability, Prompt and timely payment of outstanding tax and Proper record keeping as measures of compliance. This study will adopt a combination of the measures of compliance as captured in table 4.
Table 4. Measurement of tax compliance.
Dimensions Measurement Sources of Dimension
Tax Compliance
1.Registering with the revenue authority as required 2.Filing the required returns on time
3.Accurately reporting tax liability (in the required returns) in accordance withthe prevailing legislation, rulings, return instructions and court decisions;
4.Paying any outstanding taxesas they fall due; and 5.Maintaining all records as required
[4, 17]
Source: Authors' compilation
3.4. Method of Data Analysis
Data for this research were analysed using SPSS. Descriptive statistics and multiple regressions (Ordinary Least Squares) were used as statistical techniques for analysis of data. Multiple regression is considered appropriate because the study examines the effect of multiple independent variables (self-assessment, income tax rate and penalty) on one dependent variable (compliance).
3.5. Regression Model
In order to provide a guide towards testing the hypothesis, the study will use conceptual models. Reference [28] explains the conceptual model as diagram that connects variables based on theory and logic to virtually display the hypotheses to be tested. The following regression models will be used for this study.
Regression Model for Self- Assessment on Tax Compliance
TC= α + β1KTL+ β2ETR+ β3SQ + e (1)
Where
TC = Tax compliance α = the intercept
β1KTL = Knowledge of the tax law β2ETR = Ease of Tax Remittance β3SQ = Service Quality
e = Error term of random disturbance
Regression model for Income tax rate on tax compliance
TC= α + β6KTL+ β9PTR+e (2)
Where
TC = Tax compliance α = the intercept
β6KTL = Knowledge of tax law β9PTR = Perception of tax rate
e = Error term of random disturbance
Regression model for Penalty on tax compliance
TC= α + β10KTL+ β11ES + e (3)
Where
TC = Tax compliance α = The intercept
β10KTL = Knowledge of the Tax law β11ES = Enforcement Strategy
e = Error term of random disturbance
4. Data Presentation, Analysis and
Interpretation
This section presents the data collected from field work and the result of the analyses, offers explanations for the results and tests the hypotheses of the study.
4.1. Data Presentation
A total of 370 copies of questionnaires were distributed. Data screening was carried out on the retrieved questionnaires and 366 that were correctly filled and found to be useful were adopted. Thus, the analysis was based on 366 correctly filled and returned questionnaires which are sufficient for our study since our sample size of 366 represent 98.9% of the total questionnaires distributed, a response rate considered sufficient for statistical reliability and generalization. The analysis is hereby presented in Table 5.
Table 5. Summary of the Responses.
Item No of Copies Percentage %
No of Questionnaire Distributed 370 100
No of Questionnaires returned 368 99.4
No of questionnaires correctly filled 366 98.9
Source: Field Work
4.2. Results and Interpretation
4.2.1. Self Assessment and Voluntary Tax Compliance
Descriptive Statistics
Data collected on Self- Assessment are presented and
discussed in this section. The tables below present results on the knowledge of the tax laws, Ease of tax remittance and service quality.
Table 6. Knowledge of the Tax law.
Statement N SA/A% UD% SD &D% Mean Std Deviation
Stats Stats Stats Stats Stats Stats
I am aware that i am expected to assess myself and
file tax returns as expected by the law 366 12.3 21.2 66.5 2.00 1.100
I am aware that I can engage a tax consultant to assist
in my assessment where I cannot do it. 366 9.2 20.8 70 2.03 1.975
I am aware that I am expected to keep adequate and
proper books of accounts for tax purpose. 366 21.1 12.7 66.2 2.08 1.163
Valid N (list wise) 366
Source: Field Work
From Table 6 an average of 67% of respondent do not have adequate knowledge of the tax law. They are not aware of the legal requirement as it relates to self-assessment. The low mean score of 2 for all variables of study confirms this position. Inadequate knowledge of the tax law has made
majority of the taxpayers ignorant of what is expected of them as it relates to tax compliance in the state. Overall, the outcome of this survey reflects a poor knowledge of the tax laws in relation to self-assessment and this has a significant impact on compliance.
Table 7. Ease of Tax remittance.
Statement N SA/A% UD%
SD
&D% Mean Std Deviation
Stats Stats Stats Stats Stats Stats
I can fill the applicable tax returns forms correctly 366 22.7 15.4 61.9 2.25 1.304
I can compute my tax liability with any support 366 12.3 21.2 66.5 2.16 1.100
I easily and quickly access the channels for making tax remittances/payment. 366 9.2 20.8 70 2.14 0.965
Valid N (list wise) 366
Source: Field Work
Table 7revealed that 61.9% of respondents find it difficult to fill the applicable tax returns forms correctly while 66.5% confirmed that they cannot compute their tax liability without any support. On ease of accessing channels for making remittance, 70% strongly disagree that they find it easy to
make tax remittances. The mean score hanging around 2 is a reflection of this position. The ease of making remittances has a direct relationship with compliance; the easier the process the higher the chances of compliance.
Table 8. Service Quality.
Statement N SA/A% UD%
SD
&D% Mean Std Deviation
Stats Stats Stats Stats Stats Stats
I am usually subject to administrative assessment when I do not render my
returns on due date 366 57.7 14.6 27.7 2.01 1.535
My books are usually audited on a routine bases to confirm the correctness
of my remittances 366 19 2.1 78.9 1.32 1.225
I am usually reminded of my tax obligation before they fall due 366 10.6 10.3 79.2 1.11 1.220
Valid N (list wise) 366
Source: Field Work
Table 8 shows the outcome of the survey on service quality. The responses have revealed that there is a problem with the service quality of administrators as shown by a general mean score which is barely above 2. About 58% of the respondents have confirmed that they are usually subjected to administrative assessment if they fail to render returns but a large percentage of about 78.9 and 79.2 per cent have confirmed that their books of accounts are not usually
checked to ascertain correctness of remittances and they are not usually reminded of their tax obligations before they fall due. This position does not support compliance as what is not checked and monitored properly will usually be left undone.
Regression Results
Table 9. Regression Result for Self- Assessment.
Individual Variables Coefficient t-statistics Standard Error P value VIF
CONSTANT 1.324 22.441 0.127 0.069
KTL 0.127 2.309 0.035 0.065 1.664
ETR 0.159 2.789 0.031 0.072 1.546
SQ 0.210 3.043 0.049 0.052 1.623
R-SQUARED 0.228
ADJUSTED R-SQUARED 0.222
F-STATISTICS 15.080 0.477b
P-value 0.000
Source: SPSS Output
The result in Table 9 revealed that the F-statistic, which measures the adequacy and fitness of the model used in the study, stood at 15.08 and its probability being 0.447 indicates that it is statistically significant at 95% confidence level; as such, the model of the study is adequate and fit.
The coefficient of determination, R2, stood at 0.228, indicating that about 22.8% of the total variation in the Compliance of Tax Payers is explained by the three independent variables; Knowledge of tax laws, Ease of Tax Remittance and service quality, whereas the remaining 77.3% (100 – 22.8) are explained by other factors. The adjusted R2 stood at 0.222, indicating that the independent variables would still explain 22.2% of the variations in Tax Payers Compliance even if other variables are added to the model.
Given the coefficients, the regression model (TC= α + β1KTL+ β2ETR+ β3SQ +e) is represented thus:
TC= 1.324 + 0.127 β1 + 0.159β2+ 0.210β3+e (4)
Where:
TC = Tax Payers’ Compliance KTL = Knowledge of tax laws ETR = Ease of tax remittance SQ =Service quality
Given the respective independent variables, Knowledge of tax laws gives a beta coefficient of 0.127 and a t-statistic value of 2.309 with a P-value of 0.065; Ease of tax remittance gives a beta coefficient of 0.159 and a t-statistic value of 2.789 with a P- value of 0.072 and Service quality gives a beta coefficient of 0.210 and a t-statistic value of 3.043 with a P-value of 0.052.
All variables on self-assessment show a strong positive
relationship with compliance. This implies that every improvement in the level of taxpayers knowledge, Ease of Tax remittance and service quality in line with the provisions of the PITA 2011 will lead to an increase in the level of self-assessment and hence compliance.
Test of Hypotheses
This subsection tests the hypotheses that:
H1: The provision of PITA 2011 on Self-assessment has
not significantly influenced voluntary tax compliance Kaduna State, Nigeria
Based on the regression result in Table 9, all variables give P values greater than 0.05 level of significance. The beta values being positive imply that an improvement in the independent variables, given the nature of the questions raised, has the capability to increase Tax Payers’ Compliance in Kaduna. However, the result shows that the impact which they have on tax payers’ compliance in Kaduna State is quite insignificant. This insignificance of probabilities does not give us enough statistical evidence to reject null hypotheses which states that the provisions of PITA 2011 on Self-assessment has not significantly influenced tax compliance Kaduna State, Nigeria. We therefore fail to reject the null hypotheses which states that the provision of PITA 2011 on Self-assessment has not significantly influenced tax compliance in Kaduna state, Nigeria.
4.2.2. Income Tax Rate and Voluntary Tax Compliance
Descriptive Statistics
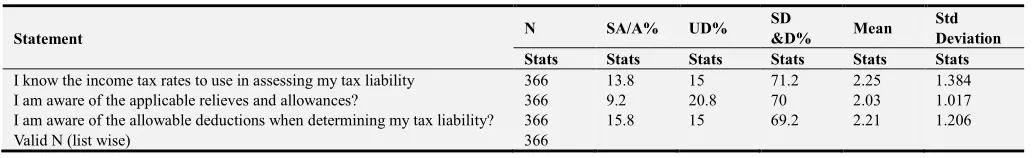
Data collected on income tax rate are presented and discussed in this section. The tables below present results on the Knowledge of the tax law and Perception of tax rate.
Table 10. Knowledge of tax laws.
Statement N SA/A% UD%
SD
&D% Mean Std Deviation
Stats Stats Stats Stats Stats Stats
I know the income tax rates to use in assessing my tax liability 366 13.8 15 71.2 2.25 1.384
I am aware of the applicable relieves and allowances? 366 9.2 20.8 70 2.03 1.017
I am aware of the allowable deductions when determining my tax liability? 366 15.8 15 69.2 2.21 1.206
Valid N (list wise) 366
Source: Field Work
Table 10 highlights the outcome of the survey on the Knowledge of the tax law. The knowledge of tax law as relates income tax rates is low with a general average mean score of a little above 2 as shown in the survey report above. Respondents totaling 71.2% have submitted that they do not
tax laws as it relates the graduated income tax rate and this has a significant impact on compliance.
Table 11. Perception of tax rate.
Statement N SA/A% UD%
SD
&D% Mean Std Deviation
Stats Stats Stats Stats Stats Stats
I find it easy to determine and claim available relieves and allowances 366 9.6 7.3 83.1 1.69 1.071
The unstable and harsh economic conditions has affected my tax remittance 366 9.7 11.5 78.8 1.93 1.065
I feel heavily taxed because I don’t know what my tax is used for 366 9.8 12.3 77.8 1.95 1.107
Valid N (list wise) 366
Source: Field Work
Table 11 captures the survey result on perception of the income tax rates. It is obvious that the mean scores are generally low i.e. below 2 on all questions raised. A high percentage (83.1%) of the respondents submitted that, they are unable to determine and claim available reliefs and allowances, in applying the new tax rate; 78.8% have submitted that the unstable and harsh economic conditions have affected their tax remittances and 77.8% confirmed that
they feel a heavy tax burden because they do not know how their taxes are applied. Overall, the perception of the graduated income tax rate appears not good enough to enhance compliance in Kaduna state, Nigeria.
Regression result
Data collected on Income tax rate and analyzed through regression is presented and discussed below.
Table 12. Regression Result for Income Tax Rate.
Individual Variables Coefficient t-statistics Standard Error P value VIF
CONSTANT 1.324 10.460 0.127 0.063
KTL 0.165 3.265 0.040 0.054 1.634
PTR 0.143 3.321 0.054 0.066 1.543
R-SQUARED .205
ADJUSTED R-SQUARED .198
F-STATISTICS 37.051 0.477b
P-value 0.000
Source: SPSS Output
Table 12 revealed that the F-statistic, which measures the adequacy and fitness of the model used in the study, stood at 37.051 and its probability which is 0.477 indicates that it is statistically insignificant; as such, the model of the study is adequate and fit.
The coefficient of determination, R2, stood at 0.205, indicating that about 20.5% of the total variation in the Compliance of Tax Payers is explained by the two independent variables; Knowledge of tax laws and perception of tax rate, whereas the remaining 79.5% (100 – 20.5) are explained by other factors. The adjusted R2 stood at 0.198, indicating that the independent variables would still explain 19.85% of the variations in Tax Payers Compliance even if other variables are added to the model.
Given the coefficients, the regression model (TC= α + β4KTL+β5PTR+e) is represented thus:
TC= 1.324+ 0.165 β4+0.143β5+e (5)
Where:
TC = Tax Payers’ Compliance KTL = Knowledge of tax laws PTR =Perception of Tax rates
Given the respective independent variables, Knowledge of tax laws gives a beta coefficient of 0.165 and a t-statistic value of 3.265 with a P-value of 0.054 and Perception of tax rate gives a beta coefficient of 0.143 and a t-statistic value of 3.321 with a P-value of 0.066.
All variables on income tax rate show a strong positive relationship with compliance. This implies that every improvement in the level of taxpayer’s knowledge and perception of tax rates will lead to an increase in the level compliance.
Test of Hypotheses
This subsection tests the hypotheses that:
H2: The provisions of PITA 2011 on Income tax rate has
not significantly influenced voluntary tax compliance Kaduna State, Nigeria.
Based on the regression result in Table12, all variables give P values greater than 0.05 level of significance. The beta values being positive imply that an improvement in the independent variables given the nature of the questions raised has the capability to increase Tax Payers’ Compliance in Kaduna. However, the result shows that the impact which they have on tax payers’ compliance in Kaduna State is quite insignificant. This insignificance of probabilities does not give us enough statistical evidence for rejecting the null hypotheses which states that the Provision of PITA 2011 on Income tax rate has not significantly influenced tax compliance in Kaduna State, Nigeria. Therefore, we fail to reject the null hypotheses which states that the provision of PITA 2011 on income tax rate has not significantly influenced tax compliance in Kaduna state, Nigeria.
lower and tax payers receive benefits for the tax they pay [12]. In Kaduna State, tax burden is perceived to be too high and tax payers have not witnessed proper application of the tax they pay. Hence, tax rate has no significant impact on compliance.
4.2.3. Penalty and Voluntary Tax Compliance
Descriptive Statistics
Data collected on penalty are presented and discussed in this section. The tables below present results on the Knowledge of tax law and Enforcement strategy.
Table 13. Knowledge of the tax Law.
Statement N SA/A% UD%
SD
&D% Mean
Std Deviation
Stats Stats Stats Stats Stats Stats
I am aware of the penalty for failure to deduct tax 366 11.1 5.7 84.2 1.73 1.003
I am aware of the penalty for rendering incorrect returns 366 8.9 5.2 85.9 1.80 1.010
I am aware of the penalty for making false statement 366 9.6 7.3 83.1 1.69 1.071
I am aware of the penalty for failure to keep adequate or proper books of
account 366 10.2 5.3 84.5 1.79 1.071
I am aware of the penalty for failure to make payment on specified date 366 10.1 9.5 80.4 1.91 1.065
I am aware of the power to distrain for non-payment 366 11.3 7.3 81.4 1.92 1.107
Valid N (list wise) 366
Source: Field Work
Table 13 captures the survey result on the knowledge of the tax laws as it relates to penalties. Just like the survey on Self- Assessment and Income tax rate, respondents still are not aware of the implication of not meeting up their tax obligations. Their poor knowledge of the penalties is reflected in the poor average mean score of below 2. Across
board, an average of 85% of tax payers do not know the extent to which they could be penalized and this is due to a poor knowledge of the PITA 2011. Overall, this survey has revealed that there is still a knowledge gap on the issues of penalties and this is has an impact on compliance.
Table 14. Enforcement Strategy.
Statement N SA/A% UD%
SD
&D% Mean Std Deviation
Stats Stats Stats Stats Stats Stats
I am usually served a notice of assessment when I do not render my returns
on due date. 366 4.5 10.9 84.7 1.53 1.004
I am usually encouraged to follow the right process for handling and
resolving disputes 366 5.3 14.6 80.1 1.67 1.058
My financial records are usually audited to establish correctness of returns 366 9.7 11.5 78.8 1.93 1.065
Valid N (list wise) 366
Source: Field Work
Table 14 presents the survey result on Enforcement Strategy. There is a very low mean score of below 2. A good percentage (84.7%) of respondents have submitted that they have never been served a notice of assessment when they fail to render returns on due date; while 80.1% submitted that they are never encouraged to follow the right process of handling and resolving disputes, and 78.8% submitted that
their financial records have never been audited to establish the correctness of information provided. The strategies employed to enforce compliance as stipulated in the PITA 2011 are not applied to enhance compliance
Regression Analysis on Penalty
Data collected on Penalty and analyzed using regression is presented and discussed below.
Table 15. Regression Result for Penalty.
Individual Variables Coefficient t-statistics Standard Error P value VIF
CONSTANT 1.214 20.931 0.058 0.054
KTL 0.153 2.508 0.055 .062 1.634
ES 0.123 2.016 0.061 .053 1.536
R-SQUARED .215
ADJUSTED R-SQUARED .209
F-STATISTICS 36.750 0.477b
P-value 0.000
Source: SPSS Output
Table 15 revealed that the F-statistic, which measures the adequacy and fitness of the model used in the study, stood at 36.750 and its probability being 0.473 indicates that it is
statistically significant at 95% confidence level; as such, the model of the study is adequate and fit.
indicating that about 21.5% of the total variation in the Compliance of Tax Payers is explained by Knowledge of tax laws and enforcement strategy whereas the remaining 78.5% (100 – 21.5) is explained by other factors. The adjusted R2 stood at 0.209, indicating that the independent variables would still explain 20.9% of the variations in Tax Payers Compliance even if other variables are added to the model.
Given the coefficients, the regression model (TC= α + β6KTL+ β7ES+e) is represented thus:
TC= 1.214+ 0.153β6+ 0.123β7+e (6)
Where:
TC = Tax Payers’ Compliance KTL = Knowledge of tax laws ES = Enforcement strategy
Given the respective independent variables, Knowledge of tax laws gives a beta coefficient of 0.153 and a t-statistic value of 2.508 with a P-value of 0.062 and Enforcement strategy gives a beta coefficient of 0.123 and a t-statistic value of 2.106 with a P- value of 0.053.
All variables on penalty also show a strong positive relationship with compliance. This implies that every improvement in the level of taxpayer’s knowledge and enforcement strategy will lead to an increase in the level compliance.
Test of Hypotheses Three
This subsection tests the hypotheses that:
H3: Provision of PITA 2011 on Income tax rate has not
significantly influenced tax compliance in Kaduna State, Nigeria.
Based on the regression result in Table 15, all variables give P values greater than 0.05 level of significance and the beta values of all the independent variables being positive imply that an improvement in them given the nature of the questions raised has the capability to increase Tax Payers’ Compliance in Kaduna. However, the result shows that the impact which they have on tax payers’ compliance in Kaduna State is quite insignificant. Based on the above analysis we fail to reject the null hypotheses which states that Provision of PITA 2011 on Penalties has not significantly influenced tax compliance in Kaduna State, Nigeria. This finding is consistent with Kennedy and Omoye who conclude in the
study of Edo state Nigeria that a weak penalty is an incentive to evade tax [14].
5. Conclusion and Recommendation
The results from the analysis reveal a poor knowledge of the tax laws which has a negative impact on the ability of eligible taxpayers to correctly assess themselves as prescribed by the law. The assessment process is perceived to be complex and payment process time consuming and the quality of service is poorly rated and lacks the force to drive compliance.
The study also finds that tax payers are not willing to make remittances because they have not witnessed the proper application of their tax proceeds by Government. Cases of bad roads, poor health services, poor water and electricity supply which make it very difficult to do business. In addition, lacks of enforcement of PITA 2011 by the tax authorities do not support compliance.
From the above findings, the study concludes that the provisions of the PITA 2011 on Self-Assessment, Income Tax Rate and Penalties have not significantly impacted on tax compliance Kaduna state, Nigeria. Thus, PITA 2011 has no significant impact on voluntary tax compliance in Kaduna state, Nigeria.
The potency of the PITA 2011 will only be felt when taxpayers know and understand its provisions. Thereafter the legal authority can be consistently applied with a total overhaul of the administrative machineries. Hence, the study recommends that PITA 2011 should be summarized in a simplified manner and also be written in local dialect. Similarly, tax forms should be made very easy to complete and returned and Tax Authorities should adopt filing and e-payment through internet and mobile banking to allow taxpayers to deposit their tax returns and proof of payment and even obtain their tax clearance certificate without the need for face-to-face contact with tax officials. Finally, the study recommends that Kaduna state Government should channel tax proceeds to projects that will directly impact the lives of citizens of the state so that they can appreciate the essence of contributing to state coffers.
Appendix
Table A1. Proportionate Stratification of Population of Registered Eligible Tax Payers (direct Assessment in Kaduna State.
S/N TAX OFFICE POPULATION FACTOR SAMPLE
1 HEADQUARTERS 610 610/4925*370 46
2 TUDUN WADA 423 423/4925*370 32
3 DOKA EAST 635 635/4925*370 48
4 KAKURI EAST 733 733/4925*370 55
5 KAWO 351 351/4925*370 26
6 BIRNIN GWARI 52 52/4925*370 4
7 DOKA WEST 1023 1023/4925*370 76
8 KACHIA 141 141/4925*370 11
9 KAFANCHAN 201 201/4925*370 15
10 KWOI 183 183/4925*370 14
S/N TAX OFFICE POPULATION FACTOR SAMPLE
12 GWANTU 1 1/4925*370 -
13 SAMINAKA 75 75/4925*370 6
14 KAURU 41 41/4925*370 3
15 TURUNKU 26 26/4925*370 2
16 ZARIA 95 95/4925*370 7
17 IKARA 78 78/4925*370 6
18 SOBA 27 27/4925*370 2
19 MAKARFI 43 43/4925*370 3
20 GIWA 53 53/4925*370 4
21 SAMARU 80 80/4925*370 6
TOTAL 4925 370
Source: Authors' Compilation
References
[1] National tax policy, (2012). Federal ministry of finance. Retrieved from www.firs.gov.ng
[2] Akhideme, E. A., & Abusowan, E. R., (2013). Personal Income Tax (Amendment) Act 2011; Implication for tax enforcement, AFRREV IJAH An International Journal of Arts and Humanities Bahir Dar, Ethiopia Vol. 2 (4), S/No 8, September, 2013: 217-232 ISSN: 2225-8590 (Print) ISSN 2227-5452 (Online).
[3] Okonjo-Iwella, N., (2012). A comprehensive tax history of Nigeria. Published by Safari book ltd, Ibadan Nigeria. © Federal Inland Revenue Service (FIRS)
[4] Mustapha, L.O., (2015). Determinants of personal income tax compliance in Kaduna State, Nigeria. Dissertation submitted to the department of accounting, faculty of social science, Nigeria defence Academy Kaduna, Nigeria.
[5] Dabo, Z., Aimuyedo, M. & Muhammad, T., (2014). The Effect of Personal Income Tax Amendment Act on Revenue Generation in Nigeria. Retrieved from: http://ssrn.com/abstract=2488098
[6] Khabel, B. D., and Nwokah, N.G., (2009). Curbing Tax evasion and avoidance in personal income tax administration: A study of the south –south State of Nigeria in European Journal of Economic, Finance and administration Sciences, 15;51-61.
[7] Andreoni, J., Erard, B., & Feinstein, J., (1998). Tax compliance. Journal of. Econ. Literature., 36: 818-60. [8] Fagbemi, T.O., Uadiale, O.M., & Noah, A.O., (2010). The
ethics of tax evasion: Perceptual evidence from Nigeria, European Journal of Social Sciences, 17(3): 360-371. [9] Roth, J., Scholz,j., & Witte, D,. (1989), Tax payer compliance
volume 1,an agenda for Research. University of Pennyslevian Press, Anniversary Collection.
[10] Appah, E., & Ogbonna, G. E., (2014). Self-Assessment Scheme and Revenue Generation in Nigeria. Developing Country Studies ISSN 2224-607X (Paper) ISSN 2225-0565 Vol.4, No.10, (Online) www.iiste.org
[11] Simon, J., & Clinton, A., (2004). Tax compliance, Self- assessment and Tax Administration. Journal of finance and management in public service, vol 2 no 2.
[12] James, A., Betty, R. J., & Michael, M., (1992). Estimating the
determinants of tax payer compliance with experimental data. National Tax Journal. Vol. 45 No 1, March 1992. PP 107-14 [13] Abdulsalam, M., Almustapha, A. A., & Elmaude, J. G.,
(2014). Tax rate and tax compliance in Africa. European Journal of Accounting, Auditing and Finance research vol 2, No 3 PP 22-30. May 2014, retrieved from www.eajornals.org [14] Kennedy, O. P., & Omoye, S.A., (2014). An appraisal of
Personal Income Taxation in Nigeria. Asian economic and financial review, 2014, 4(1), 33-41. Retrieved from http://aesswb.com/journal-detail.php
[15] Fjeldstad, O. H., & Semboja, J., (2001). Why people pay taxes: The case of the development levy in Tanzania, World Development, 29(1), 2059-2074.
[16] Edward, E.M., Christian, M. & Alex, I., (2014). Determinants of Tax Compliance: A Review of Factors and Conceptualizations. International Journal of Economics and Finance; Vol. 7, No. 9; 2015 ISSN 971XE-ISSN
1916-9728retrieved from
URL:http://dx.doi.org/10.5539/ijef.v7n9p207
[17] McKerchar, M.A. and Evans, C., (2009). Sustaining Growth in Developing Economies through Improved Taxpayer Compliance: Challenges for Policy Makers and Revenue Authorities. UNSW Law Research Paper, No. 2009-17. SSRN eLibrary. Available at: http://ssrn.com/abstract=1415164 [18] Okello, A., (2014). Managing income tax compliance through
self-assessment. IMF working paper, WP/14/41. aokello@imf.com
[19] Alabede, J., Zaimah, B. T., & Kamil, M. D., (2011). Does taxpayers financial conditions moderate determinant of tax compliance behaviour. British Journal of Economic, Finance and Management Sciences, vol1 (2) 2011 September.
[20] Boylan, S., & Sprinkle, G., (2001). Experimental Evidence on the Relation between Tax Rates and Compliance: The Effect of Earned vs. Endowed Income. Journal of the American Taxation Association, 23(1), 75-90.
[21] Moser, D.V., Evans III, J.H., & Kim, C.K., (1995). The effects of horizontal and exchange inequity on tax reporting decisions. The Accounting Review, 70(4), 619-634.
[22] Alm, J., Jackson, B., & McKee, M., (1992). Institutional uncertainty and taxpayer compliance. The American Economic Review, 82, 1018-1026.
[24] Jackson, B.R., & Milliron, V.C., (1986). Tax compliance research, findings, problems and prospects. Journal of Accounting Literature, 5, 125-155.
[25] Palil, M., & Mustapha, A., (2011). Determinants of Tax Compliance in Asia: A case of Malaysia. European Journal of Social Sciences, 24(1), 7-32.
[26] Bojuwon, M. (2010).The impact of tax fairness and demorgraphic factors on tax compliance in Nigeria, An MSc Thesis in Accounting, University of Utara, Malaysia.
[27] Fakile, S.A., (2011). Analysis of tax morale and tax compliance in Nigeria, Unpublished PHD thesis presented to Department of accounting, covenant university, Ota, Nigeria [28] Hair, J., Black, W. C., Babin, B. J., & Anderson, R. E., (2010).