Zheng, Y., Yang, S., Liu, X. Wang, J. Norton, T., Chen, J. and Tan, Y. 2018. The computational fluid dynamic modeling of downwash flow field for a six‐rotor UAV. Frontiers of Agricultural Science and Engineering, 5(2), pp.159‐167.
The computational fluid dynamic
modeling of downwash flow field for
a six-rotor UAV
by Zheng, Y., Yang, S., Liu, X. Wang, J. Norton, T.,
Chen, J. and Tan, Y.
Copyright, Publisher and Additional Information: Publishers version distributed under the terms of the Creative Commons Attribution License:
http://creativecommons.org/licenses/by/4.0/
DOI: https://doi.org/10.15302/J-FASE-2018216
RESEARCH ARTICLE
The computational
fl
uid dynamic modeling of downwash
fl
ow
fi
eld for a six-rotor UAV
Yongjun ZHENG (
✉
✉
)1, Shenghui YANG1,2, Xingxing LIU1, Jie WANG1, Tomas NORTON2, Jian CHEN1, Yu TAN (✉
✉
)11 College of Engineering, China Agricultural University, Beijing 100083, China 2 Department of Engineering, Harper Adams University, Newport TF10 8NB, UK
Abstract The downwash flow field of the multi-rotor unmanned aerial vehicle (UAV), formed by propellers during operation, has a significant influence on the deposition, drift and distribution of droplets as well as the spray width of the UAV for plant protection. To study the general characteristics of the distribution of the downwash airflow and simulate the static wind field of multi-rotor UAVs in hovering state, a 3D full-size physical model of JF01-10 six-rotor plant protection UAV was constructed using SolidWorks. The entire flow field surrounding the UAV and the rotation flow fields around the six rotors were established in UG software. The physical model and flow fields were meshed using unstructured tetrahedral elements in ANSYS software. Finally, the downwash flow field of UAV was simulated. With an increased hovering height, the ground effect was reduced and the minimum current velocity increased initially and then decreased. In addition, the spatial proportion of the turbulence occupied decreased. Further-more, the appropriate operational hovering height for the JF01-10 is considered to be 3 m. These results can be applied to six-rotor plant protection UAVs employed in pesticide spraying and spray width detection.
Keywords CFD simulation, downwash flow field, numerical analysis, plant protection, six-rotor UAV
1
Introduction
In the application of spraying during plant protection, the downwash flow field of multi-rotor unmanned aerial vehicles (UAV) directly drives the spraying droplets to the crop canopy. The coverage and distribution of the spray
can directly impact on the spray range as well as the deposition and drift of droplets, so the operational effectiveness of the UAV can be significantly affected[1]. Therefore, studying the distribution and interaction of the downwashflowfield over a crop canopy is an important prerequisite for using multi-rotor UAVs in plant protection. Recently, some research has focused on the distribution and properties of the downwashflowfield of UAVs used in plant protection. One of the main methods was to use a wind speed sensor array to collect wind speed data used for inversion modeling. Li et al.[2,3] used a wind speed collection system to collect the UAV wind speeds onX,Y andZaxis directions, and analyzed the distribution of the wind field and the influence from operational parameters on the windfield. Another approach was to use the method of Spatial Quality-balance. Wang et al.[4] conducted a practical test in the field. They collected the average distribution proportions of droplets in the top and bottom parts for upwind and downwind directions separately under different conditions. Although the proportions were utilized as analysis indicators, the sensor array was still applied for the study of wind field distribution. In real measurements, natural wind is one of the significant factors contributing to measurement errors, a problem that still needs to be resolved. Some studies used sensors to detect the distribution of droplets to verify the effect of down-wash airflow. Zheng et al.[5] used a laser scanner to measure the spray width of nozzles in a wind tunnel and establish a 3D outline model of the fogfields, offering an optional method to verify the entire distribution of downwash with high accuracy.
Numerical analysis and computational fluid dynamics (CFD) simulation has been widely used as a precise and intuitive simulation approach. Most of the studies contributed to the design and test of aerodynamic characteristics of fuselage and rotor. Lei[6] from the University of the Chinese Academy of Sciences, numeri-cally simulated and tested the fluid field of multi-rotor Received June 28, 2017; accepted November 11, 2017
Correspondences:[email protected], [email protected]
UAV. He analyzed the new dynamic characteristics of a six-rotor UAV incorporating two suggested non-planar dual-rotor units, and also qualitatively analyzed the influence from the aerodynamic interaction between multi-rotors on multi-rotor UAVs in a viscous low-Reynolds-number environment. Based on the analysis, the design was optimized. Wang et al.[7] adopted the method of numerical simulation of fluid dynamic to calculate numerically the 3Dflow field around the UAV and propeller engine. The overall temperature distribution of the UAV, the temperature and exhaust concentration of the propeller engine in the high temperature area were simulated. Qiao et al.[8] applied moving meshes and transition model in numerical simulation. They analyzed the conditions when the propeller was in front and behind the wing separately. The results were compared with the situation in which there was only a propeller or wing. Some other related studies have been conducted, such as the topological optimized method of the wing by Oktay et al.[9], the gradient optimized method for wings by James et al.[10], and the design of the UAV vessel and intake pipe CFD approach used by Papadopoulos et al.[11]. These works are valuable for UAV frame or rotor design, but few studies have focused on UAV operational conditions.
Other studies used CFD in some other areas, such as in an orchard spray assistant system, spray droplet distribu-tion simuladistribu-tion and equipment optimizadistribu-tion. For instance, Melese Endalew et al.[12,13]used CFD to analyze the drift of pesticides in orchards for an air-assisted spraying system for different spray types. Duga et al.[14] studied the verification and development of the drift and application of the CFD model. Dekeyser et al.[15]evaluated an orchard spraying system based on CFD and laboratory experi-ments. Bartzanas et al.[16] improved the crop production system using CFD. Delele et al.[17]studied the character-istics of droplets and influence on the plant surface using a CFD model. Although these studies were not in the same area, they offered useful information for the study of UAV spraying.
Recently, research has been initiated to simulate the
operation of plant protection UAV using CFD. Shi et al.[18] used this approach to study the major movement form and speed change of the downwash flow field for a small unmanned helicopter in ultra-low-altitude flight; Zhang et al.[19] simulated the deposition and drift of pesticide droplets under constrained conditions. An experiment in corresponding conditions was conducted to verify the simulated results, but the results need to be improved. Although numerical analysis already has been applied in UAV operation, there is limited CFD analysis related to the downwash flow field for multi-rotor plant protection UAVs.
Therefore, this paper used CFD numerical analysis to simulate the static wind fields of a six-rotor plant protection UAV at different hovering heights, to obtain the entire distribution of the downwash flow field at different hovering heights. By comparing the windfields at different hovering heights, the entire distribution pattern of windfields was established. Thesefindings could be used for the pesticide spraying as well as the spray width detection of the six-rotor plant protection UAV.
2
Construction of the full-size physical
model of the six-rotor plant protection UAV
2.1 Six-rotor plant protection UAV
A JF01-10 six-rotor plant protection UAV (Fig. 1;Table 1) was used as the subject for numerical simulation.
The main characteristics of JF01-10 UAV are shown in Table 1.
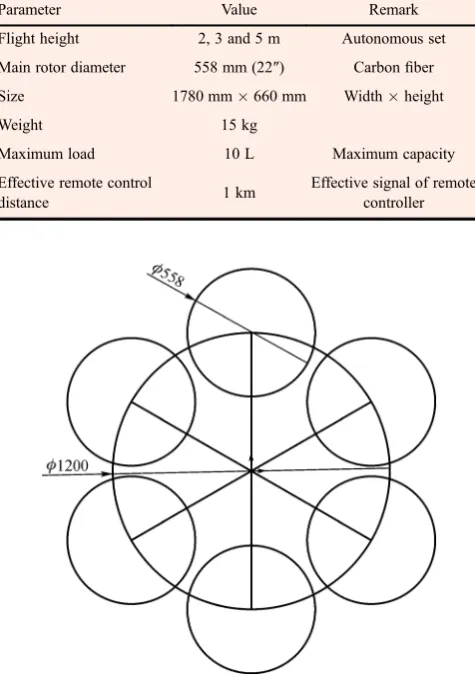
The relative positions between wheelbase and propellers are shown in Fig. 2. The wheelbase of the UAV was 1200 mm. The rotation diameter of each propeller was about 558 mm (22′′), and the angle between two adjacent arms is 60°. Six propellers are uniformly distributed on the circle, of which the central point of the frame was the center and the wheelbase is the diameter.
Fig. 1 JF01-10 plant protection UAV (a) and parts consisting of JF01-10 (b). [1] Flight control box; [2] Propeller; [3] Core circuits; [4] Electric motor; [5] Arm; [6] Battery cabin; [7] Pressure nozzle; [8] Pesticide tank; [9] Landing gear; [10] Pump.
2.2 Construction of full-size physical model
The 3D full-size physical model of JF01-10 six-rotor plant protection UAV was constructed in SolidWorks 2013. The model mainly consisted of three parts: main frame, arms and propellers. Under the premise of ensuring all characteristics, the model construction was simplified as much as possible, and all parts were constructed as solid parts so as to reduce the number of meshes and facilitate the following calculation.
2.2.1 Construction of the main frame and arms of the UAV
Dimensions of the central disk, arms, spray rods and undercarriage of the UAV are given inTable 2.
The three feet of undercarriage were located on the circle; the center coincides with the central disk and the diameter is 80 mm. Also, the three feet lie on the apices of an equilateral triangle. The full-size physical model was constructed according to the dimensions provided in Table 2and shown inFig. 3.
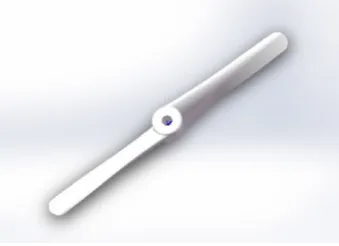
2.2.2 Full-size physical model of propellers
According to the literature, to design and analyze the structure and dynamic properties of propellers, the exact propeller model should be used, while in the analysis of wind field and pressure distribution produced by the propeller, a simplified model could be used[18,20]. This study concentrated on the entire distribution of UAV downwashflowfield, so the driving electric motor and the propeller were fused together to simplify the model. This not only meets the simulation requirement of entire flow
field, but also fully considered the detailed influence from the motors on theflowfield around the propeller.
The length of the propeller was about 558 mm (22′′), and its geometric pitch was about 140 mm (5.5′′), with a standard cross section, driving electric motor diameter of 117.4 mm, and height of 96 mm. The 3D model is shown inFig. 4.
Table 1 Main parameters of JF01-10
Parameter Value Remark
Flight height 2, 3 and 5 m Autonomous set
Main rotor diameter 558 mm (22″) Carbonfiber Size 1780 mm660 mm Widthheight
Weight 15 kg
Maximum load 10 L Maximum capacity
Effective remote control
distance 1 km
Effective signal of remote controller
Fig. 2 Wheelbase and propellers
Table 2 Dimensions of UAV main parts
Part Size/mm Remark
Central plate 3003003 Lengthwidth thick-ness, chamfering R100
UAV long arm 500f30
UAV short arm 472.5f30
Spray rod 1000f12 10° with undercarriage
Undercarriage f25 Length was calculated from other values
2.2.3 Full-size physical model of the UAV
The propellers, arms and the main frame of the UAV were assembled in SolidWorks 2013, and different colors were applied to different parts, after which the full-size physical model of the UAV was established and shown asFig. 5.
3
Partition of the
fl
uid
fi
eld and meshes
3.1 Partition of thefluidfield
As shown in Fig. 5, the six-rotor UAV consisted of 6 groups of propellers (rotational parts) and other supporting and auxiliary mechanical structures (fixed parts). Thefluid
field is the space where thefluid passes through. Therefore, in the CFD simulation, all these solid parts inFig. 5were removed from thefluidfield. Based on the structure and dimensions of the UAV, the totalfluid field was divided into the rotational domain and afixed domain.
Given the UAV’s maximum diameter of D, considering the size of space to be simulated, the total windfield was set to be a cylindrical region with a diameter of 10D. According to the goal of simulation, the wind field was separated into upwind and downwindfields. The height of upwind field was set to 5 D, while the height of the downwind field was set at 2, 3 and 5 m, and unlimited height.
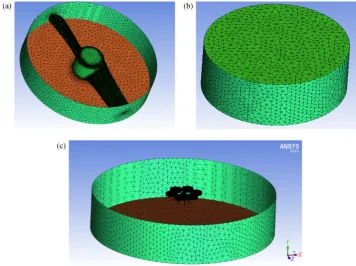
The fluid field was partitioned in UG engineering
software as shown in Fig. 6, which shows the totalfield partition, where the middle part was the UAV and the rotation domain. The section between the upwind and downwind fields was the boundary region. Figure 6b shows the rotation domains of six propellers. The partition of downwashfield is shown inFig. 6c.
3.2 Construction of the model meshes
Based on the previous partition offluidfield, the meshes were generated in ANSYS software. Considering the efficiency and the fact that the relative dimensions of the supporting part and accessories were small, an unstruc-tured tetrahedral element was adopted. The meshes on the small surface were increased. The resultant meshes are shown inFig. 7; the total number of nodes was 4248871, and total number elements was 21141012.
4
Numerical calculation
4.1 SST turbulence model
In the two-equation eddy viscous turbulence model, the k–εmodel can reliably simulate the full developedflow of turbulence far from the wall, while the k–ω model is widely adopted in solving problems for boundary layers in different pressure gradients. To take advantage of the merits of both models, Menter first proposed the SST turbulence model[21], and subsequently this combined model has been gradually and widely accepted in engineering.
The SST turbulence model kept thek–ωmodel near the wall, whilek–εmodel was applied far from the wall, after which the two models were combined together with a switching function F1. So the model is expressed as follows:
Dk Dt ¼
∂
∂xj ðþktÞ
∂k
∂xj
þτ∂ui ∂xj–β
*ωk:::::: (1)
Dω
Dt ¼
∂
∂xj ðþωtÞ
∂ω ∂xj
þ g vtτij
∂ui ∂xj –βω2
þ2ð1–F1Þω2 1
ω ∂k
∂xj ∂ω ∂xj
:::::: (2)
In Eq. (2), the turbulence shear stress is τij¼
t ∂ui ∂xj þ
∂uj ∂xi –
2 3
∂uk ∂xkδij
–2
3kδij and eddy viscosity
coefficient isvt¼ k ω.
Equations (1) and (2) were combined by the switching functionF1. In other words,F1was 1 if it was nearest the wall and then activated the k–ω model, while F1 was
Fig. 4 3D model of the propeller
Fig. 5 Full-size physical model of the UAV JF01-10
Fig. 6 Partitioning offluidfield. (a) Totalfield portioning; (b) rotationfluid domain; (c) downwashfield.
approaching 0 when the layer was away from the wall, activating thek–εmodel. Givenf1,f2as the constants in k–ω model and transformed k–ε model, respectively, the constantfin the combined model is:
f¼F1f1þ ð1–F1Þf2:::::: (3)
The switching functionF1is defined as:
F1¼tanhðarg41Þ:::::: (4)
arg1 ¼min max
ffiffiffi
k p
0:09ωy, 500v
y2ω
!
,4ω2k CDkωy2
" #
:::::: (5)
CDkω¼max 2ω2 1
ω ∂k
∂xj ∂ω ∂xj
,10–20
:::::: (6)
In Eq. (5), yis the minimum distance from the present point to the wall.
To consider the effect of turbulent stress transfer, for the position where turbulent kinetic energy is generated more than dissipated, the eddy viscosity is limited and redefined:
vt¼
a1k
maxða1ω,jΩjF2Þ:::::: (7)
In Equation (7),jΩj is the scalar constant for the eddy tensor,F2is:
F2¼tanhðarg22Þ:::::: (8)
arg2¼max 2
ffiffiffi
k p
0:09ωy, 500v
y2ω
!
:::::: (9)
4.2 Calculation environment and boundary condition
The working medium for the simulation was set as air, and the temperature was set to a constant 25°C. The heat transfer was ignored, and the relativeflow pressure at inlet and outlet were set at zero. Since the simulation was for a six-rotor plant protection UAV in hover state, the entire calculation domain was set to 0 speed. Meanwhile, the outer wall was set by the non-slip boundary. The rotational velocity was set to 1500 r$min–1
and the rotational axis and the direction of the rotating were set by real conditions. Furthermore, the boundary between the rotational and
fixed domains was set to be thefixed-rotational boundary type, and the SST turbulence model was adopted to calculate 1000 steps, of which the convergence require-ment was 10–4.
5
Analysis of the simulation results
5.1 The simulation results
The numerical analysis results of the downwash flow
field for the multi-rotor UAV are shown in Fig. 8, where
Fig. 8a–8dare the distributions offlow speeds for different hovering heights of 2, 3 and 5 m, and the relative boundless height, respectively.
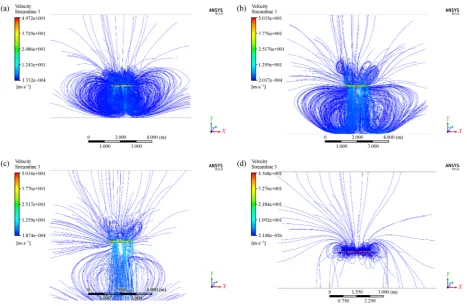
The corresponding vector streamline diagrams of the downwash flow fields for different hovering heights are shown inFig. 9, in whichFig. 9a–9dare the distributions of flow speeds for different hovering heights of 2, 3 and 5 m, and the relative boundless height, respectively.
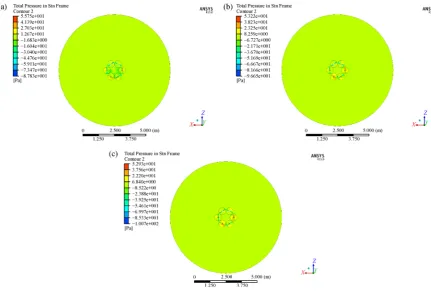
The pressure distributions around the multi-rotor UAV at different heights, 2, 3 and 5 m, respectively, are shown in Fig. 10. Given the infinite height of the assumed relative boundless height, its result was not calculated or shown.
5.2 Analysis of the results
The distributions of speeds for the multi-rotor UAV were complex (Fig. 8). With the increase in height, the minimum
flow speeds were 1.33210–4
, 2.01710–4
, 1.87410–4 and 2.14810–26m$s–1respective for hovering heights of 2, 3 and 5 m, and the relative boundless height. The trend of the minimum flow speed increased at first and then decreased till it approached 0. However, beside the boundless height, all the minimum flow speeds were of the order of 10–4m$s–1. Thus, the increase of the hovering height did not have a significant influence on the minimum
flow speed.
With increased hovering height, the density of the streamlines reflected by the ground decreased (Fig. 8). Therefore, it could be inferred that with increased hovering height, the ground effect decreased and the flowing velocity became more concentrated until decreasing to 0 when the hovering height was boundless.
Regardless of the hovering height, the windflow entered the region of rotors from above and exited downward (Fig. 9). However, as the hovering height increased, the ground effect decreased, and the fluid field was more uniformly distributed, so that the central part was more concentrated and moved vertically downward. Moreover, the turbulence in the fluid field was more stable, but the proportion of space occupied by the turbulence decreased compared to the whole downwash flowfield of the UAV. When the hovering height was boundless, the entireflow
field moved downward without turbulence.
The relative pressure (indicated by the color of the largest circular area inFig. 10) around the multi-rotor UAV changed from 12.67 to 8.259, and 6.840 Pa, as the hovering height changed from 2 to 5 m, showing a decreasing trend. Finally, the relative pressure approached 0, when the height was boundless.
5.3 Discussion
Increased hovering height led to a more uniform and symmetric downwash flow field. Therefore, the flight control of the multi-rotor UAV in both manual and auto modes became less difficult, due to the reduction in the
influence from the ground effect. This result is consistent with previous research[22,23]. Moreover, the pesticide can be sprayed more uniformly, potentially resulting in better crop protection outcomes, which is also consistent with results of earlier research[4].
With increased hovering height, the pressure around the multi-rotor UAV decreased, leading to reduced resistance to the spray droplets, which can influence the penetration of spray droplets. Additionally, the deposition of the droplets decreased and the uniformity as well as the penetration of droplets decreased[24], as the spray width increased.
For practical spraying, the selection of the UAV operation parameters should guarantee the uniformity and penetration of droplets. Meanwhile, the turbulence caused by the ground will be important, so that droplets can be deposited on the underside of leaves. Moreover, the spray width should be a reasonable value, otherwise a small spray width will increase the spraying duration. Considering these factors and the results for the JF01-10 six-rotor plant protection UAV, the best hovering height is considered to be about 3 m. This can be validated by comparing experimental results infield studies.
It is difficult for the existing equipment to detect the whole distributions of the downwash flow field in real-world experiments. However, the miniature UAV model
may be utilized to develop the airflow because of its consistent proportions. Laser doppler velocimetry (LDV) could also be used in experiments to detect the distribu-tions of airflow.
6
Conclusions
This study simulated the downwashflowfield of a multi-rotor UAV intended for practical spraying operations by establishing a full-scale physical model as well as by numerical analysis. The downwashflowfields at different hovering heights were simulated and analyzed.
It is concluded that the current speeds and streamline distributions of UAV are relatively complex. As hovering height increased, the minimum current velocity increased then decreased. Also, the pressure around the UAV and the ground effect decreased. As a result, the flight control is facilitated and the turbulence is more stable, but the space proportion occupied is reduced.
Also, as a result of increased hovering height, factors, such as spray range, deposition uniformity and penetration, limit each other, which could affect the spatial distribution of droplets and thus influence the effectiveness of the spraying. In practical operation, JF01-10 UAV using a hovering height of 3 m is likely to be appropriate.
Fig. 9 Streamline vectors for different hovering heights of 2 m (a), 3 m (b), 5 m (c), and the relative boundless height (d)
Fig. 10 Pressure nephogram at 2 m (a), 3 m (b), and 5 m (c) hovering height
Acknowledgements This research were supported and funded by The National Key Research and Development Program of China (2016YFD02 00700) from China Ministry of Science and Technology, and The Fundamental Research Funds for the Central Universities (2015TC036 and 2017QC139), helped by VIGA UAV Company (Beijing).
Compliance with ethics guidelines Yongjun Zheng, Shenghui Yang, Xingxing Liu, Jie Wang, Tomas Norton, Jian Chen, and Yu Tan declare that they have no conflicts of interest orfinancial conflicts to disclose.
This article does not contain any studies with human or animal subjects performed by any of the authors.
References
1. An J, Xiang W, Han Z W, Xiao K T, Wang Z F, Wang X H, Wu J B, Yan P Z, Li J, Chen Y, Li J, Li Y. Validation of the Institute of Atmospheric Physics emergency response model with the meteor-ological towers measurements and SF6 diffusion and pool fire experiments.Atmospheric Environment, 2013,81: 60–67 2. Li J Y, Zhou Z Y, Lan Y B, Hu L, Zang Y, Liu A M, Luo X W,
Zhang T M. Distribution of canopy windfield produced by rotor unmanned aerial vehicle pollination operation.Transactions of the Chinese Society of Agricultural Engineering, 2015,31(3): 77–86 (in
Chinese)
3. Li J Y, Zhou Z Y, Hu L, Zang Y, Xu S, Liu A M, Luo X W, Zhang T M. Optimization of operation parameters for supplementary pollination in hybrid rice breeding using round axis multi-rotor electric unmanned helicopter. Transactions of the Chinese Society of Agricultural Engineering, 2014, 30(11): 1–9 (in Chinese)
4. Wang C L, He X K, Wang X N, Jane B, Andreas H, Wang Z G, Pan H Y, He Z Z. Testing method of spatial pesticide spraying deposition quality balance for unmanned aerial vehicle.Transactions of the Chinese Society of Agricultural Engineering, 2016,32(11): 54–61 (in Chinese)
5. Zheng Y J, Yang S H, Lan Y B, Clint H, Zhao C J, Chen L P, Liu X X, Tan Y. A novel detection method of spray droplet distribution based on LIDARs. International Journal of Agricultural and Biological Engineering, 2017,10(4): 54–65
6. Lei Y. Aerodynamics of a Hex-rotor SUAV: Numerical Simulation and Experimental Study. Dissertation for the Doctoral Degree, Jilin:
Changchun Institute of Optics, Fine Mechanics and Physics Chinese Academy of Sciences,2013
7. Wang W H, Li J L, Wang C, Lv Y M, Wang G F, Liu G M. Three dimensionfluidfield numerical simulation for airscrew unmanned aircraft vehicle.Infrared Technology, 2012,34(5): 292–296 8. Qiao Y H, Ma D L, Li Z. Unsteady numerical simulation of
propeller/wing interaction.Journal of Aerospace Power, 2015,30
(6): 1366–1373
9. Oktay E, Akay H U, Sehitoglu O T. Three-dimensional structural topology optimization of aerial vehicles under aerodynamic loads.
Computers & Fluids, 2014, (92): 225–232
10. James K A, Kennedy G J, Martins J R R A. Concurrent aerostructural topology optimization of a wing box.Computers & Structures, 2014, (134): 1–17
11. Papadopoulos F, Valakos I, Nikolos I K. Design of an S-duct intake
for UAV applications. Aircraft Engineering and Aerospace Technology, 2012,84(6): 439–456
12. Melese Endalew A, Debaer C, Rutten N, Vercammen J, Delele M A, Ramon H, Nicolaï B M, Verboven P. Modelling pesticideflow and deposition from air-assisted orchard spraying in orchards: a new integrated CFD approach. Agricultural and Forest Meteorology, 2010,150(10): 1383–1392
13. Melese Endalew A, Debaer C, Rutten N, Vercammen J, Delele M A, Ramon H, Nicolaï B M, Verboven P. A new integrated CFD modelling approach towards air-assisted orchard spraying—Part II: validation for different sprayer types.Computers and Electronics in Agriculture, 2010,71(2): 137–147
14. Duga A T, Delele M A, Ruysen K, Dekeyser D, Nuyttens D, Bylemans D, Nicolaï B M, Verboven P. Development and validation of a 3D CFD model of drift and its application to air-assisted orchard sprayers.Biosystems Engineering, 2017,154: 62–75
15. Dekeyser D, Duga A T, Verboven P, Endalew A M, Hendrickx N, Nuyttens D. Assessment of orchard sprayers using laboratory experiments and computationalfluid dynamics modelling. Biosys-tems Engineering, 2013,114(2): 157–169
16. Bartzanas T, Kacira M, Zhu H, Karmakar S, Tamimi E, Katsoulas N, Lee Bok I, Kittas C. Computationalfluid dynamics applications to improve crop production systems. Computers and Electronics in Agriculture, 2013,93: 151–167
17. Delele M A, Nuyttens D, Ambaw A, Lebeau F, Nicolai B M, Verboven P. Studying the impact characteristics of spray droplets on plant surfaces using a multiphase CFD model.Aspects of Applied Biology, 2016, (132): 291–298
18. Shi Q. Numerical simulation for downwashfluidfield of small-size unmanned helicopter hedgehopping. Journal of Drainage and Irrigation Machinery Engineering, 2015, 33(6): 521–525 (in Chinese)
19. Zhang S C, Xue X Y, Qin W C, Sun Z, Ding S M, Zhou L X. Simulation and experimental verification of aerial spraying drift on N-3 unmanned spraying helicopter. Transactions of the Chinese Society of Agricultural Engineering, 2015, 31(3): 87–93 (in Chinese)
20. Wu J Q. Quadrotor layout on cross lifting body integrated design and investigation of aerodynamic characteristic. Dissertation for the Master Degree. Jiangsu: Nanjing University of Aeronautics and Astronautics, 2009 (in Chinese)
21. Menter F R. Zonal Two Equation κ–ω Model for aerodynamic
flows. AIAA Paper 93–2906, 24th Fluid Dynamics Conference, Orlando, FL, 1993, 69
22. Wu Z, Wu T W. Influence of downwashflow on helicopter airborne missile initial trajectory. Journal of Projectiles, Rockets, Missiles and Guidance, 2009,29(1): 202–204 (in Chinese)
23. Qin Y H, Zhu Q H, Shao S. Aerodynamic characteristics analysis for hovering coaxial rotors in ground effect. Journal of Nanjing University of Aeronautics & Astronauts, 2015,47(2): 266–274 24. Qin W C, Xue X Y, Zhou L X, Zhang S C, Sun Z, Kong W, Wang B
![Fig. 1JF01-10 plant protection UAV (a) and parts consisting of JF01-10 (b). [1] Flight control box; [2] Propeller; [3] Core circuits;[4] Electric motor; [5] Arm; [6] Battery cabin; [7] Pressure nozzle; [8] Pesticide tank; [9] Landing gear; [10] Pump.](https://thumb-us.123doks.com/thumbv2/123dok_us/9929600.1980434/3.595.92.491.565.710/protection-consisting-propeller-circuits-electric-battery-pressure-pesticide.webp)