www.fm.viamedica.pl O R I G I N A L A R T I C L E
Address for correspondence: Maciej Równiak, Department of Comparative Anatomy, University of Warmia and Mazury, Plac Łódzki 3, 10–767 Olsztyn, Poland, tel: +48 89 523 32 98, e-mail: [email protected]
A morphometric study of the amygdala
in the common shrew
Maciej Równiak, Stanisław Szteyn, Anna Robak
Department of Comparative Anatomy, University of Warmia and Mazury, Olsztyn, Poland
[Received 27 January 2004; Revised 5 October 2004; Accepted 5 October 2004]
The characteristic features of the common shrew amygdala (CA), as shown by volumetric comparisons of the individual nuclei, are the poor development of the lateral (LA) and basomedial (BM) nuclei as well as the particularly strong formation of the basolateral (BL) and lateral olfactory tract (NLOT) nuclei. The central (CE), cortical (CO) and medial (ME) nuclei are also well organised in this species. All these features are even more distinctly visible when the total num-ber of neurons in the nuclei referred to are compared. A comparison of the densities of neurons in the individual nuclei with the mean numerical density of cells in the CA indicates that there are the 3 different regions within the com-mon shrew’s CA. The densities of neurons in the LA, BL, and BM are significantly lower than the mean density of cells in the CA (p < 0.05). In the CE this value does not differ from the mean (p > 0.05). In the CO, ME and NLOT the density values are significantly higher than the mean (p < 0.05). Furthermore, a similar division of the shrew’s CA can, to some extent, be performed using the size parameters of the amygdaloid neurons as a marker. Interestingly, the large neu-rons populate less densely organised CA areas like the LA, BL and BM, whereas the small cells populate the ME and NLOT, where the neurons are densely ar-ranged. The CE and CO occupy intermediate positions, with the neurons similar in size to the mean for the shrew’s CA.
Key words: amygdala, common shrew, morphometric analysis, 3-D reconstructions
INTRODUCTION
The amygdala (CA) is an extremely complicated and highly organised collection of nuclei and corti-cal areas, varying in relation to cellular structure [11, 18, 22, 25], connections [56, 68] and neurotrans-mitters expression patterns [2, 41, 43, 45, 46, 52, 55, 68]. It is currently suggested that there are more than 10 separate structures within the CA [56]. The cellular organisation of these areas is often so diver-sified that they require additional divisions [18, 25, 56, 68].
In spite of the large amount of data dedicated to the CA, quantitative aspects of its organisation have
restrict-ed to insectivora and primates only and, moreover, concern exclusively larger areas of the CA than the single nuclei. Of the individual structures only the NLOT and the large-celled portion of the BL are tak-en into account. Quantitative aspects of the cellular populations in the mammalian CA have so far re-ceived even less attention. For instance, to date no detailed data concerning the density of neurons in the individual CA nuclei are, to our knowledge, avail-able. Where reports on this subject do exist, they are dedicated only to the selectively stained and high-ly specialised subpopulations of amygdaloid inter-neurons [2, 41, 46, 55]. The total number of neu-rons in the CA has only been studied in the selected amygdaloid nuclei of the rat [62]. The size of amygda-loid neurons is usually reported by Golgi studies [22, 38, 49]. However, this technique stains only 3–5% of neurons from the total cellular population in the area studied and the stained sample is not necessar-ily representative [64]. A detailed morphometric anal-ysis of the amygdaloid neurons has only been car-ried out by Dziewiątkowski et al. on the rabbit [11]. The aim of our study, therefore, was to give the first detailed morphometric characteristics of the CA in the common shrew. Since most mammalian spe-cies are thought to have had their phylogenetic ori-gin in insectivore-like ancestors, the data on the com-mon shrew can represent a good reference base for evaluating the different trends in brain structure evolution during mammalian phylogeny.
MATERIAL AND METHODS
A total of 6 brains were used to study the mor-phometric parameters of the CA in the common shrew. All efforts were made to minimise animal suffering and to minimise the number of animals used. The brains were removed from the skulls, em-bedded in paraffin and sectioned in 50 µm thick slices in the coronal plane.
All sections were analysed cytoarchitectonically and morphometrically with a calibrated image anal-ysis system consisting of a computer equipped with morphometric software (Multi-Scan 8.2, Computer Scanning Systems, Poland) and a light microscope coupled with a digital camera (CM40P, VideoTronic, Germany). The sequence of the successive operations in the single animal is described in detail below.
The three-dimensional reconstructions of the CA. The microscopic fields were viewed at low mag-nification through the 5-fold objective. The 512 ¥ 512 pixel partial microscopic images of a single section were digitally recorded by means of a camera
cou-pled with a microscope and computer. The scans were subsequently joined with those of neighbouring sec-tions to form larger areas comprising the whole CA and adjoining structures (so-called “digital slices”). All the available sections were taken into account.
The digital slices were registered by means of TPS (USA) and Morpheus (USA) morphometric software according to the Generalised Procrustes Analysis (GPA) that superimposes the landmark configura-tions using the least-squares estimates for the trans-lation and rotation parameters [3, 13, 57, 58]. To achieve maximum precision, the slices were regis-tered in pairs. The first image in the pair was the reference slice for the second slice. The landmark configurations were generated on both slices in the pair. The data consisted then of the point’s co-ordi-nates in the reference slice and the corresponding landmarks in the unregistered target slice. The sec-ond slab in the pair was translated and rotated into alignment based on these landmarks with the help of the built-in Morpheus GPA procedure. After reg-istration the second slice in the pair was the refer-ence slice in the next pair. The sequrefer-ence was then as follows: 1–2, 2–3, 3–4 ….75–76.
All the registered digital slices of the CA in the single animal were incorporated into one multi-sliced 3-dimensional image (a so-called “stack”). In this kind of 3D data set the digital slices were the consecutive serial sections oriented in perpendicular to the long axis of the CA and covering its whole rostrocaudal extent. On each digital slice the boundaries of the individual amygdaloid nuclei were outlined with dif-ferent colours by a mouse-driven cursor. All the out-lines were drawn under the control of the light mi-croscope. The definite stack was then composed of the serially aligned raw images and the incorporat-ed outlinincorporat-ed structures of the CA. With the help of the IGL Trace software the 2-dimensional outlines were transformed to the 3-dimensional slabs. The 3-dimensional reconstruction of the CA for the single animal was simply a sum of all the serially aligned slabs. The volumetric analysis. To evaluate the volume of the individual amygdaloid nuclei the volumes of slabs traced with the same colour were totalled according to the formula proposed by Cavaliero [14, 32]. The total CA volume presented in this study was the sum of the volumes of the 7 amygdaloid nuclei studied, namely the lateral, basolateral, baso-medial, central, cortical, medial and lateral olfactory tract nuclei.
nuclei, the optical dissector method was implement-ed with the guidelines describimplement-ed by West et al. [71]. Evaluation of the total numbers of neurons. The total numbers of neurons in each of the nuclei was calculated by multiplying the volume of the giv-en nucleus by the numerical dgiv-ensity of cells in it [71]. The morphometric parameters of neurons. In each of the individuals studied the morphometric analysis of CA neurons was performed using Multi-Scan 8.2 morphometric software. Each neuron was characterised by a set of morphometric parameters: the length (the long axis of the soma), the width (the short axis of the soma), the size (the sum of both axes) and the shape factor (the ratio of both axes). The test frames were arranged this way to cover the total cross-sectional area of the nucleus studied. In the common shrew 5 cross-sections per nucleus in the single animal were taken into account. The statistical analysis. The statistical analysis was performed using CSS: Statistica v.5.0 (Statsoft, USA). The analysis of variance (Anova) was performed fol-lowed by post hoc tests (Duncan’s post hoc analysis) and planed comparison tests (Student’s paired t-test) between the consecutive pairs of means. The level of the statistical significance was set at p < 0.05. To evaluate the precision of all measurements the coef-ficient of error was calculated. Values below 0.1 were achieved for all the parameters examined.
RESULTS
The nuclear pattern of the common shrew’s CA
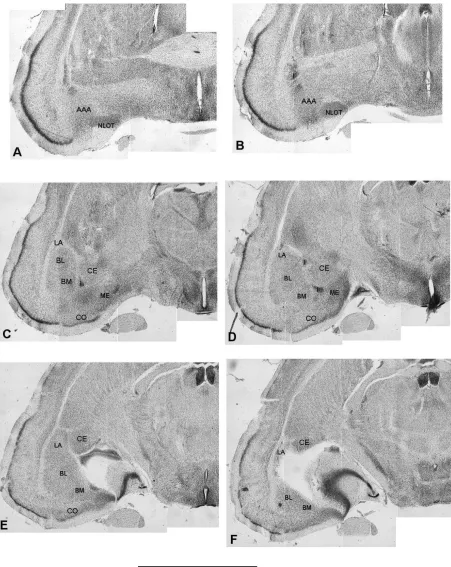
The position of the various amygdaloid nuclei in the common shrew’s CA and the pattern of their de-limitations are shown in Figure 1 and 2, respectively. CA of the common shrew can be portioned into 10 nuclei, classified according to the similarities in the cellular structure into 3 distinct groups: the ba-solateral (BLC), central (CC) and corticomedial (CMC). BLC is composed of the lateral (LA), basolateral (BL) and basomedial (BM) nuclei. The anterior amygdal-oid area (AAA) as well as the central (CE) and inter-calated nuclei (I) were included in CC. CMC are com-posed of the cortical (CO) and medial nuclei (ME) as well as the nucleus of the olfactory tract (NLOT) and the amygdalo-hippocampal area (AHA).
The position, general morphology and cellular structure of these different regions in the shrew’s CA as well as their parcellation into the finer parts are very similar to those described by Krettek and Price in the rat [25]. Briefly, for the more subtle dif-ferences in density and cell size, LA, BL and BM are
further subdivided into the anterior (LAa, BLa and BMa) and posterior (LAp, BLp and BMp) parts. Two subdivisions can also be distinguished within the CE of the shrew, although the boundaries between them are less sharp than within the basolateral nuclei. The medial part (CEm) is located more rostrally and is composed of the larger, darker and more tightly packed cells. The lateral part (CEl) contains the small-er, lighter and more loosely arranged neurons. Fi-nally, CO consists of 3 distinct regions: the anterior cortical nucleus (COa), the periamygdaloid cortex (COc) and the posterior cortical nucleus (COp). The ME, NLOT, AHA and AAA are homogenous regions. Although the borders of the various nuclei in the shrew’s CA were generally easy to recognise, some CA regions were poorly delineated from the sur-rounding nuclei. As a result of general delimitation problems, such structures as AAA, AHA and I were excluded from the volumetric investigation in the present study. The minor difficulties which were en-countered in delineating the boundary between BM and CO as well as the rostral borders of ME and CE were overcome by taking into consideration the bor-ders in the adjacent sections. Since all the sections are serially aligned, the additional support in delin-eating the obscure portions in the shrew’s CA pro-vided thick digital sections (200-300 µm) composed from single 50 µm digital scraps.
The morphometric parameters of the CA of the common shrew
The morphometric data concerning individual CA nuclei are listed in the subsequent rows of Table 1. The values for CA as a whole are presented in the last row.
Volume. The characteristic features of the com-mon shrew’s CA are poor development of LA and BM, whereas BL and NLOT are particularly strongly formed. CE, CO and ME also appear well developed in this species. The smallest average volume in the common shrew’s CA is that of BM, while the largest is that of BL. According to the raw volumetric mea-surements and percentages, almost all the nuclei studied are significantly different (p < 0.05), although BL does not differ statistically from CO (p > 0.05).
Figure 1. The position of the various amygdaloid nuclei in the common shrew’s CA. A–F the subsequent coronal sections through the common shrew’s CA in the rostro-caudal direction. Scale bar: 1 mm
CA. The densities of neurons in LA, BL and BM are significantly lower than the mean density of cells in CA (p < 0.05). In CE it does not differ from the mean (p > 0.05). In the CO, ME and NLOT these
cells in the CO is also statistically similar to that in CE and NLOT (p > 0.05).
The total number of neurons. The smallest num-ber of neurons in the common shrew’s CA is in BM, whereas the largest cellular population is in CO. It should be added that according to the raw mea-surements and percentages almost all the nuclei studied are significantly different (p < 0.05), al-though ME does not differ statistically from CE and CO (p > 0.05).
The morphometric parameters of neurons in the common shrew’s CA
The morphometric parameters of neurons in in-dividual CA nuclei are listed in the subsequent rows of the Table 2. The mean values for CA are present-ed in the last row.
The length of neurons. The smallest average length of the soma in the common shrew’s CA is displayed by the neurons located in the I. The cells in BL are the longest. The average lengths of neurons in LA, BL and BM are significantly higher than the length
of the mean CA neuron (p < 0.05). These values in CE (p > 0.17) and CO (p > 0.73) do not differ statis-tically from the mean. In the remaining nuclei the average lengths of neurons are significantly lower than the mean (p < 0.05). According to this param-eter almost all the nuclei studied are significantly dif-ferent (p < 0.05), although CE does not differ statis-tically from CO (p > 0.05).
The width of neurons. The smallest average width of the soma in the common shrew’s CA is displayed by the cells in the I, whereas the largest perikarya, according to this parameter, are present in BL. The average width of neurons in LA, BL, BM and CO is significantly higher than the width of the mean CA neuron (p < 0.05). In the remaining nuclei these val-ues are significantly lower than the mean (p < 0.05). According to this parameter, all the nuclei studied are significantly different (p < 0.05).
The average size of neurons. The size of the neuron in the common shrew’s CA can be expressed by the sum of the length and width of the soma. The smallest size values in the common shrew’s CA are
Figure 2. 3-D reconstruction of the common shrew CA: A, B, C — rostral, postero-medial and caudal views respectively
Table 1. The morphometric parameters of thę individual amygdaloid nuclei of the common shrew CA.
Nucleus Volume (mm3) Percentage Numericał Total number Percentage
of volume (%) density (N/mm3) of neurons (N) of neurons (%)
LA 0.07 ± 0.01 10.78 ± 0.5 195799 ± 8888.56 14052.6 ± 2476.68 8.68 ± 0.74
BL 0.14 ± 0.02 20.64 ± 0.92 182643.3 ± 7412.85 25054.97 ± 4048.09 1531 ± 1.43
BM 0.05 ± 0.01 7.25 ± 0.66 195140.1 ± 9548.45 9412.14 ± 1710.36 5.82 ± 0.68
CE 0.12 ± 0.02 17.97 ± 0.79 253820.4 ± 141 80.9 30249.45 ± 4336.92 18.72 ± 1.12
CO 0.13 ± 0.01 19.62 ± 1.06 262600.3 ± 121 81.3 34073.61 ± 4034.12 21.18 ± 1.75
ME 0.1 ± 0.01 14.53 ± 0.29 332239.8 ± 13178.05 31889.83 ± 2904.33 19.82 ± 0.6
NLOT 0.06 ± 0.01 9.22 ± 0.2 271280.3 ± 13426.71 16515.4 ± 1431.85 10.27 ± 0.48
CA 0.66 ± 0.08 100 ±0 241931.9 ±5210.85 161248 ±18111.13 100 ±0
found in the cells in I. The neurons in BL are the larg-est. The average sizes of neurons in LA, BL and BM are significantly higher than the size of the mean CA neu-ron (p < 0.05). This value in CO does not differ statis-tically from the mean (p > 0.06). In the remaining nuclei the average sizes of neurons are significantly lower than that of the mean CA neuron (p < 0.05). According to this parameter almost all the nuclei stud-ied are significantly different (p < 0.05). LA alone does not differ statistically from BM (p > 0.05).
The shape of neurons. The shape of the neuron in the common shrew’s CA can be expressed by the ratio of the length and width of the soma (the shape factor). The smallest average value of this coefficient was noted in the I, whereas the largest mean was observed in CE. The shape factor values in BL, BM, CE and NLOT are significantly higher than the mean value in the shrew’s CA (p < 0.05). In the remaining nuclei these values are significantly lower than the mean (p < 0.05). According to this parameter almost all the nuclei studied show significant differences (p < 0.05). BM, however, does
Table 2.The morphometric parameters of the neurons in the individual amygdaloid nuclei of the common shrew CA
Nucleus Length Width Size Shape of neurons [mmmmmm] of neurons [mmmmmm] of neurons [mmmmmm] of neurons
LA 13,3 ± 0.78 8.82 ± 0.55 22.19 ± 1.65 1.51 ± 0.09
BL 15.44 ± 0.44 9.1 ± 0.48 24.54 ± 0.92 1.70 ± 0.05
BM 13.78 ± 0.48 7.98 ± 0.69 21.76 ± 1.13 1.73 ± 0.09
CE 11.45 ± 0.51 6.24 ± 0.28 17.78 ± 0.94 1.84 ± 0.09
CO 1134 ± 0.53 7.18 ± 0.46 18.52 ± 0.99 1.58 ± 0.02
I 6.24 ± 0.55 4.55 ± 0.39 10.79 ± 0.78 1.37 ± 0.09
ME 8.71 ± 0.32 5.71 ± 0.21 14.42 ± 0.34 1.53 ± 0.09
NLOT 10.53 ± 0.79 6.18 ± 0.53 16.71 ± 0.64 1.70 ± 0.09
CA 11.35 ± 2.93 6.97 ± 1.59 18.34 ± 4.48 1.62 ± 0.15
not differ statistically from BL and NLOT (p > 0.05), nor does LA differ statistically from ME (p > 0.05).
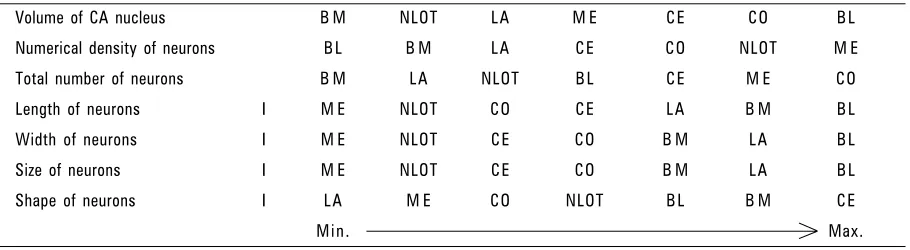
The following represents the common shrew’s CA nuclei series according to the increasing values of the morphometric parameters (Table 3).
DISCUSSION
Comparison of the present results with those obtained in previous studies. This is the first inves-tigation that provides a detailed morphometric anal-ysis of the 8 nuclei in the common shrew’s CA. The only previous quantitative studies of the shrew’s CA were proposed by Stephan et al. [65–67] in a series of comparative reports. However, these reports pro-vided only selective volumetric measurements on the total size of CA and some of its larger components. Of the finer parts of CA only NLOT and the large-celled portion of BL were analysed. To our knowl-edge, no morphometric data concerning the num-ber, density and size of the neurons in the common shrew’s CA have been available to date.
Table 3. The arrangement of the common shrew’s CA nuclei according to the increasing values of the morphometric parameters
Volume of CA nucleus B M NLOT L A M E C E C O B L
Numerical density of neurons B L B M L A C E C O NLOT M E
Total number of neurons B M L A NLOT B L C E M E C O
Length of neurons I M E NLOT C O C E L A B M B L
Width of neurons I M E NLOT C E C O B M L A B L
Size of neurons I M E NLOT C E C O B M L A B L
Shape of neurons I L A M E C O NLOT B L B M C E
Stephan et al. [67] put forward volumetric parisons of the two larger but clearly delineated com-ponents of CA. The first, known as the lateral amygdala (LAM), combines LA, BL, BM and CO. The second, defined as the medial amygdala (MAM), is composed of CE and ME as well as AAA and NLOT. LAM percentage in relation to the size of the total CA in the common shrew was reported by Stephan et al. [67] to be 51.4%. LAM ratio calculated in the same species as our results yields a value of 58.7%. The figure of Stephan et al. [67] seems to be rela-tively low in comparison to our finding. However, LAM percentages in the work of Stephan et al. [67] were taken from CA in which AAA was included. Since this structure is comparatively large, it can be expected to influence the total volume of CA in the species. After exclusion of AAA from CA the percentage of LAM group presented by Stephan et al. [67] should be considerably larger and thus in good agreement with our results. Direct compari-son of MAM group with our results is not possible since AAA was not taken into account in the present investigations.
The recent studies of Dziewiątkowski et al. [11] in the rabbit have shown that the individual nuclei in CA may be precisely labelled using the morpho-metric parameters of their neurons as a marker. The largest neurons in the rabbit CA were found in BL, while the smallest cells were localised in ME. The neurons populating CE and CO occupy an interme-diate position and are very similar to each other in terms of size parameters. The neuronal size distribu-tion depicted by Dziewiątkowski et al. [11] in the rabbit corresponds very well with our results in the shrew (Table 2). The only difference is that the neu-rons in the rabbit are considerably larger than those in the shrew. The positive correlation between the size of the cells and the size of the brain was de-scribed by Morgane et al. [51] for the limbic cortices of several Cetacean species and was also confirmed for CA by Równiak in a comparative study of the mammalian amygdala [61].
The model of the common shrew’s CA organisation. The fundamental nuclear pattern and re-lationships between the various components in the shrew’s CA conform to those found in the other species.
1. All the nuclei observed in the shrew have also been described in the mole [20], rat [25], gerbil [63], guinea pig [19], rabbit [18], cat [25, 54], dog [47], porpoise [5], bat [16], tree shrew [12], monkey [55, 69] and in humans [4]. Furthermore, the position and general morphology of these different CA regions
in the shrew are most similar to those found by Salt-er in the Mongolian gSalt-erbil [63]. HowevSalt-er, the posi-tion of both parts of BM in the common shrew’s CA when compared with the gerbil’s BM seems to be reversed. The parcellation of the shrew’s CA into fin-er parts was easily pfin-erformed with the use of the terminology proposed by Krettek and Price in the rat [25].
corticomedial group was subdivided into 2 separate regions (the corticomedial and central groups).
Although the general organisation of CA of the common shrew is similar to that found in other mam-mals, there are some peculiar features in the size and degree of differentiation of the various nuclei (Fig. 1, 2). The following are some of the peculiari-ties we have picked out:
1. The characteristic feature of the common shrew’s CA is poor development of LA and BM. Similar conclusions were reached by Crosby et al. [10] and Stephan et al. [65, 67], although neither of these authors performed quantitative corrobo-rations. Interestingly, hodological and cytoarchi-tectonic studies have shown that LA and BM are closely related anatomically [17, 44, 53, 61]. The projections of the ventral prefrontal cortices to the basolateral region of CA mainly targeted LA and BM, whereas the input to the BL, which lies between LA and BM, was very weak [17, 44, 53]. Furthermore, LA and BM, but not BL, have strong interconnections with each other and the super-ficial nuclei of CA [25, 31, 53, 56]. Finally, in con-trast to BL, both nuclei receive afferents from the posterior thalamic region that processes audito-ry and somatosensoaudito-ry stimuli [27] as well as from the perirhinal cortex that probably processes vi-sual and auditory signals [42]. It should be noted that the Golgi studies in various mammals sug-gest that LA and BM contain similar cell types [4, 7, 22]. Furthermore, the present morphomet-ric results demonstrate that the sizes and densi-ties of neurons in both these regions are also sta-tistically comparable.
2. According to our data, CO, ME and, especially, NLOT are, in contrast to LA and BM, well devel-oped in the shrew’s CA (Fig. 1, 2, Table 1). Inter-estingly, all these superficial nuclei, in contrast to the rest of CA, receive direct input from the olfac-tory bulbs [23, 24, 68] and most of them also send information back to the bulbs [23, 24, 68]. COp and ME are the targets of the projection from the accessory olfactory bulb [23, 68], whereas the main olfactory bulb projects to COa and COc [24, 68]. Rostrally the main olfactory projection also termi-nates in NLOT [56, 68]. In addition, all these nuclei have 3 more or less distinct layers that are very characteristic for the piriform lobe areas (present results and [11, 18, 25, 68]). Moreover, the cells found in these layers clearly resemble neurons in the respective layers of the piriform cortex (present results and [22, 25, 47, 69]).
3. Since BL is, according to many authors [1, 4, 5, 7, 11, 18, 22, 29, 52, 56, 68], an integral part of BLC, one would expect it to be poorly developed in the shrew’s CA. However, this seems not to be the case as BL is especially well represented in this spe-cies (Fig. 1, 2, Table 1). Surprisingly, the strong development of the BL in the macrosmatic ani-mals has also been reported by several authors. Salter [63] found that this nucleus is particularly well formed in the gerbil’s CA. Similar impressions regarding the tree shrew were reported by Flûgge et al. [12]. Interestingly, LA in both these species was, as in the shrew, considerably smaller than the BL both in the coronal and sagittal sections [12, 63]. Stephan et al. [65, 67] using volumetric methods, pointed out that the magnocellular part of BL occupies much a larger area in CA of insec-tivora than in primates (Prosimians and Simians). It should be noted that BL shows some common features with NLOT [35]. Both these nuclei receive a relatively dense dopaminergic innervation from the lateral ventral tegmental area and the medial part of the substantia nigra [30] and are strongly interconnected with each other [56]. In addition, both of them are innervated by the cholinergic cells in the basal forebrain [8, 15].
REFERENCES
1. Berdel B, Moryś J, Maciejewska B, Dziewiątkowski J (1997) Volume and topographical changes of the ba-solateral complex during the development of the rat’s amygdaloid body. Folia Morphol, 56: 1–11.
2. Berdel B, Moryś J (2000) Expression of
calbindin-D28k and parvalbumin during development of rat’s basolateral amygdaloid complex. Int J Dev Neurosci, 18: 501–513.
3. Bookstein FL (1986) Size and shape spaces for landmark data in two dimensions. Statistical Science, 1: 181–222. 4. Braak H, Braak E (1983) Neuronal types in the basolateral amygdaloid nuclei of man. Brain Res Bull, 11: 349–365. 5. Breathnach AS, Goldby F (1954) The amygdaloid nuclei, hippocampus and other parts of rhinencephalon in the porpoise (Phocaena phocaena). J Anat, 88: 267–291.
6. Canteras NS, Swanson LW (1992) Projections of the
ventral subiculum to the amygdala, septum and hy-pothalamus: a PHAL anterograde track-tracing study in the rat. J Comp Neurol, 324: 180–194.
7. Carlsen J, Heimer L (1988) The basolateral amygdal-oid complex as a cortical-like structure. Brain Res, 441: 377–380.
8. Carlsen J, Záborszky L, Heimer L (1985) Cholinergic projections from the basal forebrain to the basolat-eral amygdaloid complex: A combined retrograde flu-orescent and immunohistochemical study. J Comp Neurol, 234: 155–167.
9. Crosby EC, DeJorge BR, Schneider RC (1966) Evidence for some of the trends in the phylogenetic develop-ment of the vertebrate telencephalon. In: Hassler R, Stephan H (eds.) Evolution of the forebrain. Stut-tgart, pp. 117–135.
10. Crosby EC, Humphrey T (1944) Studies on the vertebrate telencephalon. III. The amygdaloid complex in the shrew (Blarina brevicauda). J Comp Neurol, 81: 285–305. 11. Dziewiątkowski J, Berdel B, Kowiański P,
Kubasik-Ju-raniec J, Bobek-Bilewicz B, Moryś J (1998) The amygda-loid body of the rabbit — a morphometric study us-ing image analyser. Folia Morphol, 57: 93–103. 12. Flugge G, Ahrens O, Fuchs E (1994) Monoamine
re-ceptors in the amygdaloid complex of the tree shrew (Tupaia belangeri). J Comp Neurol, 343: 597–608. 13. Gower JC (1975) Generalized Procrustes analysis.
Psy-chometrika, 40: 33–51.
14. Gundersen HJG, Jensen EB (1987) The efficiency of systematic sampling in sterology and its prediction. J Microsc, 147: 229–263.
15. Hecker S, Mesulam MM (1994) Two types of cholin-ergic projections to the rat amygdala. Neuroscience, 60: 383–397.
16. Humphrey T (1936) The telencephalon of the bat. I. The non-cortical nuclear masses and certain pertiment fiber connections. J Comp Neurol, 65: 603–711. 17. Hurley KM, Herbert H, Moga MM, Saper CB (1991)
Efferent projections of the infralimbic cortex of the rat. J Comp Neurol, 308: 249–276.
18. Jagalska-Majewska H, Dziewiątkowski J, Wójcik S, Łu-czyńska A, Kurlapska R, Moryś J (2001) The amygdal-oid complex of the rabbit-morphological and his-tochemical study. Folia Morphol, 60: 259–280.
19. Johnson TN (1957a) Studies on the brain of a guin-ea pig. I. The nuclguin-ear pattern of certain basal telen-cephalic centers. J Comp Neurol, 107: 353–477. 20. Johnson TN (1957b) The olfactory centers and
con-nections in the cerebral hemisphere of the mole (Sca-lonus aquaticus machrinus). J Comp Neurol, 107: 379–425.
21. Johnston JB (1923) Further contributions to the study of the evolution of the forebrain. J Comp Neurol, 35: 337–482.
22. Kamal AM, Tombol T (1975) Golgi studies on the amygda-loid nuclei of the cat. J Hirnforsch, 16: 175–201. 23. Kevetter GA, Winans SS (1981) Connections of the
corticomedial amygdala in the golden hamster. I. Ef-ferents of the “vomeronasal amygdala”. J Comp Neu-rol, 197: 81–98.
24. Kevetter GA, Winans SS (1981) Connections of the corticomedial amygdala in the golden hamster. II. Ef-ferents of the “olfactory amygdala”. J Comp Neurol, 197: 99–111.
25. Krettek JE, Price JL (1978b) A description of the amygdaloid complex in the rat and cat with observa-tions on intra-amygdaloid axonal connecobserva-tions. J Comp Neurol, 178: 255–280.
26. LeDoux JE, Cicchetti P, Xagoranis A, Romanski LM (1990a) The lateral amygdaloid nucleus: sensory in-terface of the amygdala in fear conditioning. J Neuro-sci, 10: 1062–1069.
27. LeDoux JE, Farb C, Ruggiero DA (1990b) Topo-graphic organization of neurons in the acoustic thalamus that project to the amygdala. J Neurosci, 10: 1043–1054.
28. LeDoux JE, Farb C, Ruggiero DA (1991) Overlapping projections to the amygdala and striatum from audi-tory processing areas of the thalamus and cortex. Neurosci Lett, 134: 139–144.
29. LeDoux JE (2000) Emotion circuits in the brain. Annu Rev Neurosci, 23: 155–184
30. Loughlin SE, Fallon JH (1984) Substantia nigra and ventral tegmental area projections to cortex: to-pography and collateralization. Neuroscience, 11: 425–435.
31. Luskin MB, Price JL (1983a) The topographic organi-zation of associational fibers of the olfactory system in the rat, including centrifugal fibers to the olfacto-ry bulb. J Comp Neurol, 216: 264–291.
32. Mayhew TM (1992) A review of recent advances in stereology for quantifying neural structures. J Neuro-cytol, 21: 313–328.
33. Majidishad P, Pelli DG, LeDoux JE (1996) Disrup-tion of fear condiDisrup-tioning to contextual stimuli but not to a tone by lesions of the accessory basal nucleus of the amygdala. Soc Neurosci Abstr, 22: 1116.
34. Maren S, Fanselow MS (1995) Synaptic plasticity in the basolateral amygdala induced by hippocam-pal formation stimulation in vivo. J Neurosci, 15: 7548–7564.
36. Mascagni F, McDonald AJ, Coleman JR (1993) Corti-coamygdaloid and corticocortical projections of the rat temporal cortex: a Phaseolus vulgaris leucoagglu-tinin study. Neuroscience, 57: 697–715.
37. McDonald AJ (1982) Cytoarchitecture of the central amygdaloid nucleus of the rat. J Comp Neurol, 208: 401–418.
38. McDonald AJ (1982) Neurons of the lateral and ba-solateral amygdaloid nuclei: a Golgi study in the rat. J Comp Neurol, 212: 293–312.
39. McDonald AJ (1983) Cytoarchitecture of the nucleus of the lateral olfactory tract: a Golgi study in the rat. Brain Res Bull, 10: 497–503.
40. McDonald AJ (1984) Neuronal organization of the lat-eral and basolatlat-eral amygdaloid nuclei in the rat. J Comp Neurol, 222: 589–606.
41. McDonald AJ (1985) Morphology of peptide-contain-ing neurons in the rat basolateral amygdaloid nucle-us. Brain Res, 338: 186–191.
42. McDonald AJ, Jackson TR (1987) Amygdaloid connec-tions with posterior insular and temporal cortical ar-eas in the rat. J Comp Neurol, 262: 59–77.
43. McDonald AJ, Pearson JC (1989) Coexistence of GABA and peptide immunoreactivity in non-pyramidal neurons of the basolateral amygdala. Neurosci. Lett, 100: 53–58. 44. McDonald AJ, Mascagni F, Guo L (1996) Projections of the medial and lateral prefrontal cortices to the amygdala: a Phaselous vulgaris leucoaggulutinin study in the rat. Neuroscience, 71: 55–75.
45. McDonald AJ (1996) Glutamate and aspartate immu-noreactive neurons of the rat basolateral amygdala: colocalization of excitatory amino acids and projections to the limbic circuit. J Comp Neurol, 365: 367–379. 46. McDonald AJ, Mascagni F (2001) Colocalization of
cal-cium-binding proteins and GABA in neurons of the rat basolateral amygdala. Neuroscience, 105: 681–693. 47. Maksymowicz K (1963) Amygdaloid complex of the
dog. Acta Biol Exp Wars, 23: 63–73.
48. Millhouse OE, DeOlmos J (1983) Neuronal configu-rations in lateral and basolateral amygdala. Neuro-science, 10: 1269–1300.
49. Millhouse OE, Uemura-Sumi M (1985) The structure of the nucleus of the lateral olfactory tract. J Comp Neurol, 233: 517–552.
50. Millhouse OE (1986) The intercalated cells of the amygdala. J Comp Neurol, 247: 246–271.
51. Morgane PJ, McFarland WL, Jacobs MS (1982) The lim-bic lobe of the Dolphin brain: a quantitative cytoar-chitectonic study. J Hirnforsch, 23: 465–552. 52. Moryś J, Berdel B, Jagalska-Majewska H, Łuczyńska
A (1999) The basolateral amygdaloid complex — its development, morphology and functions. Folia Mor-phol, 58: 29–46.
53. Ottersen OP (1982) Connections of the amygdala of the rat. Corticoamygdaloid and intraamygdaloid con-nections as studied with axonal transport of horse-radish peroxidase. J Comp Neurol, 205: 30–48.
54. Pare D, Smith Y (1993) Distribution of GABA immu-noreactivity in the amygdaloid complex of the cat. Neuroscience, 57: 1061–1076.
55. Pitkänen A, Amaral DG (1994) The distribution of GABA-ergic cells, fibers, and terminals in the monkey amygdaloid complex: an immunohistochemical and in situ hybridization study. J Neurosci, 14: 2200–2224. 56. Pitkänen A, Jolkkonen E, Kemppainen S (2000) Ana-tomical heterogeneity of the rat amygdaloid complex. Folia Morphol, 59: 1–23.
57. Rohlf FJ, Slice DE (1990) Extensions of the Procrustes method for the optimal superimposition of landmarks. Systematic Zool, 39: 40–59.
58. Rohlf FJ (1999) Shape statistics: Procrustes superim-positions and tangent spaces. Journal of Classification, 16: 197–223.
59. Romanski LM, LeDoux JE (1993) Information cascade from primary auditory cortex to the amygdala: corti-cocortical and corticoamygdaloid projections of tem-poral cortex in the rat. Cereb Cortex, 3: 515–532. 60. Równiak M, Szteyn S, Robak A, Klawon M, Dusza M
(1994) The types of neurons in the neostriatum of bi-son bonasus. Nissl and Golgi study. Folia Morphol, 53: 165–176.
61. Równiak M (2002) Cytoarchitektonika i analiza jąder ciała migdałowatego u wybranych gatunków ssaków łożyskowych. PhD Thesis, Medical University of Gdańsk, 1–95.
62. Tuunanen J, Pitkänen A (2000) Do seizures cause neu-ronal damage in rat amygdala kindling? Epilepsy Res, 39: 171–176.
63. Salter CF (1975) A morphological study of the lateral olfactory areas of the telencephalon in the mongo-lian gerbil, Meriones unguiculatus. J Hirnforsh, 16: 223–244.
64. Spacek J (1989) Dynamics of the Golgi method: a time-lapse study of the early stages of impregna-tion in single secimpregna-tions. J Neurocytol. 18: 27–38. 65. Stephan H, Andy OJ (1977) Quantitative comparisons
of the amygdala in insectivores and primates. Acta Anat, 98: 130–153.
66. Stephan H, Frahm H, Baron G (1981) New and revised data on volumes of brain structures in insectivores and primates. Folia Primatol, 35: 1–29.
67. Stephan H, Frahm H, Baron G (1987) Comparisons of brain structure volumes in insectivora and primates. VII. Amygdaloid body. J Hirnforsh, 28: 571–584. 68. Swanson LW, Petrovich GD (1998) What is the
amygda-la? Trends Neurosci, 21: 323–331.
69. Śmiałowski A (1965) Amygdaloid complex of the dog. Acta Biol Exp, 25: 77–89.
70. Turner BH, Zimmer J (1984) The architecture and some of the interconnections of the rat’s amygdala and la-teral periallocortex. J Comp Neurol, 227: 540–557. 71. West MJ, Gundersen HJG (1990) Unbiased