****Corresponding aCorresponding aCorresponding aCorresponding authoruthoruthor,,,, Tel: uthor Tel: Tel: Tel: +234+234----803+234+234803803803----476476476----6428476642864286428
APPLICATION OF STATIC
APPLICATION OF STATIC
APPLICATION OF STATIC
APPLICATION OF STATIC SYNCHRONOUS COMPENSATOR (STATCOM) IN
SYNCHRONOUS COMPENSATOR (STATCOM) IN
SYNCHRONOUS COMPENSATOR (STATCOM) IN
SYNCHRONOUS COMPENSATOR (STATCOM) IN
IMPROVING POWER SYSTEM PERFORMANCE: A CASE STUDY OF THE
IMPROVING POWER SYSTEM PERFORMANCE: A CASE STUDY OF THE
IMPROVING POWER SYSTEM PERFORMANCE: A CASE STUDY OF THE
IMPROVING POWER SYSTEM PERFORMANCE: A CASE STUDY OF THE
NIGERIA 330 kV ELECTRICITY GRID
NIGERIA 330 kV ELECTRICITY GRID
NIGERIA 330 kV ELECTRICITY GRID
NIGERIA 330 kV ELECTRICITY GRID
R.
R.
R.
R. AAAA.... Jokojeje
Jokojeje
Jokojeje
Jokojeje
1111,,,,****, , , , I.I.I.I. A.
A.
A.
A. Adejumobi
Adejumobi
Adejumobi
Adejumobi
2222, , , , A.
A.
A.
A. O.
O. Mustapha
O.
O.
Mustapha
Mustapha
Mustapha
3333and
and O.
and
and
O.
O.
O. IIII.... Adebisi
Adebisi
Adebisi
Adebisi
4444....
1, 1,1,
1, 2,2,2,2, 4444DEPT OF ELECTRICAL &ELECTRONICS ENGINEERING,FED.UNIV. OF AGRICULTURE,ABEOKUTA,OGUN STATE.NIGERIA 3333 DEPARTMENT OF PHYSICS,FEDERAL UNIVERSITY OF AGRICULTURE,ABEOKUTA,OGUN STATE.NIGERIA
Email EmailEmail
Email addressesaddressesaddressesaddresses: 1 1 1 1 akinnusimialaba@yahoo.com, 2222 engradejumobi@yahoo.com, 3333 amidumustapha@hotmail.com 4444 adebisi.oluwaseun@yahoo.com
ABSTRACT ABSTRACT ABSTRACT ABSTRACT
Slow response of Slow response of Slow response of
Slow response of the conventional traditional methods for improving power system performance creates the need the conventional traditional methods for improving power system performance creates the need the conventional traditional methods for improving power system performance creates the need the conventional traditional methods for improving power system performance creates the need for adoption of advanced control technologies such as Flexible Alternating Current Transmission System (FACTS) for adoption of advanced control technologies such as Flexible Alternating Current Transmission System (FACTS) for adoption of advanced control technologies such as Flexible Alternating Current Transmission System (FACTS) for adoption of advanced control technologies such as Flexible Alternating Current Transmission System (FACTS) with fast response and low cost for stabilizing ele
with fast response and low cost for stabilizing ele with fast response and low cost for stabilizing ele
with fast response and low cost for stabilizing electricity grid power and voltage. In this work, we examined the effect ctricity grid power and voltage. In this work, we examined the effect ctricity grid power and voltage. In this work, we examined the effect ctricity grid power and voltage. In this work, we examined the effect of application of Static Synchronous Compensator (STATCOM), a FACTS controller on the performance of the Nigeria of application of Static Synchronous Compensator (STATCOM), a FACTS controller on the performance of the Nigeria of application of Static Synchronous Compensator (STATCOM), a FACTS controller on the performance of the Nigeria of application of Static Synchronous Compensator (STATCOM), a FACTS controller on the performance of the Nigeria 330 kV, 28
330 kV, 28 330 kV, 28
330 kV, 28----bus power system. The conventional and modified Newtonbus power system. The conventional and modified Newtonbus power system. The conventional and modified Newtonbus power system. The conventional and modified Newton----RaphsonRaphsonRaphsonRaphson----based power flow equations based power flow equations based power flow equations based power flow equations describing the steady state conditions before and after compensation was made to the system were presented. describing the steady state conditions before and after compensation was made to the system were presented. describing the steady state conditions before and after compensation was made to the system were presented. describing the steady state conditions before and after compensation was made to the system were presented. Solutions to the developed equations were obtained using
Solutions to the developed equations were obtained using Solutions to the developed equations were obtained using
Solutions to the developed equations were obtained using Matlab software (Version 7.9.0.529 ‘R2009b’). The results Matlab software (Version 7.9.0.529 ‘R2009b’). The results Matlab software (Version 7.9.0.529 ‘R2009b’). The results Matlab software (Version 7.9.0.529 ‘R2009b’). The results from
from from
from the analysis showed that before the application of STATCOM, the analysis showed that before the application of STATCOM, the analysis showed that before the application of STATCOM, the analysis showed that before the application of STATCOM, five (5) of the twenty eight ( 28) buses of the five (5) of the twenty eight ( 28) buses of the five (5) of the twenty eight ( 28) buses of the five (5) of the twenty eight ( 28) buses of the sample system have their voltage magnitudes fell outside the statutory limit of 0.95
sample system have their voltage magnitudes fell outside the statutory limit of 0.95 sample system have their voltage magnitudes fell outside the statutory limit of 0.95
sample system have their voltage magnitudes fell outside the statutory limit of 0.95I VVVViiiiI1.05 p.u, which were 1.05 p.u, which were 1.05 p.u, which were 1.05 p.u, which were
improved to 1.0 p.u. each at inclusio improved to 1.0 p.u. each at inclusio improved to 1.0 p.u. each at inclusio
improved to 1.0 p.u. each at inclusion of STATCOM. Similarly, the total system active power loss was reduced by n of STATCOM. Similarly, the total system active power loss was reduced by n of STATCOM. Similarly, the total system active power loss was reduced by n of STATCOM. Similarly, the total system active power loss was reduced by 5.88%
5.88% 5.88%
5.88% from from from from 98.21 to 92.44MW. Evidence from this finding is that STATCOM application on the Nigeria electricity 98.21 to 92.44MW. Evidence from this finding is that STATCOM application on the Nigeria electricity 98.21 to 92.44MW. Evidence from this finding is that STATCOM application on the Nigeria electricity 98.21 to 92.44MW. Evidence from this finding is that STATCOM application on the Nigeria electricity grid
grid grid
grid will stabilisewill stabilisewill stabilisewill stabilise the system’s voltage and reduce the overall transmission active power the system’s voltage and reduce the overall transmission active power the system’s voltage and reduce the overall transmission active power the system’s voltage and reduce the overall transmission active power loss therebyloss therebyloss thereby releasing spare loss therebyreleasing spare releasing spare releasing spare capacities for more consumers.
capacities for more consumers. capacities for more consumers. capacities for more consumers.
Key Key Key
Keywords:words:words:words: Power system performance, FACTS, STATCOM, Nigeria electricity grid, System’s voltage and Transmission active power loss.
1. INTRODUCTION 1. INTRODUCTION 1. INTRODUCTION 1. INTRODUCTION
In recent times, the advancement towards the improvement of power system performance globally has been in the direction of the use of advanced control technologies such as Flexible Alternating Current Transmission System (FACTS). Electric power systems generally are very large capital intensive investments consisting of complex interconnected components such as generators, overhead conductors, underground cables, transformers etc. for the transmission and distribution of electric power over long distances from the power generating stations to the consumers. Establishing new power stations and transmission lines for provision of stable, secure and high quality electricity supply in most developing countries of the world including Nigeria may be very slow due to the economic crisis being faced by these countries. Hence,
there is the need to employ the use of appropriate technologies which offer more efficient means of utilizing the existing power facilities with fast response times and low maintenance costs to produce high quality electricity supply. In this respect, FACTS plays a leading role [1, 2, 3, 4].
The electricity supply system in Nigeria is faced with series of operational problems fundamentally poor quality power supply, voltage instability and high transmission loss among others. Traditional methods such as the use of synchronous generator, series compensation capacitor, generator excitation regulation, magnetically controlled reactor, reconfiguration of system structure and switch in or out of shunt and series capacitor have been considered capable of improving voltage and power profiles of power systems [5]. However, these methods suffer
University of Nigeria, Nsukka, ISSN: 0331-8443
Nigerian Journal of Technology Nigerian Journal of TechnologyNigerian Journal of Technology
Nigerian Journal of Technology Vol. 34 NVol. 34 NVol. 34 NVol. 34 Noooo. 3, July 2015 . 3, July 2015 . 3, July 2015 . 3, July 2015
565
565
565
565
from slow response and wear and tear in the mechanical components which render their application for power transmission improvement and control undesirable [5]. The only economically viable alternative to these methods is the use of power electronics based technology called FACTS which is fast acting and cost effective.
FACTS technology is a new approach taking into advantage the advances in power electronics controllers for enhancing the existing power system infrastructures [2, 3, 6, 7]. FACTS allows improved transmission system operation and control with reduced infrastructure investment, environmental impact, and implementation time, increase system security and reliability, increase power transfer capabilities, and enhance improvement in the quality of the electrical energy delivered to end users [8]. Several kinds of FACTS controllers exist and the most popular types are Inter phase Power Controller (IPC), Generalized Unified Power Flow Controller (GUPFC), Static Synchronous Compensator (STATCOM), Static Var Compensator (SVC), Thyristor Controlled Breaking Reactor (TCR), Thyristor Controlled Series Capacitor (TCSC), Static Synchronous Series Compensator (SSSC), Interline Power Flow Controller (IPFC), Thyristor Switched Series Reactor (TSSR), Unified Power Flow Controller (UPFC) [8]. Each of these technologies has their peculiarity which can be employed for different applications and on this basis several studies have been conducted to investigate the potential applications and benefits arising from their installations [9, 10, 11, 12, 13, 14, 15].
In this work, our goal is to study the effect of application of STATCOM for improving power system performance using the Nigeria 330 kV, 28-bus power network as a case study. STATCOM is basically a Voltage Source Inverter (VSI) which utilises Gate Turn off (GTO) thyristors and Direct Current (DC) capacitor to generate a three-phase synchronous voltage at fundamental frequency [6]. It has ability to inject or absorb reactive power for regulating the voltage and power profiles of the power system bus to which it is connected [2, 6].
2. STATIC SYNCHRONOUS COMPENSATOR (STATCOM) 2. STATIC SYNCHRONOUS COMPENSATOR (STATCOM) 2. STATIC SYNCHRONOUS COMPENSATOR (STATCOM) 2. STATIC SYNCHRONOUS COMPENSATOR (STATCOM) STATCOM is a static synchronous generator operated as a shunt-connected static var compensator whose capacitive or inductive output current can be controlled independent of the Alternating Current (AC) system voltage [14]. It is a regulating device which can act as a source or sink of reactive power to an electricity
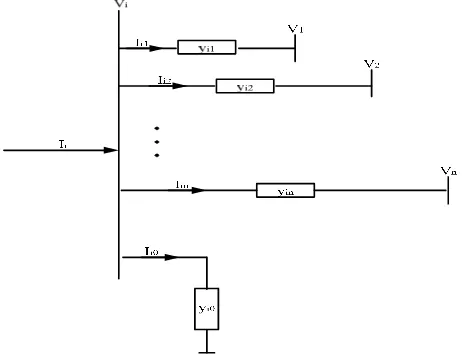
network and can also serve as source of active power if connected to a source of power [15]. A simplified model of STATCOM consisting of a coupling transformer, a VSI and a DC capacitor is shown in Figure 1.
Figure 1: A simple STATCOM model [6]
The control of the reactive power exchange between the STATCOM and the AC system can be achieved either by regulating the amplitude of the STATCOM output voltage or by controlling the inverter output voltage with respect to the AC system voltage [6]. Regulation of the amplitude STATCOM output voltage may result in one of the following conditions: injection of reactive power into the AC system, absorption of reactive power from the AC system and non injection or absorption of reactive power from the AC system while control of the inverter output voltage on the other hand, may cause active power to be supplied or withdrawn from the AC system [6]. For instance, if the output voltage of the STATCOM is higher than the AC system voltage at the point of connection, the STATCOM produces reactive current whereas when the amplitude of the STATCOM voltage is lower than the AC system voltage, it absorbs reactive power [16]. The active power can be increased by connecting a suitable energy storage device across the DC capacitor [16]. Damping of power system oscillations, improvement of transient stability margin and steady-state power transfer capacity, reduction of temporary overvoltage and effective voltages regulation and control are few of the important applications of the STATCOM [17].
3. THE POWER FLOW MODELLING 3. THE POWER FLOW MODELLING 3. THE POWER FLOW MODELLING 3. THE POWER FLOW MODELLING
Nigerian Journal of Technology Nigerian Journal of TechnologyNigerian Journal of Technology
Nigerian Journal of Technology Vol. 34 NVol. 34 NVol. 34 NVol. 34 Noooo. 3, July 2015 . 3, July 2015 . 3, July 2015 . 3, July 2015
566
566
566
566
optimized performance of such an interconnected system, information such as bus voltage levels, reactive power compensation requirements etc. are highly essential and these can be obtained from power flow analysis [18]. Figure 2 is a simplified ith bus model of a
power system.
Figure 2: A simplified ith bus model of a power system
Applying the Kirchhoff’s Current Law (KCL) to bus i, we obtain an expression for the net current injected at the bus as:
NO= NOQ+ NOR+ NOS+ ⋯ + NOU (1) Where Ii is the current injected into bus i, Ii0 is the
current flowing from bus i to ground, Ii1 is the current
flowing from bus i to bus 1, Ii2 is the current flowing
from bus i to bus 2 and Iin is the current flowing from
bus i to bus n
Application of Ohm’s law to each of bus 1 to n with bus i as a reference, equation (1) is modified into equation (2):
NO= VOQWO+ VOR(WO− WR) + VOS(WO− WS) + ⋯ + VOU(WR− WU) (2) Where Vi is the voltage at bus i, V1 is the voltage at bus
1, V2 voltage at bus 2, Vn is the voltage at bus n
By rearranging equation (2), we obtain a simplified expression given by equation (3):
NO= (VOQ+ VOR+ VOS+ ⋯ + VOU)WO− VORWR− VOSWS− ⋯ − VOU (3) Where yi0 is the admittance of transmission line
between bus i and ground, yi1 is the admittance of
transmission line between bus i and bus 1, yi2 is the
admittance of transmission line between bus i and bus 2, and yin is the admittance of transmission line
between bus i and bus n Also, by defining:
Y
Z
[
Z
\ ]
OO= V
OQ+ V
OR+ V
OS+ ⋯ + V
OU]
OR= −V
OR]
OS= −V
OS⋮ ⋮ ⋮
]
OU= −V
OU(4)
and substituting in equation (3), we obtain equation (5):
NO = ]OOWO+ ]ORWR+ ]OSWS+ ⋯ + ]OUWU (5) Equation (5) is equivalently expressed as equation (6):
NO= ]OOWO+ _ ]O`W` U
`aR `bO
(6)
Recalling from the expression for complex powerinjected at bus i [18, 19, 20], we obtain equation (7):
cO = dO− efO= WO∗NO (7) Where Si is the apparent power injected at bus i, Pi is
the real power injected at bus i, Qi is the reactive power
injected at bus i and WO∗ is the complex conjugate of bus i voltage.
The use of equation (6) in (7) yields equation (8) given as:
dO− efO
WO∗ = ]OOWO+ _ ]O`W` U
`aR `bO
(8) Making WO the subject in equation (8), we obtain equation (9):
WO =]1 OOi
dO− efO
WO∗ − _ ]O`W` U
`aR `bO
j (9) Also, decoupling equation (8) into real and imaginary parts and expressing the components parts in polar form, we obtain equations (10) and (11):
dO = |WO|SlOO+ _ |]O`W`WO`|mno(pO`+ q`− qO) U
`aR `bO
(10
fO = |WO|SrOO+ _ |]O`W`WO`|ost(pO`+ q`− qO) U
`aR `bO
(11) Where lOO is the self-conductance of bus i and rOO is the self-susceptance of bus i
Considering that the voltage at the buses must be within certain specified statutory limit, the voltage constraint at bus i is then defined by equation (12):
WO(uOU)I WOI WO(uvw) (12) Where WO(uOU) and WO(uvw) are minimum and maximum values of voltage at bus i.
Since dO and fO give a measure of the net real and reactive power at the bus i, they can be equivalently expressed by equations (13) and (14):
Nigerian Journal of Technology Nigerian Journal of TechnologyNigerian Journal of Technology
Nigerian Journal of Technology Vol. 34 NVol. 34 NVol. 34 NVol. 34 Noooo. 3, July 2015 . 3, July 2015 . 3, July 2015 . 3, July 2015
567
567
567
567
supply at bus i and fyO is the reactive power demand at bus i
The reactive power supply constraint at bus is specified by equation (15):
fxO(uOU)I fxOI fxO(uvw) (15) Where fxO(uOU) and fxO(uvw) are minimum and maximum values of reactive power supply at bus i. It should however be noted that if the constraint given by equation (15) is not satisfied that is fxO does not lie within the limit, it must be set to appropriate limit. fxOis set to fxO(uvw) if fxO is greater than fxO(uvw) and it is set to fxO(uOU) if fxO is less than fxO(uvw)and the constraint that voltage at bus i is fixed must be released [21].
If we consider further a situation when STATCOM is shunt-connected at bus i in Figure 2 and it is treated as var source, equations (13) and (14) can be modified as equations (16) and (17) respectively:
dO= dxO+ dz{|O− dyO (16) fO= fxO− fz{|O− fyO (17) Where dz{|O is the STATCOM real power at bus i and fz{|O is the STATCOM reactive power at bus i
Equations (16) and (17) are representations of a case where STATCOM injects var into the system at bus i and for var absorption, the signs of dz{|O and fz{|O become reversed.
Equations (10) and (11) are non-linear sets of power flow equations and their solution is usually based on iterative technique. The method of solution adopted in this work to power flow equations (10) and (11) with a shunt-connected STATCOM at bus i is Newton-Raphson iterative method and this was adopted because of its faster rate of convergence and accuracy when compared with other methods of solution such as Gauss-Siedel method for non-linear power flow equations [18, 20].
In this work, the modelling and analysis of STATCOM with adopted Newton-Raphson method using rectangular coordinates system was a modified form of the version presented in [22]. The The venin’s equivalent circuit of the fundamental frequency operation of the switched mode VSI (STATCOM) and its transformer with the bus k replaced by bus i is shown in Figure 3.
Figure 3: Thevenin’s equivalent circuit diagram of STATCOM: (a) STATCOM schematic diagram; (b) STATCOM equivalent circuit [22].
According to Figure 3 above, we obtain equation (18): Wz{|= WO+ ~z|Nz{| (18) Where VSTC is the STATCOM voltage, ISTC is the
STATCOM current and ZSC is the transformer’s
impedance
Equation (18) is expressed in its Norton’s equivalent form as:
Nz{|= N€− ]z|WO (19) With N€= ]z|Wz{| (20) Where IN is the Norton’s current and YSC is the
short-circuit admittance
The STATCOM voltage injection bound constraint is given by equation (21) [22]:
Wz{| uOUI Wz{| I Wz{| uvw (21) Where VSTCmin and VSTCmax are the STATCOM’s minimum
and maximum voltages.
Equation (19) is transformed into a power expression for STATCOM and power injected into bus i by equations (22) and (23) respectively.
cz{|= Wz{|Nz{|∗ = Wz{|Wz{|∗ ]z|∗ − Wz{|]z|∗WO∗ (22) cO= WONz{|∗ = WOWO∗]z|∗ − WOWz{|∗ ] z|∗ (23) Where SSTC is the STATCOM injected apparent power,
Nz{|∗ is the complex conjugate of STATCOM current, Wz{|∗ is the complex conjugate of STATCOM voltage and ]z|∗ is the complex conjugate of short-circuit
admittance
The bus i and STATCOM voltages in rectangular coordinates system are expressed as equations (24) and (25) respectively:
Nigerian Journal of Technology Nigerian Journal of TechnologyNigerian Journal of Technology
Nigerian Journal of Technology Vol. 34 NVol. 34 NVol. 34 NVol. 34 Noooo. 3, July 2015 . 3, July 2015 . 3, July 2015 . 3, July 2015
568
568
568
568
component of STATCOM voltage and ‚z{| is the imaginary component of STATCOM voltage
The STATCOM’s voltage magnitude and angle are expressed as equations (26) and (27) respectively:
|Wz{|| = (•z{|S + ‚z{|S ) R
S (26)
qz{|= ƒ„t…R†•‚z{|
z{|‡ (27) Where |Vˆ‰Š| is the STATCOM voltage magnitude and δˆ‰Š is the STATCOM voltage angle
The active and reactive power components for the STATCOM and bus i on the basis of equations (22) to (25) are respectively expressed by equations (28) to (31):
dz{|= lz|Œ(•z{|S + ‚z{|S ) − (•z{|•O+ ‚z{|‚O)•
+ rz|(•z{|‚O− ‚z{|•O) (28)
fz{| = lz|(•z{|‚O− •O‚z{|)
+ rz|Œ•z{|•O+ ‚z{|‚O
− (•z{|S + ‚z{|S )• (29)
dO= lz|Œ•OS+ ‚OS− (•O•z{|+ ‚O‚z{|)•
+ rz|(•O‚z{|− ‚O•z{|) (30) fO= lz|(•O‚z{|− ‚O•z{|) + rz|Ž•O•z{|+ ‚O‚z{|− ••OS+ ‚OS•‘ (31)
Where dz{| is the STATCOM real power, fz{| is the STATCOM reactive power, GSC is the short-circuit
conductance and BSC is the short-circuit susceptance
The Newton-Raphson set of linearized equations for power flow equations (10), (11), (16) and (17)obtained taken into consideration the modelling of shunt-connected STATCOM at bus i is given by equation (32):
’ ∆dO
∆|WO|
∆dz{| ∆fz{| ” = • – – – – – – – — ˜d˜•O
O ˜dO ˜‚O ˜dO ˜•z{| ˜dO ˜‚z{|
˜|WO|
˜•O
˜|WO|
˜‚O 0 0
˜dz{| ˜•O ˜dz|{ ˜‚O ˜dz{| ˜•z{| ˜dz{| ˜‚z{| ˜fz{| ˜•O ˜fz{| ˜‚O ˜fz{| ˜•z{| ˜fz{|
˜‚z{|™
š š š š š š š › ’ ∆•O ∆‚O ∆•z{| ∆•z{|
” (32)
Where the partial derivatives of the Jacobian matrix are defined on the basis of equations (24) and (28) to (31) by the expressions given in equation (33).
3.1 Application of Matlab Software 3.1 Application of Matlab Software 3.1 Application of Matlab Software 3.1 Application of Matlab Software
The solutions to developed power flow equations were obtained using Matlab software, version 7.9.0.529 (R2009b). Matlab is a high performance and user-friendly language. It was adopted for this study purposely because it provides a simple, easy-to-use programming platform for manipulation of mathematical equations. Y Z Z Z Z Z Z Z Z Z Z Z Z Z Z Z Z [ Z Z Z Z Z Z Z Z Z Z Z Z Z Z Z Z \ ˜d˜•O
O = lz|(2•O− •z{|) + rz|‚z{| ˜dO
˜‚O = lz|(2‚O− ‚z{|) − rz|‚z{| ˜dO
˜•z{|= −lz|•O− rz|‚O ˜dO
˜‚z{| = −lz|‚O+ rz|•O ˜|WO|
˜•O = •O œ•OS+ ‚
OS ˜|WO|
˜‚O = •O œ•OS+ ‚OS ˜dz{|
˜•O = −lz|•z{|− rz|‚z{| ˜dz|{
˜‚O = −lz|‚z{|+ rz|•z{| ˜dz{|
˜•z{|= lz|(2•z{|− •O) + rz|‚O ˜dz{|
˜‚z{| = lz|(2‚z{|− ‚O) − rz|•O ˜fz{|
˜•O = −lz|‚z{|+ rz|•z{| ˜fz{|
˜‚O = lz|•z{|+ rz|‚z{| ˜fz{|
˜•z{| = lz|‚O+ rz|(•O− 2•z{|) ˜fz{|
˜‚z{| = −lz|•O+ rz|(‚O− 2‚z{|)
(33)
4. RESULTS AND DISCUSSION 4. RESULTS AND DISCUSSION 4. RESULTS AND DISCUSSION 4. RESULTS AND DISCUSSION
The bus and transmission line data of the Nigeria 330 kV, 28-bus power network used as a case study were collected from the Transmission Company of Nigeria [23]. The 28-bus network shown in Figure 4 consists of twenty-eight (28) buses, nine (9) generation stations, and fifty-two (52) transmission lines. The bus data is shown in Tables 1 and 2 while the transmission line data is shown in Table 3.
The developed power flow equations were coded and simulated using Matlab programming language. The simulation results revealed that before the application of STATCOM, five (5) of the 28 buses namely buses 9, 13, 14, 16 and 22 had their voltage magnitudes fell outside the statutory limit defined by 0.95I ViI 1.05
Nigerian Journal of Technology Nigerian Journal of TechnologyNigerian Journal of Technology
Nigerian Journal of Technology Vol. 34 NVol. 34 NVol. 34 NVol. 34 Noooo. 3, July 2015 . 3, July 2015 . 3, July 2015 . 3, July 2015
569
569
569
569
Kainji G/ S B Kebbi
Jebba G/ S
Abuja Kaduna
Kano
Jos Gombe
Makurdi Mambilla
N-Haven
Sapele G/S Ajaokuta
Benin Shiroro
G/S
Jebba
Osogbo Ayede
Ikeja West Akangba
Papalanto GT
Aladja Delta G/S
Aja
Egbin G/S
Onitsh a
Afam G/S Alaoje
Figure 4: The Nigeria 28-bus network [23]
Table 1: Load data of the Nigeria 28-bus power network [23]
Bus
Number Bus Name MW Load MVar
1 Egbin 68.90 51.70
2 Delta 0.00 0.00
Bus
Number Bus Name MW Load MVar
3 Aja 274.40 205.80
4 Akangba 244.70 258.50
5 Ikeja-West 633.20 474.90
6 Ajaokuta 13.80 10.30
7 Aladja 96.50 72.40
8 Benin 383.30 287.50
9 Ayede 275.80 206.8
10 Osogbo 201.20 150.90
11 Afam 52.50 39.40
12 Alaoji 427.00 320.20
13 New-Heaven 177.90 133.40
14 Onitsha 184.60 138.40
15 B/Kebbi 114.50 85.90
16 Gombe 130.60 97.90
17 Jebba 11.00 8.20
18 Jebba G 0.00 0.00
19 Jos 70.30 52.70
20 Kaduna 193.00 144.70
21 Kanji 7.00 5.20
22 Kano 220.60 142.90
23 Shiroro 70.30 36.10
24 Sapele 20.60 15.40
25 Abuja 110.00 89.00
26 Makurdi 290.10 145.00
27 Mambila 0.00 0.00
28 Papalanto 0.00 0.00
Table 2: Load flow data of the Nigeria 28-bus power network showing load and generation at the buses [23] Bus
Number Code Bus Magnitude Voltage Degree Angle MW MVar Load MW MVarQminQmax Generator
Static MVar +Qc/-Ql
1 1 1.05 0 68.90 51.70 0.00 0.00 -1006 1006 0.00
2 2 1.05 0 0.00 0.00 670.00 0.00 -1030 1000 0.00
3 0 1.00 0 274.40 205.80 0.00 0.00 0.00 0.00 0.00
4 0 1.00 0 244.70 258.50 0.00 0.00 0.00 0.00 0.00
5 0 1.00 0 633.20 474.90 0.00 0.00 0.00 0.00 0.00
6 0 1.00 0 13.80 10.30 0.00 0.00 0.00 0.00 0.00
7 0 1.00 0 96.50 72.40 0.00 0.00 0.00 0.00 0.00
8 0 1.00 0 383.30 287.50 0.00 0.00 0.00 0.00 0.00
9 0 1.00 0 275.80 206.8 0.00 0.00 0.00 0.00 0.00
10 0 1.00 0 201.20 150.90 0.00 0.00 0.00 0.00 0.00
11 2 1.05 0 52.50 39.40 431.00 0.00 -1000 1000 0.00
12 0 1.00 0 427.00 320.20 0.00 0.00 0.00 0.00 0.00
13 0 1.00 0 177.90 133.40 0.00 0.00 0.00 0.00 0.00
14 0 1.00 0 184.60 138.40 0.00 0.00 0.00 0.00 0.00
15 0 1.00 0 114.50 85.90 0.00 0.00 0.00 0.00 0.00
16 0 1.00 0 130.60 97.90 0.00 0.00 0.00 0.00 0.00
17 0 1.00 0 11.00 8.20 0.00 0.00 0.00 0.00 0.00
18 2 1.05 0 0.00 0.00 495.00 0.00 -1050 1050 0.00
19 0 1.00 0 70.30 52.70 0.00 0.00 0.00 0.00 0.00
20 0 1.00 0 193.00 144.70 0.00 0.00 0.00 0.00 0.00
21 2 1.05 0 7.00 5.20 624.70 0.00 -1010 1010 0.00
Nigerian Journal of Technology Nigerian Journal of TechnologyNigerian Journal of Technology
Nigerian Journal of Technology Vol. 34 NVol. 34 NVol. 34 NVol. 34 Noooo. 3, July 2015 . 3, July 2015 . 3, July 2015 . 3, July 2015
570
570
570
570
Bus
Number Code Bus Magnitude Voltage Degree Angle MW MVar Load MW MVarQminQmax Generator
Static MVar +Qc/-Ql
23 2 1.05 0 70.30 36.10 388.90 0.00 -1010 1010 0.00
24 2 1.05 0 20.60 15.40 190.30 0.00 -1010 1010 0.00
25 0 1.00 0 110.00 89.00 0.00 0.00 0.00 0.00 0.00
26 0 1.00 0 290.10 145.00 0.00 0.00 0.00 0.00 0.00
27 2 1.05 0 0.00 0.00 750.00 0.00 -1010 1010 0.00
28 2 1.05 0 0.00 0.00 750.00 0.00 -1010 1010 0.00
Table 3: Transmission line data of the Nigeria 28-bus power network [23]
Bus Resistance (p.u.) Reactance (p.u.) From To
3 1 0.0006 0.0044
3 1 0.0006 0.0044
3 1 0.0006 0.0044
4 5 0.0007 0.0050
4 5 0.0007 0.0050
1 5 0.0023 0.0176
1 5 0.0023 0.0176
5 8 0.0110 0.0828
5 8 0.0110 0.0828
5 9 0.0054 0.0405
5 10 0.0099 0.0745
6 8 0.0077 0.0576
6 8 0.0077 0.0576
2 8 0.0043 0.0317
2 7 0.0012 0.0089
7 24 0.0025 0.0186
8 14 0.0054 0.0405
8 10 0.0098 0.0742
8 24 0.0020 0.0148
8 24 0.0020 0.0148
9 10 0.0045 0.0340
15 21 0.0122 0.0916
15 21 0.0122 0.0916
10 17 0.0061 0.0461
10 17 0.0061 0.0461
10 17 0.0061 0.0461
11 12 0.0010 0.0074
11 12 0.0010 0.0074
12 14 0.0060 0.0455
13 14 0.0036 0.0272
13 14 0.0036 0.0272
16 19 0.0118 0.0887
17 18 0.0002 0.0020
17 18 0.0002 0.0020
17 23 0.0096 0.0721
17 23 0.0096 0.0271
17 21 0.0032 0.0239
17 21 0.0032 0.0239
19 20 0.0081 0.0609
20 22 0.0090 0.0680
20 22 0.0090 0.0680
20 23 0.0038 0.0284
20 23 0.0038 0.0284
23 25 0.0038 0.0284
23 25 0.0038 0.0284
Bus Resistance (p.u.) Reactance (p.u.) From To
12 26 0.0071 0.0532
12 26 0.0071 0.0532
19 26 0.0059 0.0443
19 26 0.0059 0.0443
26 27 0.0079 0.0591
26 27 0.0079 0.0591
5 28 0.0016 0.0118
5 28 0.0016 0.0118
Figure 5: Bar chart showing voltage magnitude of Nigeria 28-bus power network with and without
STATCOM.
From the above Figure 5, it was observed that the voltage magnitudes in per unit of buses 9, 13, 14, 16 and 22 improved to 1.0 p.u. each within the statutory limit with the application of STATCOM.
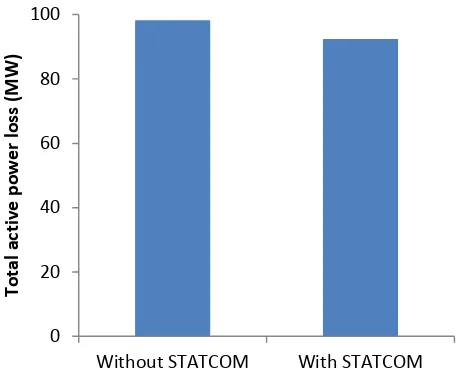
Also, the results revealed that there was an improvement on the transmission of active power at the inclusion of STATCOM on buses 9, 13, 14, 16 and 22. Figure 6 shows the system’s total active power loss with and without the application of STATCOM.
0 0.2 0.4 0.6 0.8 1 1.2
1 4 7 10 13 16 19 22 25 28
V
o
lt
a
g
e
m
a
g
n
it
u
d
e
(
p
.u
)
Bus Number
Nigerian Journal of Technology Nigerian Journal of TechnologyNigerian Journal of Technology
Nigerian Journal of Technology Vol. 34 NVol. 34 NVol. 34 NVol. 34 Noooo. 3, July 2015 . 3, July 2015 . 3, July 2015 . 3, July 2015
571
571
571
571
Figure 6: System’s total active power loss with andwithout STATCOM
From the above Figure 6, there was a reduction of 5.88% in total active power loss from 98.21 MW to 92.44 MW, thereby improving the active power transmission capacity of the transmission lines. These results show that STATCOM has the capability to improve the voltage at buses and reduce active power loss on the power system.
5. CONCLUSION 5. CONCLUSION 5. CONCLUSION 5. CONCLUSION
The advancement towards the improvement of power system performance has been a global concern.In this work, the effect of STATCOM as a FACT controller for improving power system performance had been studied using the Nigeria 330 kV, 28-bus power system as a case study. Since the quality of power supply for any given system depends on voltage at the buses and transmission power, it is imperative to keep the bus voltage within the specified statutory limit and reduce the transmission active power loss to minimum. Application of STATCOM on five (5) buses of the Nigeria 28-bus power network whose voltage value fell outside the statutory limit defined by 0.95I ViI 1.05
p.u. showed improvement on voltage magnitudes of the buses to 1.0 p.u and also reduced the transmission total active power loss from 98.21 MW to 92.44 MW, giving a 5.88% reduction in the total active power loss for the system. The results of this work show that STATCOM if deployed has the capacity to improve the voltage and power profiles of the Nigeria power system network and hence, could efficiently enhance electric power transmission.
6. 6. 6.
6. REFERENCESREFERENCESREFERENCESREFERENCES
[1] Pallavi, T and Smita, S. (2014). Benefits of FACTS controllers over AC transmission system, InternationalJournal of Electronics, Communication and Instrumentation Engineering Research and Development, 4 (2):13-26.
[2] Kumar, P., Kumar, N. and Akella, A.K. (2012). Review of D-STATCOM for stability analysis, IOSR Journal of Electrical and Electronics Engineering, 1 (2): 1-9. [3] Hingorani, N.G and L. Gyugyi, L. (2000). Understanding
FACTS: Concepts and Technology of Flexible AC Transmission Systems New York: Institute of Electrical and Electronic Engineers Press.
[4] Song, Y.H and Johns, A.T. (1999). Flexible AC Transmission Systems (FACTS), London: Institution of Electrical Engineers.
[5] Lerch, E. Povh, D. Witzmann, R. Hlebcar, R and Mihalic, R. (1994). Simulation and performance analysis of unified power flow controller, Conseil International des Grands Re´seaux Electriques, Paris, paper 140-205.
[6] Edvina, U. Claudio, A.C and John, R. (1997). Fundamental frequency model of static synchronous compensator, North American Power System Symposium (NAPS), Laramie, Wyoming, 49-54. [7] Gyugyi, L. Hingorani, N.GNannery, P.R and Tai, N.
(1990). Advanced static var compensator using gate turn-off thyristors for utility application, Conseil International des Grands Re´seaux Electriques, Paris, paper 3-203.
[8] Singh, R.P. Bharadwaj, S.K and Singh, R.K. (2014). Flexible AC Transmission System Controllers: A state of art. International Journal of Electronic and Electrical Engineering, 7 (8): 843-850.
[9] Sowjanya, S and Srinivasarao, J. (2012). Design of FACTS device for the improvement of power system stability using mathematical matching controller, IOSR Journal of Electrical and Electronics Engineering, 1 (3):7-11.
[10] Cimbals, R. krievs, O. and Ribickis, L. (2011). A static synchronous compensator for reactive power compensation under distorted mains voltage conditions, 10th International Symposium, Topical
Problems in the Field of Electrical and Power Engineering, Pärnu, Estonia, 10-15.
[11] Khederzadeh, M and Ghorbani, A. (2011). STATCOM modelling impacts on performance evaluation of distance protection of transmission line, European Transaction of Electrical Power, 21:2063-2079. [12] Khederzadeh, M and Ghorbani, A. (2011).
STATCOM/SVC impact on the performance of transmission line distance protection, IEEJ Transaction on Electrical and Electronics Engineering, 6: 525-533.
0 20 40 60 80 100
Without STATCOM With STATCOM
T
o
ta
l
a
ct
iv
e
p
o
w
e
r
lo
ss
(
M
W
Nigerian Journal of Technology Nigerian Journal of TechnologyNigerian Journal of Technology
Nigerian Journal of Technology Vol. 34 NVol. 34 NVol. 34 NVol. 34 Noooo. 3, July 2015 . 3, July 2015 . 3, July 2015 . 3, July 2015
572
572
572
572
[13] Vural, A.M and Bayindir, K.C. (2011). Quasi multi-pulse back-to-back static synchronous compensator employing line frequency switching 2-level GTO inverters, World Academy of Science, Engineering and Technology, 60:1863-1874.
[14] Singh, S.N. 2006. Flexible AC Transmission Systems (FACTS) controllers: an overview, International Journal of Energy Technology and Policy, 4 (3): 236-254.
[15] El-Moursi, M.S and Sharaf, A.M. (2005). Novel controllers for the 48-pulse VSCSTATCOM and SSSC for voltage regulation and reactive power compensation, IEEE Transactions on Power System, 20: 1985-1997.
[16] Sohel, H., Atiqur, R.K. and Jannat-E-N. (2014). Design of STATCOM for Power System Stability Improvement. Global Journal of Researches in Engineering: F, Electrical and Electronics Engineering. 14 (2), Version 1.0.
[17] Masood, T. Aggarwal, R.K. Qureshi, S.A. and Khan, R.A.J. (2010). STATCOM model against SVC control
model performance analyses technique by Matlab, International Conference on Renewable Energies and Power Quality, Granada, Spain.
[18] Gupta, J.B. (2011). A course in power system. New Delhi, India: S.K. Katari and Sons Publisher. [19] Pabla, A.S. (2011). Electric power distribution. Tata
McGraw-Hill, New Delhi, India.
[20] Glover, J.D and Sarma, M. (1989). Power system analysis and design. PWS-KENT Publishing Company, Boston, U.S.A.
[21] Gross, C.A. (1979). Power System. John Wiley and Son, New York, U.S.A.
[22] Adepoju, G.A and Komolafe, O.A. (2011). Analysis and modelling of static synchronous compensator (STATCOM): A comparison of power injection and current injection model in power flow study. International Journal of Advanced Science and Technology, 36:65-76.
![Figure 1: A simple STATCOM model [6]](https://thumb-us.123doks.com/thumbv2/123dok_us/10034575.1990159/2.595.367.501.122.339/figure-a-simple-statcom-model.webp)
![Figure 3: Thevenin’s equivalent circuit diagram of STATCOM: (a) STATCOM schematic diagram; (b) STATCOM equivalent circuit [22]](https://thumb-us.123doks.com/thumbv2/123dok_us/10034575.1990159/4.595.313.561.63.233/figure-thevenin-equivalent-statcom-statcom-schematic-statcom-equivalent.webp)
![Figure 4: The Nigeria 28-bus network [23]](https://thumb-us.123doks.com/thumbv2/123dok_us/10034575.1990159/6.595.38.559.490.791/figure-the-nigeria-bus-network.webp)
![Table 3: Transmission line data of the Nigeria 28-bus power network [23]](https://thumb-us.123doks.com/thumbv2/123dok_us/10034575.1990159/7.595.61.268.220.777/table-transmission-line-data-the-nigeria-power-network.webp)