Screening and Selection of Drought-Tolerant Groundnut
Varieties Based on Yield Performance
*1
Oppong-Sekyere, D.,
2Akromah, R.,
3Kena, A.W.,
4Larweh, V and
5Ozias-Akins, P.
1Department of Ecological Agriculture, Bolgatanga Polytechnic, P.O. Box 767, Bolgatanga, Ghana
2,3Department of Crop and Soil Sciences, KNUST-Kwame Nkrumah University of Science and Technology, Kumasi,
Ghana
4CSIR-Crops Research Institute, Kumasi, Ghana
5University of Georgia, National Environmentally Sound Production Agriculture Laboratory (NESPAL), Coastal Plain
Experiment Station, 2356 Rainwater Road Tifton, Georgia, USA 31794
Drought is the most important abiotic limitation to groundnut production in Northern Ghana. Drought, during the pod-filling stages is even more devastating. The current study was conducted to screen groundnut varieties, for drought-tolerance based on yield and other traits. Evaluation of groundnut genotypes was under two environments/water regimes; well-watered and water-stressed. ANOVA was run for Quantitative data. Means were separated by l.s.d. at 95% confidence level. Correlation analyses were performed using SPSS. Combined analysis of variance was computed for the groundnuts across water regimes. Dendrograms were generated using yield data and based on Euclidean distance. Scoring and ranking was used to assess disease incidence on a scale of 1-5. Results indicate that end-of-season drought caused pod yield reduction that varied across genotypes. The Drought Tolerance Index ranged from 0.53 (Kpanieli) to 2.40 (Agric-Manipinta). The highest yielding genotypes under water-stressed condition were Sinkara (582g/plot), Nkatie-sari (512g/plot), Ndogba (470g/plot), Chaco-pag (400g/plot) and Oboshie (381g/plot) and Chinese (local) (340g/plot). Farmers’ selected Sinkara, Ndogba, Chinese, Nkatie-sari, Agric-Manipinta and Chaco-pag based on pod yield and biomass production. Sinkara (0.8798), Sokan-donworor (0.8739), Kpach-Isah (0.8318) and Kpanieli (0.8016) recorded very high mean pod harvest index values, while Ndogba recorded the lowest (0.2252). Combined analysis of variance for pod yield among all the genotypes indicate that the groundnuts performed differently in both water regimes due to the significant interaction effect observed between water regimes and genotypes. Information generated from this study can be used to develop new groundnut varieties that combine higher yield and drought tolerant traits.
Keywords: Constraints, drought, end-of-season, environments, genotypes, tolerance
INTRODUCTION
Drought, especially during the pod-filling stages of groundnut growth is a major production constraint, particularly in the three Northern Regions of Ghana. This therefore causes a significant pod yield reduction and its subsequent reduction in productivity. Groundnut is grown widely under rainfed conditions in the semi-arid tropics, where drought stress is extensive and unavoidable. The yield of groundnut in the Northern Ghana, which doubles as the major producer, is frequently severely limited by drought arising from unpredictable rainfall, high evaporative demands and production on low water holding capacity soils.
There is also the problem of the relatively shorter seasons for growth of most crops in these semi-arid tropics in comparison with the savannah environments; this has a negative effect on the proper growth, maturity and yield of groundnuts. Notwithstanding, early maturing groundnut varieties with improved yield are essential for several agro-
*Corresponding Author: Daniel Oppong-Sekyere, Department of Ecological Agriculture, Bolgatanga Polytechnic, P.O. Box 767, Bolgatanga, Ghana. Email:
International Journal of Plant Breeding and Crop Science
Vol. 5(3), pp. 463-473, December, 2018. © www.premierpublishers.org.ISSN: 2167-0449
ecological environments of the semi-arid regions of Ghana, in particular, and the West Africa sub-region, in general. There is lack of and/or inadequate information regarding the genetic variability for drought-tolerant groundnut varieties.
An important objective in any groundnut improvement programme has always included breeding for cultivars that are better able to use less water to produce significant amount of yield. Drought tolerance for late maturity varieties of groundnut would be very advantageous. According to research (Jongrungklang et al., 2008), drought affects chlorophyll content and hinders plants’ ability and capacity to photosynthesize (Arunyanark et al., 2010). An important drought tolerance mechanism in groundnuts is the capacity to maintain chlorophyll density under conditions of water shortage Arunyanark et al., 2010; Wunna et al., 2009). Superior yield performance under moisture stress conditions is an important and reliable index of drought tolerance (Varshney et al, 2006). The objective of this research was to evaluate and select drought - tolerant groundnut varieties based on yield (the Drought Tolerance Index, DTI) and performance for other traits.
MATERIALS AND METHODS
i. Source of genetic materials
Sixteen (16) local and improved groundnut genotypes (Appendix 1) were screened in two water regimes or environments; Well-Watered and Water-Stressed (less-watered) in the 2016 minor season for drought tolerance.
ii. Experimental Site, Field Operations
Groundnut sowing was done on Saturday, 16th January, 2016 at Botanga Irrigation Fields, in the Northern Region of Ghana (in the dry season with temperature around 42°C).
Botanga irrigation scheme is located in the Northern Region of Ghana, in the Tolon-Kumbungu district; it lies between latitude 9° 30” and 9° 35” N and longitude 1° 20” and 1° 04” W. The cropping area is divided into two, upland and lowland, the upland is free draining soil and plots are designed for furrow irrigation. The upland area is for vegetables production and the lowland for rice production because of the nature of the soil that is heavily textured and irrigated by flooding (Abdul-Ganiyu et al., 2012). The irrigation system is an earth-filled dam of 12 m in height with a crest level of 5.00 m. The irrigation system has potential area of 570 ha and all the areas have been developed (Abdul-Ganiyu et al., 2012).
The total annual rainfall in the area is around 1,300 mm, which normally begins in March, reaches a peak in September and then drops sharply in November (Abdul- Ganiyu et al., 2012). Thereafter, there is a long dry period
from December to the end of February, during which only negligible amounts of rain are received. Mean monthly temperatures remain high throughout the year only falling around 26oC in August in Botanga. March and April are the
hottest months recording nearly 40 oC (Abdul- Ganiyu et al., 2012).
iii. Planting Operations, Screening and Evaluations in Well-Watered and Water-Stressed Environments
The crop was grown on ridges in a two-row plot system, 2 m long, observing a spacing of 50 cm between rows and 20 cm between plants (Arunyanark et al., 2010). Groundnut seeds were hand planted in two environments; well-watered and water-stressed conditions. The balanced α- lattice design (10 x 10) was adopted, and replicated four times. Each plot measured 0.5 m by 2 m (1 m2) with each
block containing ten (10) varieties. The distance between the two water regimes (well-watered and water-stressed) was 5 m, while another 5 m was kept between replications. The trial was surrounded by two border rows.
Surface irrigation: A watering can be used to apply water during the experiment.
iv. Drought Score and Assessment: Visual Ratings and Phenotypic Evaluation
Groundnut plants which showed symptoms of drought beginning from 75 DAP were recorded (Table 7). Severity of drought incidence was scored on a scale of 1 – 5, where 1= no symptoms (< 25% of drought; Highly Tolerant), 2= slight symptoms (25-50% of crop foliage affected; Tolerant), 3 = moderate symptoms (50-75% of crop foliage affected; Moderately Tolerant), 4 = severe symptoms (>75% of crop foliage affected; Susceptible to drought), and 5 = very severe symptoms (about 100% of crop foliage affected; Highly Susceptible to drought) (Table 7) (Nageswara and Nigam, 2003).
v. Irrigation Management for Well-Watered and Water-Stressed Environments
The experiment was carried out between January and June, 2016; that is the most critical month with high temperature during the day, with an average of 40oC. After
sowing, the well-watered plots were irrigated fully two times a day until harvest stage.
*D: Days, *WS: Water-Stressed, *DAS: Days after Sowing, 14 D: 14 days, 10 D: 10 days, 7 D: 7 days Figure 1: Drought stress imposition and irrigation frequencies (Adapted from; Mamadou, Coulibaly Adama, PhD. Thesis, 2013; http://ugspace.ug.edu.gh)
vi. Data Collection
The following yield and yield components data were collected for both environment 1 (well-watered) and environment 2 (water-stressed) regimes.
Biomass Weight (Bio, g): Above ground biomass (Haulm Weight) was calculated from ten (10) plants selected randomly from all the treatments. Haulm weight was taken by weighing the harvest using a Top Pan Balance after 3 weeks air drying.
Pod Yield (PY): Pod yield was determined from 10 plants selected randomly from all the treatments after air and sun drying to constant weight for two weeks.
Pod Weight: Fresh weight of filled pods from ten plants selected at random from all the treatments was taken; the pods were sun and/or air dried to constant moisture content and their dry weights recorded.
Seed Weight: Pods selected from ten (10) plants at random from all the treatments were shelled by hand at moisture level of about 10% to 13% and seed weights recorded.
100 Seed Weight: Hundred (100) seeds were selected at random and counted and weighed per each selected treatment. Percent seed moisture were taken using a Protimeter moisture metre. All weights were taken using Camry electronic balance.
Harvest index (HI): HI was calculated by using the following formula:
HI = 𝑇𝑜𝑡𝑎𝑙 𝑑𝑟𝑦 𝑝𝑜𝑑 𝑤𝑒𝑖𝑔ℎ𝑡 (𝑒𝑐𝑜𝑛𝑜𝑚𝑖𝑐 𝑦𝑖𝑒𝑙𝑑),(𝑔)
𝑇𝑜𝑡𝑎𝑙 𝐵𝑖𝑜𝑚𝑎𝑠𝑠 (ℎ𝑎𝑢𝑙𝑚) 𝑤𝑒𝑖𝑔ℎ𝑡,(𝑔)
(Girdthai et al., 2010a) (www.fao.org/docrep/004/Y3655E/ y3655e07.hmt).
Shelling Percentage (%S): Shelling percentage was calculated using the following formula: %S = Seed Weight (g) / Dry Pod Weight and expressed in percentage: - (Seed Dry Weight / Pod Dry Weight) x 100.
Drought Tolerance Index (DTI): DTI was calculated for each trait as the ratio of the trait (e.g. pod yield) under Water-Stress (WS) treatment to that under Well-Watered (WW) condition as suggested by Nautiyal et al. (2002b).
vii. Statistical Analysis
Combined analysis of variance was computed for the groundnut entries across water regimes (Gomez and Gomez, 1984) for yield and yield components data using STATA pc software version 12.0. Correlation analysis was performed for yield parameters across water regimes. SPSS pc software, version 22 was used to generate a dendrogram for the groundnut accessions as per on pod yields and based on Euclidian distance.
RESULTS
Selection Criteria for Drought-Tolerant Varieties
The mean performance of sixteen (16) groundnut genotypes for the traits measured under both well-watered and water-stressed regimes is shown in Table 1.
The best six drought tolerant genotypes were selected based on the following criteria:
(i) The highest yielding genotype under Water-Stressed condition; Sinkara (local) (582g/plot), Nkatie-sari (SARI) (512g/plot), Ndogba (local) (470g/plot), Chaco-pag (local) (400g/plot) and Oboshie (CRI) (381g/plot) and Chinese (local) (340g/plot)
(ii) The highest yielding genotype under Well-Watered condition; Sinkara (Local) (600g/plot), Nkatie-sari (SARI) (589g/plot), Ndogba (local) (567g/plot), Chaco-pag (local) (562g/plot), Sokan-donworor (local) (363g/plot) and Chinese (local) (321g/plot).
(iii) The least yield difference between stressed and non-stressed conditions; Yenyawoso (CRI) (13), Sinkara (local) (18), Chinese (local) (19), F-Mix (SARI) (22), Obolo (CRI) (22) and Simpelgu (local) (38).
(iv) The Drought Tolerance Index (DTI) (Higher DTI indicates genotype is drought tolerant) Nautiyal et al. (2002b): Agric-Manipinta (Local) (2.40), Sumnut-23 (SARI) (2.36), Kpach-Isah (local) (1.56), Oboshie (CRI) (1.41), Sumnut-22 (SARI) (1.20), and Chinese (local) (1.06).
(v) Farmers’ preferred varieties: Sinkara (local), Ndogba (local), Chinese (local), Nkatie-sari (SARI), Agric-Manipinta (local) and Chaco-pag (local).
(vi) Days to maturity (early maturity); Chinese (local), Ndogba (local), Kpach-Isah (local), Simpelgu (local), Yenyawoso (CRI).
Table 1: Pod yield of entries under drought stress (WS) and their performance under well-watered (WW) conditions and their respective drought tolerance indices
No. Variety PodYield underWell-Watered (WW),
(g/plot)
PodYield under Water-Stressed (WS), (g/plot)
LeastPod Yield(g) difference =
(WW-WS)
Drought Tolerance Index
(DTI)= WS/WW
1 Nkatie-Sari (SARI)e 589c 512 77 0.87
2 Chaco-pag (Local)e 562c 400 162 0.71
3 F-Mix (SARI) 102a 80 22 0.78
4 Sinkara (Local)a, b, d, e 600c 582 18 0.97
5 Agric-Manipinta (Local)c 125a 300 175 2.40
6 Ndogba (Local)e 567c 470 97 0.83
7 Sumnut-23 (SARI) 106a 250 144 2.36
8 Sokan-Donworor (Local) 363bcd 322 41 0.89 9 Sumnut-22 (SARI) 250abc 300 50 1.20
10 Chinese (Local)e 321bcd 340 19 1.06
11 Yenyawoso (CRI) 282abc 295 13 1.05 12 Simpelgu (Local) 270abc 232 38 0.86
13 Oboshie (CRI) 270abc 381 111 1.41
14 Kpach-Isah (Local) 109a 170 61 1.56
15 Kpanieli (SARI) 192b 101 91 0.53
16 Obolo (CRI) 200b 222 22 1.11
NB: Higher DTI indicates genotype is drought tolerant
a: best high yielding genotype(s) under WW, b: best high yielding genotype(s) under WS, c: genotype(s) with the highest DTI, d: Entries selected based on the least yield difference between WW & WS, e: Entries selected based on good performance for all traits
WW: Well Water, WS: Water stress, DTI: Drought Tolerance Index, ‘Chinese’ = ‘China’ Means sharing a letter in the group label are not significantly different at the 5% level.
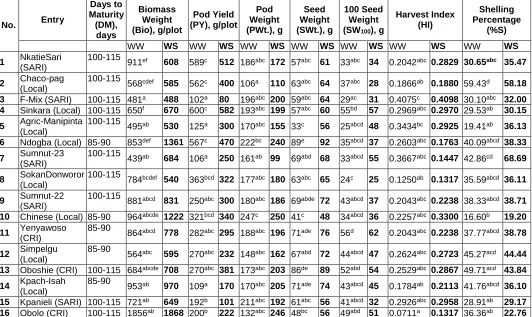
Table 2: Mean Performance of yield and yield components of entries under Well-Watered (WW) and Water-Stressed (WS) (drought) Environments
No. Entry
Days to Maturity (DM),
days
Biomass Weight (Bio), g/plot
Pod Yield (PY), g/plot
Pod Weight (PWt.), g
Seed Weight (SWt.), g
100 Seed Weight (SW100), g
Harvest Index (HI)
Shelling Percentage
(%S)
WW WS WW WS WW WS WW WS WW WS WW WS WW WS 1 NkatieSari
(SARI)
100-115
911ef 608 589c 512 186abc 172 57abc 61 33abc 34 0.2042abc 0.2829 30.65abc 35.47
2 Chaco-pag
(Local)
100-115
568cdef 585 562c 400 106a 110 63abc 64 37abc 28 0.1866ab 0.1880 59.43d 58.18 3 F-Mix (SARI) 100-115 481a 488 102a 80 196abc 200 59abc 64 29ac 31 0.4075c 0.4098 30.10abc 32.00 4 Sinkara (Local) 100-115 650f 670 600c 582 193abc 199 57abc 60 55bd 57 0.2969abc 0.2970 29.53ab 30.15 5 Agric-Manipinta
(Local)
100-115
495ab 530 125a 300 170abc 155 33c 56 25abcd 48 0.3434bc 0.2925 19.41ab 36.13 6 Ndogba (Local) 85-90 853def 1361 567c 470 222bc 240 89e 92 35abcd 37 0.2603abc 0.1763 40.09abcd 38.33 7 Sumnut-23
(SARI)
100-115
439ab 684 106a 250 161ab 99 69abd 68 33abcd 55 0.3667abc 0.1447 42.86cd 68.69
8 SokanDonworor
(Local)
100-115
784bcdef 540 363bcd 322 177abc 180 63abc 65 24c 25 0.1250ab 0.1317 35.59abcd 36.11
9 Sumnut-22
(SARI)
100-115
881abcd 831 250abc 300 180abc 186 69abde 72 43abcd 37 0.2043abc 0.2238 38.33abcd 38.71 10 Chinese (Local) 85-90 964abcde 1222 321bcd 340 247c 250 41c 48 34abcd 36 0.2257abc 0.3300 16.60b 19.20 11 Yenyawoso
(CRI)
85-90
864abcd 778 282abc 295 188abc 196 71ade 76 56d 62 0.2043abc 0.2238 37.77abcd 38.78
12 Simpelgu
(Local)
85-90
564abc 595 270abc 232 148abc 162 67abd 72 44abcd 47 0.2624abc 0.2723 45.27acd 44.44 13 Oboshie (CRI) 100-115 684abcde 708 270abc 381 173abc 203 86de 89 52abd 54 0.2529abc 0.2867 49.71acd 43.84 14 Kpach-Isah
(Local)
85-90
953ab 970 109a 170 170abc 205 71ade 74 43abcd 45 0.1784ab 0.2113 41.76abcd 36.10 15 Kpanieli (SARI) 100-115 721ab 649 192b 101 211abc 192 61abc 56 41abcd 32 0.2926abc 0.2958 28.91ab 29.17 16 Obolo (CRI) 100-115 1856ab 1868 200b 222 132abc 246 48bc 56 49abd 51 0.0711a 0.1317 36.36ab 22.76
Ranking of Groundnut Genotypes by Clustering based on Mean Performance for yield and yield components of entries under (WW) and (WS) (drought) Environments
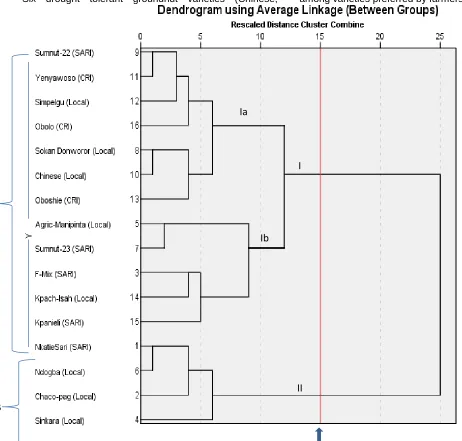
Based on pod yield and performance for other traits under well-watered (WW) and water-stressed (WS) (end-of-season drought) conditions (Tables 1 and 2), the groundnut genotypes were used to generate a dendrogram (Figure 2).
At a relative rescaled Euclidian distance of 15, two major cluster groups; clusters I (the biggest cluster of 12 varieties) and II (the smallest with 4 accessions) were produced. Groundnut genotypes were clustered into groups based on the selection criteria for drought-tolerant varieties described previously.
Six drought tolerant groundnut varieties (Chinese,
Sumnut-22, Agric-Manipinta, Sumnut-23, Oboshie and Kpach-Isah, all hypogaea varieties except Oboshie and Kpach-Isah), were clustered under cluster group ‘I’ based on varieties with higher drought tolerance index (DTI) (Figure 2).
Cluster group I contained two sub-clusters; Ia (comprising 3 of the drought tolerant varieties; Sumnut-22, Obolo and Chinese) and Ib (with 3 other drought tolerant varieties; Agric-Manipinta, Sumnut-23 and Kpach-Isah) (Figure 2). Per the selection criteria for drought tolerance (Section 4.5.1), four (Nkatie-sari, Ndogba, Chaco-pag and Sinkara) out of the six groundnut varieties that qualified among the best drought-tolerant groundnut varieties clustered under the second cluster group II. These four mentioned groundnut varieties and ‘Oboshie’ and ‘Chinese’ varieties (in cluster group Ia) were the highest yielding groundnut genotypes under water-stressed (drought) condition and among varieties preferred by farmers (Figure 2).
Figure 2: Dendrogram of groundnut accessions generated by SPSS vs22 pc software, based on Euclidian distance as per pod yield and performance for other traits, for both Well-Watered (WW) and Water-Stressed (WS) Environments (From top: Clusters A and B).
A
B
I
II
Ia
Correlation Analysis of Yield and Yield Components for Groundnut Accessions under well-watered (WW) and water-stressed (WS) Environmental Conditions
Results of general correlation analysis of pod yields for well-watered (WW) and water-stressed (WS) environments (Table 3) indicated a significant (F ≤ 0.05) and positive association between pod yield under WW and that under WS condition (r = 0.8684), but a significant (F ≤ 0.05) and negative relations with Drought Tolerance Index at r = -0.093 (Table 3). Least pod yield difference also recorded a significant (F ≤ 0.05) and positive relationship with DTI at r = 0.5026 (Table 3).
Correlation Analysis under Well-Watered (WW) Environment
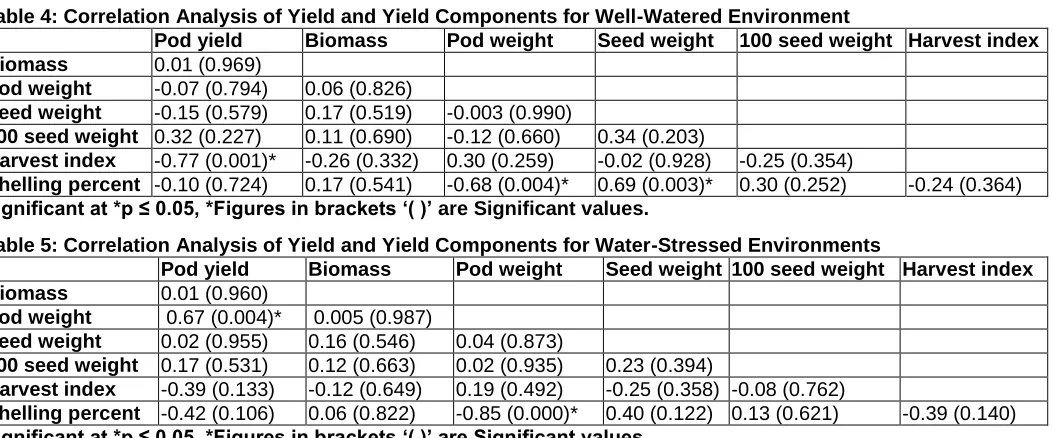
Results of the correlation analysis for pod yield under well-watered (WW) environment (Table 4) indicated significant and negative association was observed between pod yield and harvest index (r = -0.77) at a significant value of p = 0.001. There was significant and negative correlation between pod weight and shelling percentage (r = -0.68) at p = 0.004 significant value. Significant and positive relationship was obtained between seed weight and shelling percentage (r = 0.69) at a significant value of p = 0.003.
Correlation Analysis under water-stressed (WS) Environment
Correlation analysis for yield and yield components for water-stressed (WS) environmental condition, on the other hand, indicated a significant and positive association between pod yield and pod weight (r = 0.67) at p = 0.004. Significant and negative relationship was observed between pod weight and shelling percentage (-0.85) at p = 0.000 significance (Table 3).
Table 3: General Correlation Analysis of Pod Yields for WW and WS Environments
*p < 0.05
Table 4: Correlation Analysis of Yield and Yield Components for Well-Watered Environment
Pod yield Biomass Pod weight Seed weight 100 seed weight Harvest index
Biomass 0.01 (0.969)
Pod weight -0.07 (0.794) 0.06 (0.826)
Seed weight -0.15 (0.579) 0.17 (0.519) -0.003 (0.990)
100 seed weight 0.32 (0.227) 0.11 (0.690) -0.12 (0.660) 0.34 (0.203)
Harvest index -0.77 (0.001)* -0.26 (0.332) 0.30 (0.259) -0.02 (0.928) -0.25 (0.354)
Shelling percent -0.10 (0.724) 0.17 (0.541) -0.68 (0.004)* 0.69 (0.003)* 0.30 (0.252) -0.24 (0.364)
Significant at *p ≤ 0.05, *Figures in brackets ‘( )’ are Significant values.
Table 5: Correlation Analysis of Yield and Yield Components for Water-Stressed Environments
Pod yield Biomass Pod weight Seed weight 100 seed weight Harvest index
Biomass 0.01 (0.960)
Pod weight 0.67 (0.004)* 0.005 (0.987)
Seed weight 0.02 (0.955) 0.16 (0.546) 0.04 (0.873)
100 seed weight 0.17 (0.531) 0.12 (0.663) 0.02 (0.935) 0.23 (0.394)
Harvest index -0.39 (0.133) -0.12 (0.649) 0.19 (0.492) -0.25 (0.358) -0.08 (0.762)
Shelling percent -0.42 (0.106) 0.06 (0.822) -0.85 (0.000)* 0.40 (0.122) 0.13 (0.621) -0.39 (0.140)
Significant at *p ≤ 0.05, *Figures in brackets ‘( )’ are Significant values.
Participatory Varietal Selection (PVS) by Farmers; Selection of Best Groundnut Genotypes under both Well-Watered and Water-Stressed Environments
Pod yield and biomass production were the major criteria considered by farmers in the selection of the best groundnut genotypes since they added to the economic value of the variety. Farmers indicated that groundnut varieties with high biomass could be a good source of animal feed (fodder).
Under Well-Watered environment, the farmers’ preferences were Sinkara (Local), Chaco-pag (local) and
Nkatie-sari (SARI).
Under Water-Stressed environment, the best genotypes selected by farmers were Ndogba (local), Chinese (local) and Obolo (CRI).
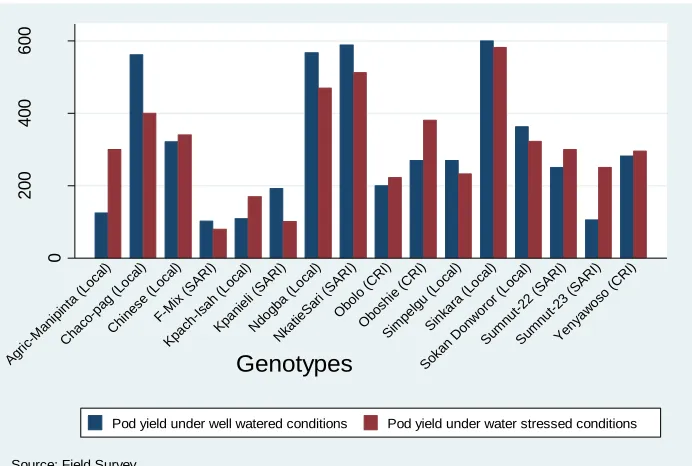
Effect of Drought on pod yield
The groundnut genotype, Sinkara (local) recorded the highest pod yield (600 g/10plants) under both well watered and water-stressed (end-of-season drought) environments (Table 1 and 2).
Pod yield (WW)
Pod yield (WS)
Least pod
yield DTI
Pod yield
(WW) -
Pod yield
(WS) 0.8684* -
Least pod
yield -0.0174 0.0993 -
Figure 3: Pod yield performances under both Well-Watered (WW) and Water-Stressed (WS) environments *Means may be significantly different from each other at F ≤ 0.05
Groundnut genotypes including Nkatie-sari, Ndogba, Chaco-pag, Sokan-donworor and Chinese performed well under both water regimes. Genotypes with least yield difference included Yenyawoso, Sinkara, and Chinese (Table 1).
Based on the selection criteria defined previously, the six best drought tolerant genotypes were Sinkara (local), Ndogba (local), Chinese (local), Chaco-pag (local), Nkatie-sari (SARI) and Agric-Manipinta (local).
The Drought Tolerance Index (DTI) ranged from 0.53 to 2.40 for all the genotypes screened (Table 1). Agric-Manipinta (local) had the highest DTI (2.40) whereas the lowest DTI was recorded by Kpanieli (0.53). Agric-Manipinta (local) was therefore the most drought tolerant genotype followed by Sumnut-23 (SARI), Kpach-Isah (local), Oboshie, Sumnut-22 (SARI), Obolo (CRI), Chinese (local) and Yenyawoso (CRI) (Table 1). Interestingly, most of these groundnut genotypes that recorded higher DTI did not record exceptionally high pod yield figures (Table 2). General pod yield performances for the groundnuts evaluated are shown in Figure 3.
Results of Combined Correlation Analysis for Well-Watered and Water-Stressed Environments
Results of the combined correlation analysis for yield and yield components under the two water regimes (WW and WS) (Table 6) indicated a negative and significant (F ≤ 0.05) association between pod yield and the following traits; biomass (r = - 0.2874), seed weight (-0.5256) and shelling percentage (-0.4070) but a positive and significant (F ≤ 0.05) relationship with harvest index (r = 0.3935). Biomass produced significant (F ≤ 0.05) and positive correlation with seed weight (r = 0.2910) and 100 seed weight (r = 0.3129) but negative and significant (F ≤ 0.05) association with harvest index (-0.4347). Pod weight correlated positively and significantly (F ≤ 0.05) with 100 seed weight but produced a significant (F ≤ 0.05) and negative association with shelling percentage (-0.5119). Association between seed weight and 100 seed weight was significant (F ≤ 0.05) and positive at r = 0.7982, similar with shelling percentage (r = 0.6993), but negative with harvest index (r = -0.6515). The association between hundred seed weight and harvest index was significant (F ≤ 0.05) and negative (r = -0.6559), but positive with shelling percentage (r = 0.4444). Harvest index and shelling percentage were negatively and significantly (F ≤ 0.05) correlated at r = -0.4279 (Table 6).
Table 6: Combined Correlation Analysis for groundnuts based on yield and its related traits
Pod yield Biomass Pod weight Seed weight 100seed weight Harvest Index Shelling % Pod yield -
Biomass -0.2874* -
Pod weight -0.0792 0.1719 -
Seed weight -0.5256* 0.2910* 0.1623 -
100 seed weight -0.4541* 0.3129* 0.2973* 0.7982* -
Harvest Index 0.3935* -0.4347* -0.2665 -0.6515* -0.6559* -
Shelling % -0.4070* 0.2413 -0.5119* 0.6993* 0.4444* -0.4279* -
Significant at *p ≤ 0.05
0
200
400
600
P
o
d
yie
ld
(g
)
Agric
-Man
ipin ta (L
ocal )
Cha co-p
ag (L ocal
)
Chi
nese
(Loc al)
F-M
ix (SAR
I)
Kpac
h-Isa h (L
ocal )
Kpan
ieli (SAR
I)
Ndo gba
(Loc al)
Nka tieSa
ri (SAR I)
Obo
lo (C RI)
Obo
shie (CR
I)
Sim pelg
u (L ocal
)
Sink ara
(Loc al)
Soka
n D onw
oro r (L
ocal )
Sum
nut-2
2 (SAR
I)
Sum
nut-2
3 (SAR
I)
Yeny
awos
o (C RI)
Genotypes
Source: Field Survey
Mean Drought Score Based on Visual Rating Assessment
Drought Score and Assessment: Visual Ratings and Phenotypic Evaluation
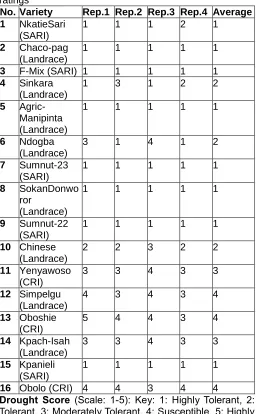
According to the field visual/phenotypic drought identification and scoring, and based on the above criteria, the following average drought scores (Table 7), were recorded among the groundnut varieties;
(i) Eight highly tolerant varieties were observed (Nkatie-sari, Chaco-pag, F-Mix, Agric-Manipinta, Sumnut-23, Sokan-donworor, Sumnut-22 and Kpanieli).
(ii) Three (3) tolerant varieties were observed (Sinkara, Ndogba and Chinese).
(iii) Two (2) moderately tolerant varieties were recorded; Yenyawoso and Kpach-Isah.
(iv) Three (3) drought-susceptible varieties were recorded among the groundnuts, as per the criteria defined above; Simpelgu, Oboshie and Obolo (Table 7).
Table 7: Mean drought Score based on phenotypic/visual ratings
No. Variety Rep.1 Rep.2 Rep.3 Rep.4 Average 1 NkatieSari
(SARI)
1 1 1 2 1
2 Chaco-pag (Landrace)
1 1 1 1 1
3 F-Mix (SARI) 1 1 1 1 1
4 Sinkara (Landrace)
1 3 1 2 2
5 Agric-Manipinta (Landrace)
1 1 1 1 1
6 Ndogba (Landrace)
3 1 4 1 2
7 Sumnut-23 (SARI)
1 1 1 1 1
8 SokanDonwo ror
(Landrace)
1 1 1 1 1
9 Sumnut-22 (SARI)
1 1 1 1 1
10 Chinese (Landrace)
2 2 3 2 2
11 Yenyawoso (CRI)
3 3 4 3 3
12 Simpelgu (Landrace)
4 3 4 3 4
13 Oboshie (CRI)
5 4 4 3 4
14 Kpach-Isah (Landrace)
3 3 4 3 3
15 Kpanieli (SARI)
1 1 1 1 1
16 Obolo (CRI) 4 4 3 4 4
Drought Score (Scale: 1-5): Key: 1: Highly Tolerant, 2: Tolerant, 3: Moderately Tolerant, 4: Susceptible, 5: Highly Susceptible.
DISCUSSION
General performance for drought tolerance
Based on the following measurement criteria for drought tolerance; (i) yield performance under water-stressed environment, (ii) yield performance under well-watered environment, (iii) least yield difference between stressed and non-stressed conditions, (iv) the Drought Tolerance Index (DTI), (v) end-of-season drought tolerance, (vi) farmer’s preferred varieties, and (vii) date of maturity (early maturity), some promising groundnut varieties with good performance for pod yield under drought stress included; Sinkara (landrace). The Drought Tolerance Index (DTI) (Higher DTI indicates genotype is drought tolerant) (Nautiyal et al., 2002b); Agric-Manipinta (landrace) (2.40), Sumnut-23 (SARI) (2.36), Kpach-Isah (landrace) (1.56), Oboshie (CRI) (1.41), Sumnut-22 (SARI) (1.20), and Chinese (landrace) (1.06) varieties were also identified.
Farmers selected Sinkara (landrace), Ndogba (landrace), Chinese (landrace), Nkatie-sari (SARI), Agric-Manipinta (landrace), Obolo (CRI) and Chaco-pag (landrace) based on performance for pod yield and biomass production under both water regimes (well-watered and water-stressed) due to their economic value added to the variety, such as oil content and biomass. Abdullah et al. (2007) reported 18 – 24 pods per plant in a similar study in groundnuts. Virk et al. (2005) reported that groundnut varieties differ significantly in the number of pods per plant. Reddy et al. (2003b) and Camberling and Diop (1999), have reported varying average yields in most regions of Africa and Asia particularly in the major season. The selected genotypes by the farmers are among the drought tolerant varieties identified in this study. Therefore, farmers' involvement in this study was very useful because it enabled the breeder/researcher to take farmers' preferred traits into consideration. Farmers were very happy to be involved in the selection of parental lines.
In this study, end-of-season drought caused pod yield reduction that varied from genotype to genotype. However, certain genotypes showed least pod yield difference in both water regimes. The varieties Yenyawoso, Sinkara, and Chinese that showed least pod yield difference can be used by farmers in the short time as drought tolerant varieties prior to improvement of their popular varieties identified through the PRA study.
Phenotypic (visual rating) assessments of drought in the current study based on drought symptoms at 75 DAP revealed a confirmation of drought tolerance in the groundnut genotypes identified, thus, eight highly tolerant varieties; Nkatie-sari, Chaco-pag, F-Mix, Agric-Manipinta, Sumnut-23, Sokan-donworor, Sumnut-22 and Kpanieli were identified. Also, three tolerant varieties; Sinkara, Ndogba and Chinese were identified and two moderately tolerant varieties were identified; Yenyawoso and Kpach-Isah.
Research Institutions such as CSIR-CRI and CSIR-SARI have developed some drought and disease tolerant varieties, but these have unfortunately not yet reached the farmers and seed companies (Adu-Dapaah et al., 2007). Farmers’ selected their preferred groundnut varieties based on their earliness, drought and disease tolerance and their potential for high-yielding and biomass production, but selection of a preferred variety is only one part of the success story. In order for these improved varieties to reach a large number of farmers, various recognized actors such as registered seed companies, Research Institutes, Ministry of Food and Agriculture (MoFA), must ensure that certified breeder seeds are available to licensed seed companies to produce subsequent classes of seed at very affordable prices for farmers.
CONCLUSION
The present study showed that, end-of-season drought caused significant decline in groundnut pod yield varying from genotype to genotype. However, most of the genotypes showed significant potential for drought tolerance based on pod yield and performance for other characteristics. These promising groundnut genotypes could be used as parental lines to develop drought-tolerant varieties. Groundnut genotypes that showed least pod yield difference in both water regimes could as well be adopted by farmers in the short term as drought-tolerant cultivars while they wait upon breeders to improve upon their popular groundnut varieties (landraces). Farmers preferred groundnut cultivars which come with traits such as high pod yield, high oil content and biomass (animal fodder), due to the extra economic value it adds to the crop.
REFERENCES
Abdullah, T., Rahmianna A. A., Hardaningsih, S and Rozi, F. (2007). Increasing Groundnut Yield on Dry Land Alfisols in Indonesia. Journal of SAT Agricultural Research, 5(1).
Abdul-Ganiyu, S., Amaanatu, M. K and Korese, J. K. (2012) Water Use Efficiency and Productivity for Rice (Oryza Sativa) in the Botanga Irrigation Scheme of Northern Region of Ghana. Agricultural Science Research Journal, 2(7): 362–368.
Adu-Dapaah, H. K., Asumadu, H., Lamptey, J. N. L., Haleegoah, J and Asafo-Adjei, B. (2007). Farmer Participation in Groundnut Varietal Selection. African Crop Science Conference Proceedings, 8: 1435 – 1439.
Arunyanark, A., Jogloya, S., Wongkaewb, S., Akkasaenga, C., Vorasoota, N., Kesmalaa, T and Patanothaia, A. (2010). Heritability of Aflatoxin Resistance Traits and Correlation with Drought Tolerance Traits in Peanut. Field Crops Research, 117, 258-264.
Camberlin, P and Diop, M. (1999). Inter-relationships between Groundnut Yields in Senegal, Inter Annual Rainfall Variability and Sea Surface Temperatures.
Theoretical and Applied Climatology, 63, 163-181. Girdthai, T., Jogloy, S., Vorasoot, N., Akkasaeng, C.,
Wongkaew, S., Holbrook, C. C and Patanothai, A. (2010a). Heritability of and Genotypic Correlations between, Aflatoxin Traits and Physiological Traits for Drought Tolerance under End-of-season Drought in Peanut (Arachis hypogaea L.). Field Crops Research,
118, 169-176.
Girdthai, T., Jogloy, S., Vorasoot, N., Akkasaeng, C., Wongkaew, S., Holbrook, C. C and Patanothai, A. (2010b). Associations between Physiological Traits for Drought Tolerance and Aflatoxin Contamination in Peanut Genotypes under Terminal Drought. Plant Breeding,129, 693-699.
Gomez, K. A and Gomez, A. A. (1984). Statistical Procedures for Agricultural Research. John Wiley & Sons, New York. 45p.
Jongrungklang, N., Toomsan, B., Vorasoot, N., Jogloy S., Kesmala, T and Patanothai, A. (2008). Identification of Peanut Genotypes with High Water-Use Efficiency under Drought Stress Conditions from Peanut Germplasm of Diverse Origins. Asian Journal of Plant Sciences, 7, 628-638.
Nageswara, R. R. C and Nigam, S. N. (2003). Genetic Options for Drought Management in Groundnut. In: Management of Agricultural Drought - Agronomic and Genetic Options. Science Publishers, Inc, 123-141. Nautiyal, P. C. (2002a). Groundnut: Post-harvest
Operations. Mejia, D. (Ed) ICAR (National Research Center for Groundnut). Pp 16.
Nautiyal, P. C., Nageswara, R. R. C and Joshi, Y. C. (2002b). Moisture Deficit–Induced Changes in Leaf Water Content, Leaf Carbon Exchange Rate and Biomass Production in Groundnut Cultivars Differing in Specific Leaf Area. Field Crops Research, 74, 67-79. Reddy, T.Y., Reddy V.R and Anbumozhi, V. (2003a).
Physiological Responses of Groundnut (Arachis hypogea L.) to Drought Stress and its Amelioration: A Critical Review. Plant Growth Regulation, 41: 75-88. Reddy, T.Y., Reddy V.R and Anbumozhi, V. (2003b).
Physiological Responses of groundnut (Arachis hypogaea L.) to Drought Stress and its Amelioration: A Review. Acta Agronomica Hungarica, 51: 205-227. Varshney, R.K., Hoisington, D.A and Tyagi, A.K. (2006).
Breeding. Trends Biotechnol. 2006; 24:490 - 499. Virk, A.S., Kaul, J.N., Bhangoo, B.S and Singh, A. (2005).
Influence of Planting Techniques and Plant Population on Biology and Pod productivity of Summer Groundnut varieties. Research on crops, 6(1): 173 – 174.
Accepted 7 November 2018
Citation: Oppong-Sekyere D., Akromah R., Kena A.W., Larweh V., Ozias-Akins P. (2018). Screening and Selection of Drought-Tolerant Groundnut Varieties Based on Yield Performance. International Journal of Plant Breeding and Crop Science 5(3): 463-473.
Copyright: © 2018 Oppong-Sekyere et al. This is an open-access article distributed under the terms of the Creative Commons Attribution License, which permits unrestricted use, distribution, and reproduction in any medium, provided the original author and source are cited.
APPENDICES
Appendix 1: Source, Sub-species, Days to Maturity and Phenotypic Characteristics of Groundnut Genotypes Studied
№. Genotype
*Sub-Species
Source Days to Maturity,
days
Phenotypic Characteristics and Other Trait Drought
Characteristics
Early Leaf Spot disease
Late Leaf Spot disease
Oil Content and Other Traits
1 Nkatie-sari Hypogaea (Virginia)
CSIR-SARI, Ghana
100-115 (110)
Tolerant Highly Tolerant
Highly Tolerant
Oil Content: 46%, Seed Colour: Light tan testa colour
2 Chaco – pag Fastigiata Landrace, Ghana
100-115 Tolerant Moderately Tolerant
Moderately Tolerant
Seed colour: Red
3 F – mix Hypogaea (Spanish)
CSIR-SARI, Ghana
100-115 (120)
Tolerant Highly Tolerant
Highly Tolerant
Oil Content: 49% Seed colour: Tan with red/brown shades Av. Yield: 2500kg/ha Highly Tolerant to Rosette and Rust
4 Sinkara Hypogaea (Spanish)
Landrace, Ghana
100-115 (120)
Tolerant Tolerant Tolerant Oil Content: 45% Seed colour: Red Yield Potential: 2.2t/ha
5 Agric-Manipinta
Hypogaea (Spanish)
Landrace, Ghana
100-115 (110-120)
Tolerant Tolerant Tolerant Oil Content: 47% Seed colour: red teste High yield potential
6 Ndogba Fastigiata Landrace, Ghana
85-90 Moderately Tolerant
Moderately Susceptible
Moderately Susceptible
Seed colour: Tan red
7 Sumnut – 23 Hypogaea CSIR-SARI, Ghana
100-115 Tolerant Moderately Tolerant
Moderately Tolerant
Seed colour: tan red Rosette disease Tolerant
8 Sokan-donworor
Fastigiata Landrace, Ghana
100-115 Tolerant Moderately Susceptible
Moderately Susceptible
Seed colour: Red to whitish
9 Sumnut – 22 Hypogaea CSIR-SARI, Ghana
100-115 (110-120)
Tolerant Moderately Tolerant
Moderately Tolerant
Appendix 1 continue:
№. Genotype
*Sub-Species
Source Days to Maturity,
days
Phenotypic Characteristics and Other Trait Drought
Characteristics
Early Leaf Spot disease
Late Leaf Spot disease
Oil Content and Other Traits
10 Chinese Hypogaea (Spanish)
Landrace, Ghana
85-90 (100)
Tolerant Susceptible Susceptible Oil Content: 35% Early maturing Use: Soup and Confectionery
11 Yenyawoso Fastigiata (Spanish)
CSIR-CRI, Ghana
85-90 (90)
Moderately Susceptible
Moderately Susceptible
Moderately Susceptible
Oil content: 50% Resistant to Rust Seed colour: Dark red Yield Potential: 2700kg/ha
Days to 50% flowering: 23DAP
12 Simpelgu Fastigiata Landrace, Ghana
85-90 Tolerant Moderately Susceptible
Moderately Susceptible
Seed colour: Deep red
13 Oboshie Fastigiata (Spanish)
CSIR-CRI, Ghana
100-115 (105-110)
Moderately Susceptible
Moderately Susceptible
Moderately Susceptible
Oil Content: 46.49% Seed Colour: Brown Days to 50% flowering: 26
Shelling %: 67 Good flavour, sweet taste (Confectionery) Yield: 2.6tons/ha Days to Flowering: 26DAP
Shelling%: 67% Growth Habit: Semi-erect
14 Kpach – Isah
Fastigiata Landrace, Ghana
85-90 Tolerant Moderately Susceptible
Moderately Susceptible
Seed colour: Light red
15 Kpanieli Hypogaea (Spanish)
CSIR-SARI, Ghana
100-115 (120)
Tolerant Tolerant Tolerant Oil Content: 51% Yield Potential: 2.5t/ha Seed colour: red testa
16 Obolo Fastigiata (Spanish)
CRI, Ghana SARI
100-115 (105-110)
Moderately Susceptible
Moderately Susceptible
Moderately Susceptible
Seed colour: Brown Days to 50% flowering: 25
Shelling %: 70 Has sweet taste and flavour (Confectionery) *Sub-species, *Oil content and other traits; were obtained from CSIR-SARI, CRI and MoFA published data