Grain Size Analysis of Beach Sediments from Bonny Beach in
the Niger Delta
*
1Akpofure, Edirin,
2Akana, S. Tombra
1,2Department of Geology, Niger Delta University, Wilberforce Island, Bayelsa State, Nigeria
Grain size analysis was carried out on sixty-four samples representing the upper 5 - 10 cm of surficial sediments from the sand dunes, backshore and beach face of the Bonny beach for the grain size distribution and statistical parameters. The result shows that 72.7% of the samples from the beach face are unimodal, 18.2% bimodal and 9.1% trimodal, whereas, those of the sandunes and backshore are 54.5% unimodal, 36.4% bimodal and 9.1% trimodal. The modal class is the 0.25 to 0.125 mm size grade (fine sand). Transport by saltation is inferred for the sands. The mean size for the sand dunes, backshore and beach face are 2.0 ø (fine sand), 1.92 ø (medium sand), and 1.82 ø (medium sand) respectively. The grains are slightly coarser at the beach face, and finer towards the sand dunes. The median of the population is 1.92 ø. Sediments are well sorted with values of 0.43, 0.40 and 0.47 for the sand dunes, backshore and beach face respectively. Therefore, high waves and current energy is inferred for the beach. Skewness values are -0.034, -0.05 and -0.07 for the sand dunes, backshore and beach face respectively. It suggests that the sediments are generally symmetrically skewed, indicative of an environment where the effect of erosion and deposition are almost balanced. The beach face is however, slightly different with more erosion. Kurtosis values are 1.17, 1.12 and 1.24 for the sand dunes, backshore and beach face respectively. The bivariate plots confirm that the sediments are moderately well sorted to well sorted, the mean size is the medium sand class, the sediments are mesokurtic to very leptokurtic and are symmetrically to negatively skewed, confirming the dominance of medium sand population and subordinate coarse and fine sands. Sedimentary structures observed occur in low to high energy environments.
Keywords: Grain Size Analysis, Beach, kurtosis, skewness, Ripples, Beach Cusps, Cumulative Curve.
INTRODUCTION
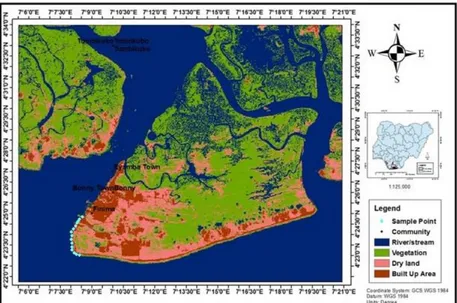
The Bonny Island lies in the Niger Delta approximately 40 km South of Port Harcourt, Nigeria. It lies between 4° 52ʺ N to 5° 02ʺ N and longitudes 6° 56ʺ E to 7° 04ʺ E within the beach ridges onshore geomorphic sub-environment of the Niger Delta (Figure 1). The topography of the Island is relatively flat with an elevation of 3.05 atmospheric mean sea level (NLNG, 2005). It has a tropical climate with two distinct seasons, wet (April-October) and dry (November-March). The intricate network of rivers and their discharge patterns result in the formation of several morphological units. Akpokodje et al., (2014) recognized five major geomorphologic units within the Niger Delta. They are: Active and abandoned coastal beaches; Salt water mangrove swamps: Freshwater swamps and meander belt; Sombreiro Warri plain, dry deltaic plain with abundant swamp zones and Dry flat land and plain. Bonny Island lies within the active/abandoned coastal beaches (Fakeye &
Akinluyi, 2014) Its sediment fill ranges from Pleistocene to Recent sediments deposited by fluvial and shallow continental shelf hydrodynamic processes. The Recent sediments are delta top deposits made up of medium to coarse-grained sands, sandy clays, silts and clays. The area is characterized by strong wave and tidal action, which further compacts the sediments. Plant growth on beach ridges over the years have resulted in the formation of extensive primary tropical freshwater forest. Energy conditions decrease from shore face to outer edge. (Amadi, A. N et al, 2012).
*Corresponding Author: Edirin Akpofure; Department of Geology, Niger Delta University, Wilberforce Island, Bayelsa State, Nigeria. Email: [email protected]; Co-Author Email: [email protected]
Case Study
Vol. 5(2), pp. 245-257, May, 2019. © www.premierpublishers.org. ISSN: 3019-8261
International Journal of Geology and Mining
The Bonny Beach sits at the edge of the Atlantic Ocean facing the Bight of Bonny. It is a long narrow accumulation of sand parallel to the shore line. A typical beach is divided into several units which are: sand dune, backshore, foreshore and shoreface. The backshore represents the upper part of the beach which is normally dry except when there is unusual highwater conditions when it can be flooded or acted upon by waves and rip currents ((Reineck
and Singh 1980). Surficial samples were collected from the sandunes, backshore and part of the foreshore in a line transect. The distance between one transect and another is 250 m. Grain size analysis was carried out to determine the particle size distribution and statistical parameters of sediments in order to describe grain size characteristics, transport mode, energy of deposition and depositional processes and environment at the beach.
Figure 1: Showing location of Bonny Beach and sampled points
REGIONAL STRATIGRAPHY
The Bonny beach lies within the Niger Delta. The Niger Delta complex comprises the sediment load of Mid Eocene to Recent age. It is bordered by the Atlantic Ocean in the South and to the North by an acuate line which runs roughly through Benin, Onitsha, Umuahia, and slightly SSW of Calabar. It extends from about longitudes 3o to 9o
E and Latitudes 4o 30ʺ to 5o 20ʺ N (Whiteman, 1982).
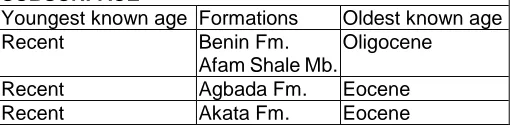
The surface units mapped is part of the Niger Delta complex and their correlative subsurface formations equivalent are given in Table 1.
Three main formations have been recognized in the subsurface of the Niger Delta complex. The Formations are Akata Formation, the Agbada Formation and the Benin Formation.
The Akata Formation
The type well is known as Akata 1, drilled about 50 miles east of Port Harcourt. The Formation has a thickness
greater than 3129 ft. (Whitman, 1982). The lithology is made up of dark grey marine shale that become siltier and sandy near the top with a lot of plant remains. The Akata Formation of prodelta megafacies is of marine origin (Whiteman,1982)
Agbada Formation
The Agbada is made up of sands which are very coarse to fine grain. They are slightly consolidated and have a calcareous matrix, though, majority are unconsolidated. They are poorly sorted except where they grade into shale. The shales are denser at the base than higher in the column because of compaction. Shell fragments, lignite streak, limonite and glauconite occur. Shales become silty and sandy upwards into the Benin Formation and shaliness increases downwards and laterally into the Akata Formation. The thickness ranges from 1400 - 9600 ft. (Whiteman, 1982).
The Benin Formation
and permeable. The sands are interbedded in places with clays, peat, and lignite. The Formation represents the delta plain megafacies and it is of continental origin. The quaternary deposits in the Bonny beach overlie the Benin Formation.
Table 1: Table of Formations in the Niger Delta area
SUBSURFACE
Youngest known age Formations Oldest known age Recent Benin Fm.
Afam Shale Mb.
Oligocene
Recent Agbada Fm. Eocene Recent Akata Fm. Eocene
METHODOLOGY
A total of 64 surficial samples representing the upper 5 cm – 10 cm were collected by hand from the Bonny Beach. Collection was articulated to cover the various parts of the beach – the sand dunes, backshore and the beach face to make a transect. The distance between one transect and
the next was 250 m apart. The samples were sent for granulometric analysis which involved drying and sieving of the sediments. Samples were oven dried to remove moisture content before pouring the loose samples through a stack of BSS standard test sieves with different apertures of known sizes and a minimum time of fifteen minutes used to shake the samples contained in the sieves. This was done to separate the grains into their various sizes. The results got after sieving were used to calculate grain size parameters, plot frequency and cumulative curves. The calculated parameters include median, mean, mode, sorting (standard deviation), skewness and kurtosis of the grain population according to Folk and Ward, 1957.
PRESENTATION OF RESULTS
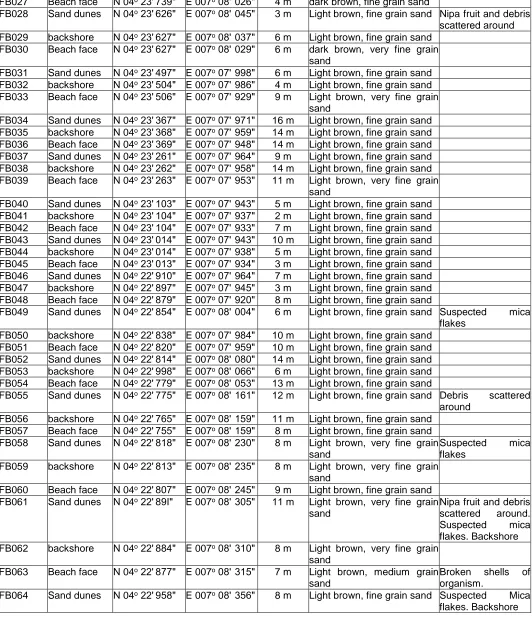
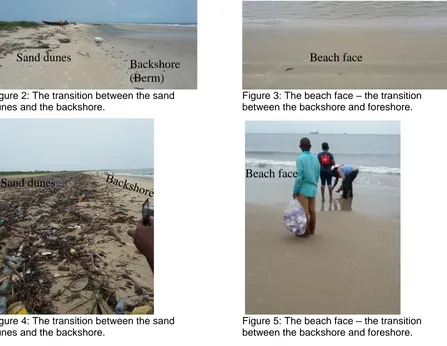
Sixty – four (64) sediment samples were collected from the sand dunes, backshore and foreshore (Figures 2 -5). Below is the table showing the sample numbers, their geo-references, elevations which vary between 1 m to 16 m depending on the part of the beach the samples were collected from and brief textural description.
Table 2: Sample Location Points
SAMPLE NO.
Beach zone NORTHINGS EASTERLIES ELEVATION (m)
TEXTURE REMARKS
FB001 Sand dunes N 04o 24ʹ67Iʺ E 007o 08ʹ 132ʺ 4 m Light brown, fine grain sand
FB002 backshore N 04o 24ʹ673ʺ E 007o 08ʹ 126ʺ 4 m Light brown, fine grain sand
FB003 Beach face N 04o 24ʹ679ʺ E 007o 08ʹ 119ʺ 5 m Dark brown, very fine grain
sand
FB004 Sand dunes N 04o 24ʹ555ʺ E 007o 08ʹ 075ʺ 8 m Light brown, fine grain sand
FB005 backshore N 04o 24ʹ556ʺ E 007o 08ʹ 069ʺ 6 m Light brown, fine grain sand
FB006 Beach face N 04o 24ʹ557ʺ E 007o 08ʹ 064ʺ 6 m Light brown, fine grain sand
FB007 Sand dunes N 04o 24ʹ42Iʺ E 007o 08ʹ 076ʺ 6 m dark brown, fine grain sand
FB008 backshore N 04o 24ʹ42Iʺ E 007o 08ʹ 073ʺ 3 m dark brown, fine grain sand
FB009 Beach face N 04o 24ʹ420ʺ E 007o 08ʹ 071ʺ 1 m dark brown, fine grain sand
FB010 Sand dunes N 04o 24ʹ31Iʺ E 007o 08ʹ 087ʺ 3 m dark brown, fine grain sand
FB011 backshore N 04o 24ʹ309ʺ E 007o 08ʹ 084ʺ 3 m dark brown, fine grain sand
FB012 Beach face N 04o 24ʹ309ʺ E 007o 08ʹ 079ʺ 2 m dark brown, fine grain sand
FB013 Sand dunes N 04o 24ʹ214ʺ E 007o 08ʹ 074ʺ 6 m dark brown, fine grain sand
FB014 backshore N 04o 24ʹ216ʺ E 007o 08ʹ 069ʺ 5 m dark brown, fine grain sand Presence of fish
scale FB015 Beach face N 04o 24ʹ216ʺ E 007o 08ʹ 065ʺ 2 m dark brown, fine grain sand
FB016 Sand dunes N 04o 24ʹ107ʺ E 007o 08ʹ 073ʺ 2 m Light brown, fine grain sand
FB017 backshore N 04o 24ʹ107ʺ E 007o 08ʹ 064ʺ 4 m Light brown, fine grain sand A lot of Nipa fruits
scattered around FB018 Beach face N 04o 24ʹ106ʺ E 007o 08ʹ 063ʺ 4 m fine grain, dark muddy sand
FB019 Sand dunes N 04o 23ʹ 968ʺ E 007o 08ʹ 027ʺ 6 m Light brown, fine grain sand
FB020 backshore N 04o 23ʹ 969ʺ E 007o 08ʹ 023ʺ 4 m Light brown, fine grain sand
FB021 Beach face N 04o 23ʹ967ʺ E 007o 08ʹ 016ʺ 3 m dark brown, fine grain sand
FB022 Sand dunes N 04o 23ʹ854ʺ E 007o 08ʹ 032ʺ 7 m Light brown, fine grain sand Nipa fruit and debris
scattered around FB023 backshore N 04o 23ʹ 855ʺ E 007o 08ʹ 027ʺ 4 m Light brown, fine grain sand
FB024 Beach face N 04o 23ʹ 853ʺ E 007o 08ʹ 019ʺ 2 m Light brown, fine grain sand
FB025 Sand dunes N 04o 23ʹ 740ʺ E 007o 08ʹ 038ʺ 5 m Light brown, fine grain sand Nipa fruit and debris
Table 2 Continue
FB027 Beach face N 04o 23ʹ739ʺ E 007o 08ʹ 026ʺ 4 m dark brown, fine grain sand
FB028 Sand dunes N 04o 23ʹ626ʺ E 007o 08ʹ 045ʺ 3 m Light brown, fine grain sand Nipa fruit and debris
scattered around FB029 backshore N 04o 23ʹ627ʺ E 007o 08ʹ 037ʺ 6 m Light brown, fine grain sand
FB030 Beach face N 04o 23ʹ627ʺ E 007o 08ʹ 029ʺ 6 m dark brown, very fine grain
sand
FB031 Sand dunes N 04o 23ʹ497ʺ E 007o 07ʹ 998ʺ 6 m Light brown, fine grain sand
FB032 backshore N 04o 23ʹ504ʺ E 007o 07ʹ 986ʺ 4 m Light brown, fine grain sand
FB033 Beach face N 04o 23ʹ506ʺ E 007o 07ʹ 929ʺ 9 m Light brown, very fine grain
sand
FB034 Sand dunes N 04o 23ʹ367ʺ E 007o 07ʹ 971ʺ 16 m Light brown, fine grain sand
FB035 backshore N 04o 23ʹ368ʺ E 007o 07ʹ 959ʺ 14 m Light brown, fine grain sand
FB036 Beach face N 04o 23ʹ369ʺ E 007o 07ʹ 948ʺ 14 m Light brown, fine grain sand
FB037 Sand dunes N 04o 23ʹ261ʺ E 007o 07ʹ 964ʺ 9 m Light brown, fine grain sand
FB038 backshore N 04o 23ʹ262ʺ E 007o 07ʹ 958ʺ 14 m Light brown, fine grain sand
FB039 Beach face N 04o 23ʹ263ʺ E 007o 07ʹ 953ʺ 11 m Light brown, very fine grain
sand
FB040 Sand dunes N 04o 23ʹ103ʺ E 007o 07ʹ 943ʺ 5 m Light brown, fine grain sand
FB041 backshore N 04o 23ʹ104ʺ E 007o 07ʹ 937ʺ 2 m Light brown, fine grain sand
FB042 Beach face N 04o 23ʹ104ʺ E 007o 07ʹ 933ʺ 7 m Light brown, fine grain sand
FB043 Sand dunes N 04o 23ʹ014ʺ E 007o 07ʹ 943ʺ 10 m Light brown, fine grain sand
FB044 backshore N 04o 23ʹ014ʺ E 007o 07ʹ 938ʺ 5 m Light brown, fine grain sand
FB045 Beach face N 04o 23ʹ013ʺ E 007o 07ʹ 934ʺ 3 m Light brown, fine grain sand
FB046 Sand dunes N 04o 22ʹ910ʺ E 007o 07ʹ 964ʺ 7 m Light brown, fine grain sand
FB047 backshore N 04o 22ʹ897ʺ E 007o 07ʹ 945ʺ 3 m Light brown, fine grain sand
FB048 Beach face N 04o 22ʹ879ʺ E 007o 07ʹ 920ʺ 8 m Light brown, fine grain sand
FB049 Sand dunes N 04o 22ʹ854ʺ E 007o 08ʹ 004ʺ 6 m Light brown, fine grain sand Suspected mica
flakes FB050 backshore N 04o 22ʹ838ʺ E 007o 07ʹ 984ʺ 10 m Light brown, fine grain sand
FB051 Beach face N 04o 22ʹ820ʺ E 007o 07ʹ 959ʺ 10 m Light brown, fine grain sand
FB052 Sand dunes N 04o 22ʹ814ʺ E 007o 08ʹ 080ʺ 14 m Light brown, fine grain sand
FB053 backshore N 04o 22ʹ998ʺ E 007o 08ʹ 066ʺ 6 m Light brown, fine grain sand
FB054 Beach face N 04o 22ʹ779ʺ E 007o 08ʹ 053ʺ 13 m Light brown, fine grain sand
FB055 Sand dunes N 04o 22ʹ775ʺ E 007o 08ʹ 161ʺ 12 m Light brown, fine grain sand Debris scattered
around FB056 backshore N 04o 22ʹ765ʺ E 007o 08ʹ 159ʺ 11 m Light brown, fine grain sand
FB057 Beach face N 04o 22ʹ755ʺ E 007o 08ʹ 159ʺ 8 m Light brown, fine grain sand
FB058 Sand dunes N 04o 22ʹ818ʺ E 007o 08ʹ 230ʺ 8 m Light brown, very fine grain
sand
Suspected mica flakes
FB059 backshore N 04o 22ʹ813ʺ E 007o 08ʹ 235ʺ 8 m Light brown, very fine grain
sand
FB060 Beach face N 04o 22ʹ807ʺ E 007o 08ʹ 245ʺ 9 m Light brown, fine grain sand
FB061 Sand dunes N 04o 22ʹ89Iʺ E 007o 08ʹ 305ʺ 11 m Light brown, very fine grain
sand
Nipa fruit and debris scattered around. Suspected mica flakes. Backshore FB062 backshore N 04o 22ʹ884ʺ E 007o 08ʹ 310ʺ 8 m Light brown, very fine grain
sand
FB063 Beach face N 04o 22ʹ877ʺ E 007o 08ʹ 315ʺ 7 m Light brown, medium grain
sand
Broken shells of organism.
FB064 Sand dunes N 04o 22ʹ958ʺ E 007o 08ʹ 356ʺ 8 m Light brown, fine grain sand Suspected Mica
Figure 2: The transition between the sand Figure 3: The beach face – the transition dunes and the backshore. between the backshore and foreshore.
Figure 4: The transition between the sand Figure 5: The beach face – the transition dunes and the backshore. between the backshore and foreshore.
GRAIN SIZE DISTRIBUTION AND STATISTICAL PARAMETERS
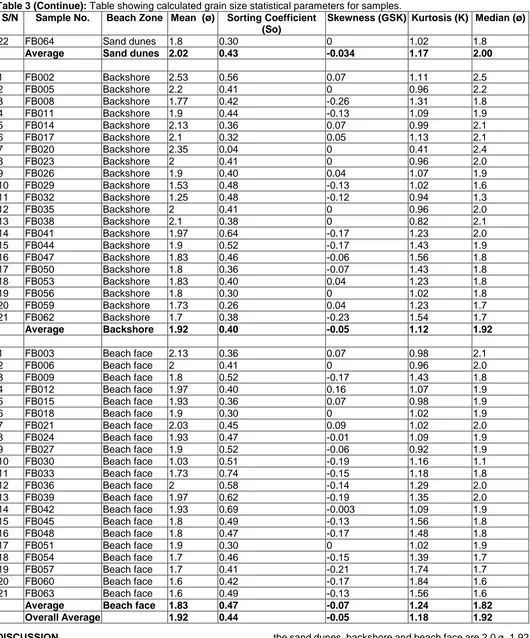
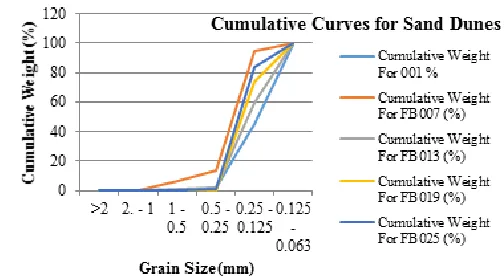
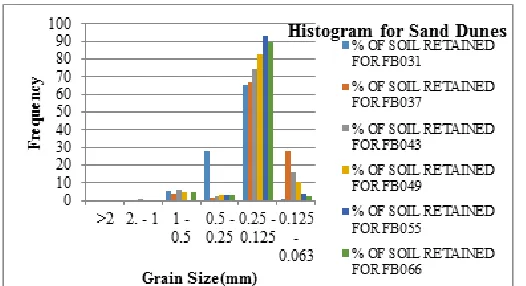
The different results from the granulometric analysis were plotted into graphs and grain size statistical parameters were calculated for all samples and are presented in Table 3. The associated histograms and cumulative curves for the grain size analysis are presented in Figures 6 – 17.
Table 3: Table showing calculated grain size statistical parameters for samples.
S/N Sample No. Beach Zone Mean (ø) Sorting Coefficient (So) Skewness (GSK) Kurtosis (K) Median (ø)
1 FB001 Sand dunes 2.4 0.51 0.03 0.99 2.4
2 FB004 Sand dunes 2.27 0.45 -0.09 1.02 2.3
3 FB007 Sand dunes 1.8 0.41 -0.15 1.74 1.8
4 FB010 Sand dunes 2.03 0.36 0.07 0.98 2.0
5 FB013 Sand dunes 2.2 0.41 0 0.96 2.2
6 FB016 Sand dunes 2.03 0.34 0.12 0.90 2.0
7 FB019 Sand dunes 2.1 0.32 -0.05 1.13 2.1
8 FB022 Sand dunes 2.87 0.64 -0.06 0.96 2.9
9 FB025 Sand dunes 2.67 0.64 -0.06 0.96 2.7
10 FB028 Sand dunes 1.8 0.41 -0.07 1.15 1.8
11 FB031 Sand dunes 1.37 0.47 -0.12 1.31 1.4
12 FB034 Sand dunes 2.43 0.56 0.07 0.97 2.4
13 FB037 Sand dunes 2.03 0.47 0.06 1.09 2.0
14 FB040 Sand dunes 2 0.41 0 0.96 2.0
15 FB043 Sand dunes 1.8 0.50 -0.15 1.64 1.8
16 FB046 Sand dunes 1.8 0.49 -0.13 1.30 1.8
17 FB049 Sand dunes 1.8 0.40 0.25 1.23 1.7
18 FB052 Sand dunes 1.83 0.37 0.03 1.07 1.8
19 FB055 Sand dunes 1.8 0.31 -0.05 1.13 1.8
20 FB058 Sand dunes 1.7 0.39 -0.19 1.64 1.7
21 FB061 Sand dunes 1.8 0.39 -0.25 1.64 1.8
Backshore
(Berm)
Sand dunes
Beach face
Table 3 (Continue): Table showing calculated grain size statistical parameters for samples.
S/N Sample No. Beach Zone Mean (ø) Sorting Coefficient (So)
Skewness (GSK) Kurtosis (K) Median (ø)
22 FB064 Sand dunes 1.8 0.30 0 1.02 1.8
Average Sand dunes 2.02 0.43 -0.034 1.17 2.00
1 FB002 Backshore 2.53 0.56 0.07 1.11 2.5
2 FB005 Backshore 2.2 0.41 0 0.96 2.2
3 FB008 Backshore 1.77 0.42 -0.26 1.31 1.8
4 FB011 Backshore 1.9 0.44 -0.13 1.09 1.9
5 FB014 Backshore 2.13 0.36 0.07 0.99 2.1
6 FB017 Backshore 2.1 0.32 0.05 1.13 2.1
7 FB020 Backshore 2.35 0.04 0 0.41 2.4
8 FB023 Backshore 2 0.41 0 0.96 2.0
9 FB026 Backshore 1.9 0.40 0.04 1.07 1.9
10 FB029 Backshore 1.53 0.48 -0.13 1.02 1.6
11 FB032 Backshore 1.25 0.48 -0.12 0.94 1.3
12 FB035 Backshore 2 0.41 0 0.96 2.0
13 FB038 Backshore 2.1 0.38 0 0.82 2.1
14 FB041 Backshore 1.97 0.64 -0.17 1.23 2.0
15 FB044 Backshore 1.9 0.52 -0.17 1.43 1.9
16 FB047 Backshore 1.83 0.46 -0.06 1.56 1.8
17 FB050 Backshore 1.8 0.36 -0.07 1.43 1.8
18 FB053 Backshore 1.83 0.40 0.04 1.23 1.8
19 FB056 Backshore 1.8 0.30 0 1.02 1.8
20 FB059 Backshore 1.73 0.26 0.04 1.23 1.7
21 FB062 Backshore 1.7 0.38 -0.23 1.54 1.7
Average Backshore 1.92 0.40 -0.05 1.12 1.92
1 FB003 Beach face 2.13 0.36 0.07 0.98 2.1
2 FB006 Beach face 2 0.41 0 0.96 2.0
3 FB009 Beach face 1.8 0.52 -0.17 1.43 1.8
4 FB012 Beach face 1.97 0.40 0.16 1.07 1.9
5 FB015 Beach face 1.93 0.36 0.07 0.98 1.9
6 FB018 Beach face 1.9 0.30 0 1.02 1.9
7 FB021 Beach face 2.03 0.45 0.09 1.02 2.0
8 FB024 Beach face 1.93 0.47 -0.01 1.09 1.9
9 FB027 Beach face 1.9 0.52 -0.06 0.92 1.9
10 FB030 Beach face 1.03 0.51 -0.19 1.16 1.1
11 FB033 Beach face 1.73 0.74 -0.15 1.18 1.8
12 FB036 Beach face 2 0.58 -0.14 1.29 2.0
13 FB039 Beach face 1.97 0.62 -0.19 1.35 2.0
14 FB042 Beach face 1.93 0.69 -0.003 1.09 1.9
15 FB045 Beach face 1.8 0.49 -0.13 1.56 1.8
16 FB048 Beach face 1.8 0.47 -0.17 1.48 1.8
17 FB051 Beach face 1.9 0.30 0 1.02 1.9
18 FB054 Beach face 1.7 0.46 -0.15 1.39 1.7
19 FB057 Beach face 1.7 0.41 -0.21 1.74 1.7
20 FB060 Beach face 1.6 0.42 -0.17 1.84 1.6
21 FB063 Beach face 1.6 0.49 -0.13 1.56 1.6
Average Beach face 1.83 0.47 -0.07 1.24 1.82
Overall Average 1.92 0.44 -0.05 1.18 1.92
DISCUSSION
The mean is the best measure of average grain size, which is best computed from size of particle spread through a range of percentile values. The mean grain size values for
Sorting is a measure of spread in the size distribution. It is defined statistically as the extent to which grain spread on either side of the average diameter. The variations in sorting characteristics are mainly attributed to the severity of wave action, water turbulence and current velocity (Bramha, et al., 2017). The average sorting values for the sediments are 0.43, 0.40 and 0.47 for the sand dunes, backshore and beach face respectively. The values suggest the sediments are well sorted which could be attributed to high wave energy activities on the beach (Bramha, et al., 2017).
Skewness measures the symmetry of the grain size distribution on a cumulative curve. It is a positively or negatively sign dimensionless number. Positive skewness characterizes a beach with deposition of sand whereas; negative skewness indicates erosion or non-deposition (Duane, 1964). The average values of the skewness are -0.034, -0.05 and -0.07 for the sand dunes, backshore and beach face respectively. The average beach skewness is -0.05, which suggests the sediments are generally symmetrically skewed, indicative of an environment where the effect of erosion and deposition are almost balanced. This study shows that 63.6% of the samples from the sand dunes are symmetrically skewed, 36.3% are negatively skewed, and it has an average skewness of -0.034. The sediments from the backshore also exhibit a symmetrical skewness with value of -0.05 on the average, but 66.7% are symmetrical and 33.3% are negatively skewed. The beach face is slightly different with an average symmetrical skewness of -0.07. 4.7% are positively skewed, 42.9% are symmetrical and 52.4% are negatively skewed. From the above, according to Duane, (1964), erosion or non - deposition occur minimally on the back shore and sand dunes, but more on the beach face.
Kurtosis is a measure of the peakedness of the grain distribution. It is the ratio of the spread of the falls and center of the distribution. According to Friedman, (1962), extreme high or low values of kurtosis indicate that some of the sediments achieved sorting elsewhere in a high energy environment. Therefore, platykurtic to very platykurtic and leptokurtic to very leptokurtic sediments are due to extremely low and high energy environments respectively (Dora et al. 2011). The average kurtosis value for the sand dunes is 1.17 (leptokurtic), but 54.5% are mesokurtic, 27.3% are leptokurtic and 18.1% are very leptokurtic. 47.6% of the sediments from the backshore are mesokurtic, 33.3% are leptokurtic and 9.5% are very leptokurtic but the average value is 1.12 (leptokurtic). The average kurtosis value of the beach face sediments is 1.24 indicating that they are leptokurtic, but, 47.6% of them are mesokurtic, 33.3% are leptokurtic and 19.04% are very leptokurtic.
The median is the average size of the sample grain which corresponds to the second quartile associated with the 50% percentile Md = φ50. The median grain size for the sand dunes is 2.0 ø (fine sand) and that of the backshore
and beach face are 1.92 ø and 1.82 ø respectively (medium sand)
Generally, the mean of the entire population ranges from 1.0 to 2.8 ø, with an average of 1.92 ø, indicating the sediments are medium sands. The median is 1.92 ø. The Sorting Co-efficient (So) or Standard Deviation (GSD) range from 0.26 to 0.74, with an average of 0.44, which means the sediments are well sorted. The measure of the symmetry of the grain size distribution: skewness (GSK), range from -0.007 to 0.117, with an average of -0.05. The sediments are therefore symmetrical. The kurtosis (K) range from 0.41 to 1.84, with an average of 1.18, indicating the sediment population is leptokurtic. Most of the samples are unimodal, some are bimodal and a few are trimodal. The samples in the sand dunes and backshore are 54.5% unimodal, 36.4% bimodal and 9.1% trimodal. While those of the beach face are 72.7% unimodal, 18.2% bimodal and 9.1% trimodal. The modal class which is the commonest grain size in the distribution falls within the 0.25 to 0.125 mm size grade - which is fine sand. There are two other size grades that are significant in the population; they are the medium sand – 0.5 – 0.25 mm and the very fine sand -0.125 – 0.063 mm. The separation between the modal class and these other subordinate classes are close that one mode of transport can be inferred for them. The transport mode inferred for the sediment is by saltation. The coarser sand fragments which are greater than 0.5 mm are not common; they are transported by traction mode.
Coastal sediments are usually made up of sand and sometimes of gravelly sediments. The coastal sediments are gravelly only when source rocks are nearby, rivers may also bring gravels to the coast and transgressive sea also produce coast with gravels (Reineck and Singh, 1980). The sediments of Bonny beach are mainly medium sands to fine sands on a prograding environment (Whiteman, 1982). This infers sediment provenance that is not near but the sediments are reworked by waves and currents.
On the beach surface, most of the sedimentary structures that occur are not preserved but replaced and reworked by subsequent current flow. Some of the sedimentary structures observed on the sands include different types of ripples produced by either waves or current, or the combined effect of both. The structures are: Longitudinal ripples, undulatory small ripples, lingoid small ripples, rhomboid small ripples and beach cusps in the backshore produced by the swash and backwash movement of current and current variation from low to high under low water depth (Figures 18 -26). The rhomboid small ripples are formed under very thin layer of water by backwash. They develop under high velocity and extremely shallow waters (Reineck and Singh 1980). According to Dalrymple and Lanan, 1976, beach cusps develop on the backshore of beaches. They develop abundantly on shores of medium wave energy without strong current, when waves approach the shore line at almost right angles. They develop abundantly during retreating storms (Dalrymple and Lanan 1976; Cloud, 1966). Bubble sand structures were also observed. These are formed on the coast when the surf is not too strong and sediment surface is flooded with water rather too quickly and the entrapment of air bubbles in the beach sands occur (Reineck and Singh 1980).
The presence of the sedimentary structures observed and the predominance of medium sand to fine sand infers fluctuation of low to high wave and current energy for the Bonny beach.
BIVARIATE SCATER AND LINE PLOTS OF SAMPLED SEDIMENTS
Sedimentologists use bivariate plots to discriminate sedimentary environment and processes. Some of such plots are used in this study. Griffiths (1967) illustrated that mean size and sorting are hydraulically controlled in most environment and best sorted sediments have their mean size in the fine sand category. The bivariate plot of mean size and sorting in the sampled sediments (Figure 27) shows that the sediments are moderately well sorted to well sorted and the mean size is the medium sand class. Generally, most beach sediments are slightly negatively skewed due to the presence of small proportion of coarse grains (Griffith, 1967). Friedman (1962) showed that most beach sands are leptokurtic and either positively or negatively skewed and very leptokurtic deposits have high sorting which is a reflection of the ability of the current to winnow sediment. High energy current is able to differentiate grains into their sizes, whereas, low energy is unable leading to poor sorting.
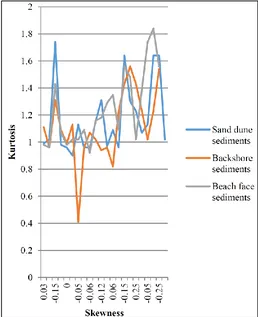
Plot of skewness and sorting (Figure 28), shows that the sorting of sediments range from moderately well sorted to well sorted and are symmetrically to negatively skewed. The bivariate plot of kurtosis and. skewness (Figures 29 and 30) is a powerful tool for interpreting the genesis of sediments, by quantifying the degree of normality of its
size distribution (Griffith 1967). The scatter plot of kurtosis and skewness (Figure 29) show the sediments are mesokurtic to very leptokurtic and are symmetrically and negatively skewed. This suggests the dominance of medium sand population and subordinate coarse and fine sands which give symmetric skewness in some part and the lack of coarse sand and more fine sand in other parts giving rise to the negative skewness.
The line plot of kurtosis and skewness (Figure 30) shows peaks of high and low energy regimes (Friedman, 1962). Current energy is higher in the beach face than the other geomorphic zones of the beach.
The cumulative curves and frequency histograms of the distribution are presented below for some of the samples.
Figure 6: Cumulative curves for sand dune sediments
Figure 7: Cumulative curves for sand dune sediments
Figure 9: Histogram for sand dune sediments
Figure 10: Cumulative curves for backshore sediments
Figure 11: Cumulative curves for backshore sediments
Figure 12: Histogram for backshore sediments
Figure 13: Histogram for backshore sediments
Figure 14: Cumulative curves for beach face sediments
Figure 15: Cumulative curves for beach face sediments
Figure 17: Histogram for beach face sediments
Figure 18: Straight crested small ripples
Figure 19: Longitudinal ripples. Crests are straight and originate under the combined action of waves and currents
Figure 20: Undulatory small ripples
Figure 21: Beach cusps
Figure 22: Well-developed rhomboid ripples.
Flow is from left to right
Figure 23: Migration of straight crested ripples to lingoid ripples
Figure 25: Deposits of bioclastic material
Figure 26: Deposits of broken bioclastic material
Figure 27: Bivariate plot showing the relationship between mean and sorting of beach sediments collected from the sand dunes, backshore and beach face of Bonny beach
Figure 28: Bivariate plot showing the relationship between sorting and skewness of beach sediments collected from the sand dunes, backshore and beach face of Bonny beach
Figure 29: Scatter bivariate plot showing the relationship between skewness and kurtosis of beach sediments collected from the sand dunes, backshore and beach face of Bonny beach.
Figure 30: Line plot of kurtosis against skewness showing high and low energy points in the sand dunes, backshore and beach face sediments of Bonny beach.
CONCLUSION
topography. Grain size statistical parameters deduced from the grain size analysis of sediments collected from the sand dunes, backshore and beach face indicate that the mean size for the sand dunes, backshore and beach face are 2.0 ø (fine sand), 1.92 ø (medium sand), and 1.82 ø (medium sand) respectively. The grains are slightly coarser at the beach face, and gradually become finer towards the sand dunes. The median of the population is 1.92 ø.
The average sorting values for the sediments are 0.43, 0.40 and 0.47 for the sand dunes, backshore and beach face respectively. The values suggest the sediments are well sorted which could be attributed to highwave energy activities on the beach.
The average values of skewness which range from -0.034 for the sand dunes to -0.07 for the beach face, suggests the sediments are generally symmetrically skewed, indicative of an environment where the effect of erosion and deposition are almost balanced, but erosion occur more on the beach face which is slightly different, with an average symmetrical skewness of -0.07. 4.7% are positively skewed, 42.9% are symmetrical and 52.4% are negatively skewed.
The average kurtosis value for the sand dunes is 1.17 (leptokurtic), but 54.5% are mesokurtic, 27.3% are leptokurtic and 18.1% are very leptokurtic. 47.6% of the sediments from the backshore are mesokurtic, 33.3% are leptokurtic and 9.5% are very leptokurtic but the average value is 1.12 (leptokurtic). The average kurtosis value of the beach face sediments is 1.24 indicating that they are leptokurtic, but, 47.6% of them are mesokurtic, 33.3% are leptokurtic and 19.04% are very leptokurtic, suggesting the current energy on the sand dunes and backshore is more uniform, whereas, that on the beach face is higher.
Most of the histograms are unimodal, while a few are bimodal. The modal class which is the commonest grain size in the distribution falls within the 0.25 to 0.125 mm size grade (fine sand). There are two other size grades that are significant in the population; they are the medium sand (0.5 – 0.25) mm and the very fine sand (0.125 – 0.063 mm). The grains are texturally mature and the transport mode inferred for the sediments is saltation. The coarser sand fragments which are greater than 0.5 mm are not common; they are transported by traction mode.
The sediments of the Bonny beach are medium sands to fine sands on a prograding basin. This infers a sediment provenance that is not near but the sediments are reworked by waves and currents.
The bivariate plot of mean size and sorting in the sampled sediments confirm that the sediments are moderately well sorted to well sorted and the mean size is the medium sand class. The scatter plot of kurtosis and skewness shows the sediments are mesokurtic to very leptokurtic
and are symmetrically and negatively skewed, confirming the dominance of medium sand population and subordinate coarse and fine sands which give symmetric skewness in some part and the lack of coarse sand and more fine sand in other parts giving rise to the negative skewness.
The line plot of kurtosis and skewness also showscurrent energy is higher in the beach face than the other geomorphic zones of the beach.
The sedimentary structures observed on the backshore, which are: longitudinal ripples, undulatory small ripples, lingoid small ripples, rhomboid small ripples and beach cusps, bubble sand structures and broken bioclastic material occur in low to high energy environment.
ACKNOWLEDGEMENT
This field work was sponsored by National Center for Marine Geosciences, (NGSA), Bayelsa State, Nigeria.
REFERENCES
Akpokodje, E. G., Avwenagha, E. O., Tse, A. (2014) Geotechnical properties of subsurface soils in Warri, Western Niger Delta, Nigeria. Journal of Earth Sciences and Geotechnical Engineering, 4(1): 89-102
Amadi, A. N., Nwankwoala, H. O., Olasehinde, P. I., Okoye, N. O., Okunlola, I. A. and Alkali, Y. B. (2012) Investigation of aquifer quality in Bonny Island, eastern Niger Delta, Nigeria using geophysical and geochemical techniques, Journal of Emerging Trends in Engineering and Applied Sciences (JETEAS) 3 (1): 183-187.
Bramha S.N.; Mohanty, A.K.; Samantara, M.K.; Panigrahi, S.N.; Satpathy, K.K. (2017) Textural characteristics of beach sediments along Kalpakkam, south east coast of India. Indian Journal of Geo Marine Sciences Vol.46 (08), pp. 1562-1574
Cloud, P. E. (1966) Beach cusps: Response to Plateaus Rule? Science Journals, Vol. 154, pp.890 – 891. Dalrymple, R. A., Lannan, G. A. (1976) Beach cusps
formed by intersecting waves. Geological Society of America Bulletin, Vol. 87, pp 57 – 60.
Dora, G. U., Kumar, V. S., Philip, C. S., Johnson, G., Vinayaraj, P., Gowthaman, R., (2011) Textural characteristics of foreshore sediments along Karnataka shoreline, west coast of India. International Journal of Sediment Research, 26 (3), 364-377.
Duane, D. B., (1964) Significance of skewness in recent sediments, Western Pamlico Sound, North Carolina. Journal of Sedimentary Petrology, Vol. 34, No. 4, 864-874.
Folk, R. L., Ward, W. (1957) Brazos river bar: a study of the significance of grain size parameters. Journal of Sedimentary Petrology, 27, 3-26.
Friedman, G. M., (1962) On sorting, sorting co-efficient and log normality of the grain size distribution of sandstones. Journal of Geology, 70: 737–753.
Griffith, J, C., (1951) Size versus sorting in Caribbean sediments. J Geol, 59(3): 211–243
Griffith, J. C., (1967) Scientific methods in analysis of sedimentary. McGraw–Hill, New York.
NLNG. 2005. Environmental Impact Assessment for the Nigeria LNG Six Project Bonny Island. (Vol. 1 and 2). Ecosphere Nigeria and Babsal & Company
Pettijohn, F. J. P., (2004) Sedimentary Rocks, 3rd edition,
Satish Kumar Jain for CBS publishers and Distibutors, New Delhi – 110 002 (India)
Reineck, H. E., Singh, I. B. (1980) Depositional Sedimentary Environments, With Reference To Terrigeneous Clastics. Springer – Verlag, Berlin Heidelberg, New York
Whiteman, A. J. (1982) Nigeria: Its petroleum geology, resources and potential. Vol 1 & 2, Graham and Trotman Ltd, Sterling House, 66 Wilson road, London SWIV IDE
Accepted 1 May 2019
Citation: Akpofure E, Akana TS (2019). Grain Size Analysis of Beach Sediments from Bonny Beach in the Niger Delta. International Journal of Geology and Mining 5(2): 245-257.