186 January, 2019 Int J Agric & Biol Eng Open Access at https://www.ijabe.org Vol. 12 No.1
Automatic detection of ruminant cows’ mouth area during rumination
based on machine vision and video analysis technology
Yanru Mao
1,2,3,
Dongjian He
1,2,3,
Huaibo Song
1,2,3*(1. College of Mechanical and Electronic Engineering, Northwest A&F University, Yangling 712100, Shaanxi, China; 2. Key Laboratory of Agricultural Internet of Things, Ministry of Agricultural, Yangling 712100, Shaanxi, China; 3. Shaanxi Key Laboratory of Agricultural Information Perception and Intelligent Service, Yangling 712100, Shaanxi, China)
Abstract: In order to realize the automatic monitoring of ruminant activities of cows, an automatic detection method for the mouth area of ruminant cows based on machine vision technology was studied. Optical flow was used to calculate the relative motion speed of each pixel in the video frame images. The candidate mouth region with large motion ranges was extracted, and a series of processing methods, such as grayscale processing, threshold segmentation, pixel point expansion and adjacent region merging, were carried out to extract the real area of cows’ mouth. To verify the accuracy of the proposed method, six videos with a total length of 96 min were selected for this research. The results showed that the highest accuracy was 87.80%, the average accuracy was 76.46% and the average running time of the algorithm was 6.39 s. All the results showed that this method can be used to detect the mouth area automatically, which lays the foundation for automatic monitoring of cows’ ruminant behavior.
Keywords: ruminant cows, mouth area, automatic detection, machine vision, video analysis technology, ruminant behavior, optical flow
DOI: 10.25165/j.ijabe.20191201.4268
Citation: Mao Y R, He D J, Song H B. Automatic detection of ruminant cows’ mouth area during rumination based on machine vision and video analysis technology. Int J Agric & Biol Eng, 2019; 12(1): 186–191.
1 Introduction
Ruminant activities of cows are closely related to their production performance, reproductive ability, stress response and disease[1]. Ruminant status reflects the physiological status of cows to a certain extent. It is of great significance to know the law of ruminant cows for dairy farming fields. With the development of automatic identification technology in animal husbandry, ruminant behavior detection has a wide range of practical applications and has received increasing attention[2-7].
Cows’ ruminant behavior is traditionally monitored by experienced farmers. This method has strong subjectivity, high labor cost, and can not realize long-term and accurate monitoring. In order to solve the shortcomings of subjective and manual observations, researchers have studied a series of automatic monitoring devices to detect cows’ ruminant behavior. Watanabe et al.[8] proposed a triaxial accelerometer in the mandibular part of the cow to monitor its mandibular motion characteristics. According to the size of the acceleration to determine whether the cow was in ruminant state and obtain the relevant ruminant information, the test accuracy reached 90.00%. Braun et al.[9] monitored the pressure variation in the head and jaw of the cows by pressure sensors, then judged the ruminant time and the number of
Received date: 2018-03-26 Accepted date: 2018-06-13
Biographies: Yanru Mao, Bachelor, research interest: image processing, Email: [email protected]; Dongjian He, PhD, Professor, research interest: development and evaluation of agricultural perception technologies, Email: [email protected].
*Corresponding author: Huaibo Song, PhD, Associate Professor, research interest: image processing and intelligent monitoring of cow’s behavior. College of Mechanical and Electronic Engineering, Northwest A&F University, 22 Xinong Road, Yangling 712100, Shaanxi, China. Tel: +86-29-87092391, Fax: +86-29-87091737, Email: [email protected].
chewings. The results showed that the ruminant time reduced to the lowest level on the day of delivery and then increased. HR-Tag device developed by Israel SCR company could automatically and accurately record cows’ ruminant information based on the internal microphone system of the collar, and could provide cow ruminant time, chewing rhythm and bolus interval for further analysis. Automatic monitoring devices can monitor the cows’ ruminant behavior in real-time effectively. But such an invasive monitoring method easily leads to stress response of cows and the life of equipment will be affected. At present, machine vision technology has become an important research field because it is objective, uninterrupted, real-time and non-invasive[10-16]. As a result, automatic monitoring of cows’ ruminant behavior based on machine vision technology has attracted the attention of scholars. Xia et al.[17] proposed a facial description model based on the local
binary patterns (LBP) texture features. They identified the cow face image by the principal component analysis method and the sparse representation-based classifier. However, the recognition system was sensitive to the position and angle of the cow’s face image and it was difficult to realize automatic recognition. Cai et al.[18] improved the LBP algorithm based on the face recognition method and the cow’s face model was proposed based on the improved LBP. The sparse and low-rank decomposition were used to calibrate the cow’s face image. The model eliminated the influence of illumination variation, image size deviation and local occlusion. But the model dealt with grayscale images and could not be used in the real dairy farming environment. Chen et al.[19] used the mean shift algorithm to accurately track the jaw motion of dairy cows and extracted the centroid trajectory curve of the cow’s mouth motion from the videos. This method had high accuracy, but the tracking area was selected manually, and the level of automation should be improved.
main basis for determining the cows’ ruminant behavior. Therefore, accurate detection of mouth area is the key to the automatic monitoring of the cows’ ruminant behavior. However, because cow is a living body, a variety of factors such as swinging, head raising and smaller mouth area make it difficult to accurately identify the mouth area of cows. In this study, the optical flow and a series of post-processing methods such as grayscale processing, threshold segmentation, pixel expansion and region merging, were applied to detect cow’s mouth area, which could lay the foundation for automatic monitoring of cows’ ruminant behavior.
2 Materials and methods
2.1 Materials
The test videos were captured from a large-scale dairy farm in
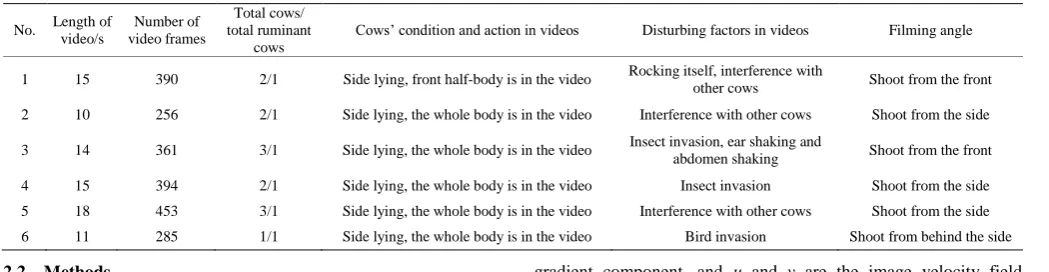
Yangling, Shaanxi Province in July 2013 under sunny conditions from morning, noon and evening. All the videos were collected after the cows were fed and drank water. The test subjects were 30 Holstein cows in mid lactation. Each cow was videotaped for 16 min and a total of 1440 min of videos were collected for this research. The captured video was in MP4 format with a resolution of 704 pixels × 576 pixels. To verify the feasibility of the method, after excluding invalid video not in the ruminant state, the valid videos were divided into 15 s by PotPlayer software. The selected test videos are shown in Table 1. From which we could see that there were distinct differences in the number of cows, states and actions, as well as time period and the angle of videos. There were other cows and foreign targets (such as flocks, insects, etc.) besides ruminant cows in the videos, making it even more difficult for detecting the mouth area of the cows.
Table 1 Data of test videos
No. Length of video/s Number of video frames Total cows/ total ruminant cows
Cows’ condition and action in videos Disturbing factors in videos Filming angle
1 15 390 2/1 Side lying, front half-body is in the video Rocking itself, interference with
other cows Shoot from the front 2 10 256 2/1 Side lying, the whole body is in the video Interference with other cows Shoot from the side 3 14 361 3/1 Side lying, the whole body is in the video Insect invasion, ear shaking and
abdomen shaking Shoot from the front 4 15 394 2/1 Side lying, the whole body is in the video Insect invasion Shoot from the side 5 18 453 3/1 Side lying, the whole body is in the video Interference with other cows Shoot from the side 6 11 285 1/1 Side lying, the whole body is in the video Bird invasion Shoot from behind the side 2.2 Methods
When a cow was in ruminant status, the motion of mouth area was larger than that of other regions. Therefore, by calculating the relative motion speed of each pixel using the HS optical flow algorithm of the video frame images, the mouth region of the cow could be detected.
2.2.1 Optical flow algorithm
The Horn-Schunck optical flow[20] is a pixel-level method to accurately detect the moving targets in the image. By analyzing the optical flow field, the motion field of the object can be obtained to detect the moving target. There are two prerequisites based on the optical properties of object movement: (1) The gray level of a moving object remains constant in a short time. (2) The change of velocity vector field in a given neighborhood should be slow. In the experiment, the brightness of two frames before and after each video changes slowly, and the brightness of the image can be approximated to be constant. So, the optical flow field is smooth, and the HS optical flow method is suitable for this study.
According to the first premise, Equation (1) could be obtained:
( , , ) ( , , )
I x y t I xx yy tt (1) where, I(x,y,t) is the grayscale value of pixel (x,y) at time t. Expanding the right part of Equation (1) with Taylor series, we could get Equation (2):
2 ( , , )
( , , ) ( , , ) ( )
( ) I x y t
I x y t I x y t t O t
t (2)
where, O2(δt) is the second and higher order terms, which is ignored, and the chain rule is applied to obtain optical flow constraint equation, as shown in Equation (3):
0
I dx I dy I
x dt y dt t
(3)
The above equation can be written as Equation (4): Ixu+Iyv+It=0
(4) where, Ix and Iy are the spatial gradient components, It is the time
gradient component, and u and v are the image velocity field components. Since there are two variables u and v in the optical flow confinement Equation (4), the velocity can not be solved. Therefore, we need to rely on the second precondition, which is the global smoothing condition of optical flow. Combining Equation (4), and we could get Equation (5):
2 2 2 2
( )
c I ux I vy It dxdy
(5) where, α is a smoothing weight coefficient. The greater the α is, the higher the smoothness is, as well as the estimation accuracy.
For Equation (5), the iterative Equation (6) is obtained by variational calculation according to Euler Equation.
1 2 2 1 2 2 ( ( ) ( ( ) n n
x x t y
n n
x y
n n
y x t y
n n
x y
I I u I I v
u u
I I
I I u I I v
v v I I (6)
where, n is the number of iterations, u and v are the average velocity in the neighborhood of pixel (x,y). When n = 0, 0
u and 0
v are the initial values of optical flow, which are generally 0. The iterative process will end when two adjacent iteration results are less than a reserved value.
The process of using the optical flow to deal with the cow ruminant video is as follows:
Step 1: Read the video fragments. Take Video No. 1 as an example. The first n frames of the video image were extracted. Take n = 40, and set the frame interval t = 1, so that the motion of the two frames is more obvious.
Step 2: Grayscale process of the selected two frame images. The velocity component (u,v), gradient component (Ix, Iy) and
corresponding parameter α were initialized.
188 January, 2019 Int J Agric & Biol Eng Open Access at https://www.ijabe.org Vol. 12 No.1 can be obtained, and the area with larger optical flow was seen as
the moving region.
The processing result of Video No. 1 is shown in Figure 1. Figure 1a shows the two original video frames of Video No. 1. In Figure 1a, the two cows were in tandem and lying next to each other. The test target was the ruminant cow in the back and its front half body was in the image. The other cow was in front and its whole body was in the image. And the own breathing resulted
in body shaking, which produced a larger interference area in optical flow image, increasing the complexity of post-processing and the final detection of cow’s mouth region. Figure 1b is the optical flow result of the original video frames in Figure 1a, where the length and direction of the arrow respectively indicated the length and direction of the speed vector. With reference to Figure 1a, it could be found that the longest area of the arrow in Figure 1b was the mouth area of the cow to be extracted.
a. Original video frames b. Optical flow result
Figure 1 Optical flow result of Video No. 1 2.2.2 Post-processing
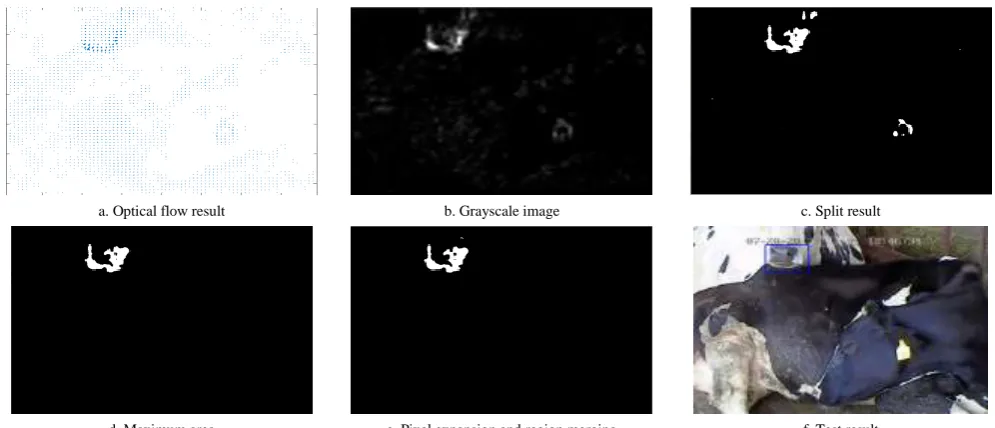
Results of post-processing are shown in Figure 2. Firstly, the optical flow map was transformed to a grayscale image. The brightness of a certain point in the grayscale image was transformed depending on the speed of the optical flow image. The area with a larger velocity was bright and the area with a smaller velocity was dark. Secondly, the appropriate threshold was selected by grayscale histogram to segment the grayscale image. Threshold selection should be as much as possible to eliminate the interference regions. In addition, the maximum area and the centroid position of the segmented image were obtained by
region attributes. The uncertainty of the threshold may lead the mouth area be divided to different regions. So just to extract the mouth area with the maximum area was not accurate. Therefore, it was necessary to expand the pixel point and merge neighboring regions by the centroid position. In this study, the mouth area of the cow was identified and retained, when the distance between the centroid of region and the centroid of the maximum area was less than 50 pixels. Then, the obtained target area was more complete and closer to the actual mouth area of the cow. Finally, the extracted mouth area of the cow was marked with a blue rectangle on the starting frame.
a. Optical flow result b. Grayscale image c. Split result
d. Maximum area e. Pixel expansion and region merging f. Test result
Figure 2 Post-processing of detecting the cow’s mouth area
3 Test results and analysis
3.1 Results
The detected mouth regions of the videos listed in Table 1 are shown in Figure 3. Figures 3a-3e show the detection process of Videos No. 2 to No. 6. Four images were provided for each detection process, including two original video frames, optical flow result and final test result.
With reference to Figure 3, the test videos in Table 1 were grouped by capturing time (morning, noon and evening), and the relevant data results are shown in Table 2. As can be seen from Table 2, since the lengths of six groups of test videos were different, the numbers of video frames were also different. Each video was
a. Test results of Video No. 2
b. Test results of Video No. 3
c. Test results of Video No. 4
d. Test results of Video No. 5
e. Test results of Video No. 6 Figure 3 Results of test videos
Table 2 Results of test data
Morning Noon Evening
No. 1 6 2 5 3 4
Number of video frames 390 285 256 453 361 394
Video frame interval t 1 1 1 1 8 5
Segmentation threshold T 50 50 50 30 100 30
Number of detecting frames 40 40 40 40 40 40
Detection rate/% 10.27 14.04 15.63 8.83 11.08 10.15
Detection of cow's mouth area/pixel 8549 4347 4680 3772 1104 2310
Actual cow's mouth area/pixel 7120 3009 3600 3312 777 1643
Accuracy/% 83.28 69.22 76.92 87.80 70.38 71.13
Running time of algorithm/s 5.89 7.33 6.07 6.34 5.96 6.76
3.2 Analysis
The HS optical flow based on the principle of greater optical flow with larger motion was used to detect the mouth area of ruminant cows in this research. Through analyzing the results, it was found that the detection of the cow’s mouth area was affected by multiple factors.
(1)Effect of the light intensity: Table 2 shows that the test result was the best when the light intensity was the highest at noon, and the accuracy reached 87.80%. The light intensity was moderate in the morning, the accuracy could reach 83.28% and the
result was slightly lower than at noon. The weak light caused the grayscale variation range of the video frame to be too narrow at night, so the segmentation result was not accurate, leading to too large a final identification area and a low accuracy of 71.13%.
190 January, 2019 Int J Agric & Biol Eng Open Access at https://www.ijabe.org Vol. 12 No.1 the front and back two frames and result in errors for detecting the
mouth area. Moreover, the motion of the other parts of the cow in the video and the angle at which the video was captured also had some impact on the test results.
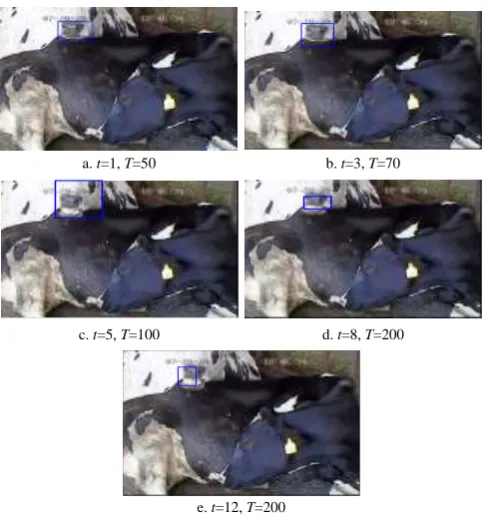
(3)Effect of video frame interval t: Take Video No. 1 as an example, when n = 40, by setting different video frame interval t and segmentation threshold T, the experimental results are shown in Figure 4. As it can be seen in Figures 4a-4c, with the increase of t, the change of speed of each pixel between the selected frames increased, then the number of points with larger optical flow in optical flow image increased, resulting in a mixture of the cow’s mouth area and the interference area and difficult to be divided. As a result, the extracted mouth area of the cow was too large and the accuracy was decreased. From Figures 4d and 4e, it could be found that when the value t was too large, the motion of the cow’s mouth and the interference factors resulted in the larger change of grayscale. Consequently, only a higher segmentation threshold could be set to detect the mouth area, otherwise, the detection was invalid. However, the higher threshold caused over-segmentation, leading to incomplete detection of the mouth area. In short, the video frame interval t was particularly important. In experiments, an appropriate value t should be set so that the difference between the change of velocity of mouth area and that of other areas was as large as possible, making the final detection more accurate.
a. t=1, T=50 b. t=3, T=70
c. t=5, T=100 d. t=8, T=200
e. t=12, T=200
Figure 4 Results of video frame interval t and segmentation threshold T with different values
The subjects used in this study were the ruminant cows in prone position. Considering the case of some ruminant cows under the standing state in actual farming environments, further experiments about this issue were carried out. Results showed that the proposed algorithm in this study was not suitable for monitoring ruminant cows in standing status. When ruminant cows were in standing state, the whole body had a large range of motion, especially the tail area, and the optical flow of the tail area was larger than that of the mouth area in the optical flow image. Thus, the final detection was not ideal and the results are shown in Figure 5. Further research will be focused on the ruminant cows in standing state and automatic detection algorithms should be developed for a wider range of objects.
a. Original video frames
b. Optical flow result c. Test result Figure 5 Results of a ruminant cow in standing state
4 Conclusions
(1)An automatic monitoring method based on machine vision technology was proposed for detecting the mouth region of ruminant cows. The detection of large motion pixel area by HS optical flow and the post-processing could better realize the accurate detection of the cow's mouth area. Test results showed that this method is effective and feasible.
(2)The algorithm shows strong robustness to the intrusion of short-term foreign objects, video quality and the change of light intensity. It lays the foundation for automatic monitoring of cows’ ruminant behavior in complex and changeable environments. (3)In this study, the accuracy of the cow’s mouth area in the standing state is not ideal. Therefore, more in-depth studies should be carried out for the detection of the cow’s mouth area in various states and for multiple cow objects.
Acknowledgment
This work was supported by the National Key Research and Development Program of China (2017YFD0701603), and Natural Science Foundation of China (61473235). The authors wish to thank all the anonymous reviewers, and the authors of the papers cited in this research for their excellent work.
[References]
[1] Shao D. Researches on variation of the rumination and its influencing factors in lactating cows. Jilin University, 2015. (in Chinese)
[2] Viazzi S, Bahr C, Schlagetertello A, Van H T, Romanini C E, Pluk A. Analysis of individual classification of lameness using automatic measurement of back posture in dairy cattle. Journal of Dairy Science, 2013; 96(1): 257.
[3] Zhu W, Pu X, Li X, Lu, C. Automatic identification system of pigs with suspected case based on behavior monitoring. Transactions of the CSAE, 2010; 26(1): 188–192. (in Chinese)
[4] Yin L, Liu C, Hong T, Zhou H, Kaehsiang K. Design of system for monitoring dairy cattle's behavioral features based on wireless sensor networks. Transactions of the CSAE, 2010; 26(3): 203–208. (in Chinese) [5] Viazzi S, Bahr C, Hertem T V, Schlagetertello A, Romanini C E B,
Halachmi I. Comparison of a three-dimensional and two-dimensional camera system for automated measurement of back posture in dairy cows. Computers and Electronics in Agriculture, 2014; 100(1): 139–147. [6] Ji B, Zhu W, Liu B, Li X, Ma C. Video analysis for tachypnea of pigs
based on fluctuating ridge-abdomen. Transactions of the CSAE, 2011; 27(1): 191–195. (in Chinese)
[7] Zhao K, He D. Recognition of individual dairy cattle based on convolutional neural networks. Transactions of the CSAE, 2015; 31(5): 181–187. (in Chinese)
of cattle using an accelerometer. Grassland Science, 2008; 54(4): 231–237. [9] Braun U, Trösch L, Nydegger F, Hässig M. Evaluation of eating and
rumination behaviour in cows using a noseband pressure sensor. BMC Veterinary Research, 2013; 9(1): 164.
[10] He D, Meng F, Zhao K, Zhang Z. Recognition of calf basic behaviors based on video analysis. Transactions of the CSAM, 2016; 47(9): 294–300. (in Chinese)
[11] Kristensen H H, Cornou C. Automatic detection of deviations in activity levels in groups of broiler chickens- A pilot study. Biosystems Engineering, 2011; 109(4): 369–376.
[12] Pluk A, Bahr C, Poursaberi A, Maertens W, Van N A, Berckmans D. Automatic measurement of touch and release angles of the fetlock joint for lameness detection in dairy cattle using vision techniques. Journal of Dairy Science, 2012; 95(4): 1738–1748.
[13] Porto S M C, Arcidiacono C, Anguzza U, Cascone G. A computer vision-based system for the automatic detection of lying behaviour of dairy cows in free-stall barns. Biosystems Engineering, 2013; 115(2): 184–194. [14] Lao F, Teng G, Li J, Yu L, Li Z. Behavior recognition method for
individual laying hen based on computer vision. Transactions of the CSAE, 2012; 28(24): 157–163. (in Chinese)
[15] Wen T, Hong T, Li Z, Luo W, Long X, Chen H. Statistics and tracking of Bactrocera Dorsalis based on machine vision. Transactions of the CSAE, 2011; 27(10): 137–141. (in Chinese)
[16] Zhou Z, Huang Y, Li X, Wen D, Wang C, Tao H. Automatic detecting and grading method of potatoes based on machine vision. Transactions of the CSAE, 2012; 28(7): 178–183. (in Chinese)
[17] Xia M, Cai C. Cattle face recognition using sparse representation classifier. ICIC Express Letters, Part B: Applications, 2012; 3(6): 1499–1505. [18] Cai C, Li J. Cattle face recognition using local binary pattern descriptor.
Signal and Information Processing Association Summit and Conference, IEEE, 2014; pp.1–4.
[19] Chen Y, He D, Fu Y, Song H. Intelligent monitoring method of cow ruminant behavior based on video analysis technology. International Int J Agric & Biol Eng, 2017; 10(5): 194–202.