Evaluation of the SIRMOD model for optimum furrow irrigation
performance
Lanie A. Alejo
1*, Armando N. Espino Jr
2(1. Isabela State University, Echague, Isabela, Philippines; 2. Central Luzon State University, Muñoz, Nueva Ecija, Philippines)
Abstract
: This study was aimed to evaluate and optimize the irrigation performance of a furrow irrigation system in the Philippines using the Surface Irrigation Simulation, Evaluation and Design (SIRMOD) model. Observed infiltration using a double ring infiltrometer and water advance from the actual irrigation experiments conducted on a cornfield was used to calibrate and validate the SIRMOD model in a silty clay loam soil. The simulations showed that with the appropriate cutoff time of irrigation and inflow rates, water savings from 29% to 49% depending on furrow length could be realized. This study revealed that infiltration characteristics derived from infiltration data using the double ring infiltrometer tests would suffice as input to the SIRMOD model to estimate the advance time of irrigation in short furrows (< 100 m). The SIRMOD model also showed the opportunity for water savings in furrow irrigation systems that were important inputs to irrigation development programs, subsidies, policy and decision making for farmers in the country. The same methodology can be used to optimize furrow irrigation systems in other soil conditions on farms in the Philippines and other countries.Keywords:
infiltration characteristics, water savings, SIRMODCitation: Alejo, L.A., and A.N. Espino. 2020. Evaluation of the SIRMOD model for optimum furrow irrigation performance.
Agricultural Engineering International: CIGR Journal, 22(1): 30-39.
1 Introduction
Water losses can get as high as 40% of the total water
input in surface irrigation. More irrigation losses mean
more cost of operation in furrow irrigation systems,
especially for groundwater sources. High irrigation
efficiency translates into lower operating costs, improves
production per unit of water delivered, and improves
Received date: 2019-03-18 Accepted date: 2019-08-05
*
Corresponding author: Lanie Alejandro Alejo, Department of
Agricultural and Biosystems Engineering, College of Engineering, Isabela State University, Echague, Isabela. Email: [email protected]. Tel: +63783231433.
environmental benefit and management (Irmak et al., 2011).
There are no official national records of irrigated corn areas
in the country since corn areas in the Philippines are
dominantly rainfed. Water limitations could cause a 50%
reduction on corn yield (Balderama et al., 2016a). As the
climate continues to change, temperature increases and
rainfall patterns are altered. Consequently, crop losses
continue to incur in the rainfed corn areas. Yield gap on
corn due to water limitations is significantly high that
ranged from 1.7 tons ha-1 to 3.8 tons ha-1 during the 2010
dry spell as a result of simulation using a calibrated and
validated Decision Support System for Agrotechnological
Transfer model (Balderama et al., 2016b). As available
water resources become scarcer, more emphasis is given to
efficient use of irrigation water for maximum economic
return and water resources conservation (Khamssi et al.,
2014). This requires appropriate methods of measuring and
evaluating how efficiently water applied is used optimally
to produce crop yield. Evaluation of irrigation systems
would help define irrigation losses, which are major
constraints in agricultural production. Optimizing irrigation
performance would minimize losses,which would increase
water application efficiency and uniformity. Also, it will
lead to improve in-farm production and reduce negative
impacts on water sources. Shehata (2009) showed furrow
irrigation with gated pipes as the best irrigation practice for
salt leaching would also give high water use efficiency.
Doable methods of increasing efficiency in corn farms are
through optimized furrow design and irrigation parameters.
Many surface irrigation systems are ineffective and
inefficient. This can be caused by physical constraints (e.g.,
steep land slopes, shallow soils, poor water supplies, etc.),
by poor design and layout, or by improper operation and
management (Clemmens, 2007). Furrow irrigation is one of
the inexpensive and probably low-technique methods of
surface irrigation. This traditional method generally
requires higher labor and fuel consumption. It also has
lower water use efficiencies and sometimes causes erosion.
However, with the right intervention in furrow design and
irrigation management, it could also yield high irrigation
efficiency and consequently reduce loss and cost of
operation.
Surface irrigation models have been helpful research
tools that offer fast and reliable computations of soil-water
processes to improve irrigation management, design, and
operations. One of which is the Surface Irrigation
Simulation, Evaluation and Design (SIRMOD) model. The
SIRMOD model simulates the vertical and lateral
movement of water in the soil. It uses the modified
Kostiakov-Lewis model for simulating infiltration and the
Saint-Venant Equations for the hydraulics of surface
irrigation. It can estimate time of advance, depth of
infiltration and irrigation performance from various fields
and irrigation input parameters. These include infiltration
characteristics, field and furrow geometry. It also has
different irrigation simulation options to choose. The
SIRMOD presents a simplified field design module and a
‘two-point’ solution for the calculation of the infiltration
parameters from the irrigation advance data. Calibration of
infiltration characteristics in the model has been done using
the two-point method which uses observed data on advance
time of irrigation (Ismail and Depeweg, 2005; Smith et al.,
2005). The two-point method is based on the advance time
of irrigation needed to reach half of the furrow length. The
‘two-point’ method in the SIRMOD model was developed
for long furrows (> 300 m) (Elliott and Walker, 1982).
However, Ismail and Depeweg (2005) found in their study
that it could also adequately simulate block-ended
continuous and surge flow irrigation in short furrows (<
100 m). The present study attempts to investigate the
appropriateness of the observed infiltration data from a
double ring infiltrometer test to calibrate the
Kostiakov-Lewis equation for simulating infiltration in short
open-ended furrows under the local soil conditions in the study
area.
Researchers have proven the applicability of the
SIRMOD model for evaluating and improving irrigation
efficiencies in surface irrigation systems through irrigation
design and management. It has been widely used in
Australia for surface irrigation applications (Clark et al.,
2009; Smith et al., 2005). Khasraghi et al. (2015) used
SIRMOD for open- and closed-end border irrigation
systems in Utah, USA and found that the model performed
better in predicting recession times in open-ended border
irrigation systems. Mehana et al. (2009) studied the
predictive ability of SIRMOD for clay loam soils in Egypt
and found that it had adequately described the advance and
recession times of irrigation as well as the infiltrated depth.
The SIRMOD model was also found to accurately predict
advance time from continuous and surge irrigation in Cuba
calibrated SIRMOD model to evaluate and optimize
irrigation distribution uniformity in alternate and
conventional furrow irrigation in China. As of this date,
there are no published studies on the evaluation of the
SIRMOD model for optimization of furrow irrigation
systems in Philippines. This study can be served as an input
to the development of irrigation protocols on furrow
irrigation cornfields in the country. It will be served as a
baseline for policy and decision makers to support the
improvement and sustainability of corn production. This
study aimed to evaluate the SIRMOD model to optimize
the irrigation performance of a furrow irrigation system in
Philippines.
2 Materials and methods
2.1 The study site
The study was conducted in the Cagayan Valley
Research Center, Isabela, Philippines geographically
located at 17°7”52.56’ North and 121°52”30.54’ East at an
elevation of 53 meters above mean sea level. Average
historical weather data of 25 years (1988 to 2013) showed
that the hottest month could be observed in June with an
extreme value of 35.64°C and the coldest is January with a
minimum value of 19.88°C. Rainy season starts in the
month of May and ends in December. Annual average
historical rainfall amounts to 2176 mm. Dependable rainfall
during dry years is highest in the months of November with
237 mm and lowest in the months of March with 42 mm.
Annual dependable rainfall during dry year’s amounts to
1618 mm. Corn is a cash crop in the region. It requires 800
mm of water from planting to maturity. Planting of this
crop in the area usually takes place in the months of
January. Its maturity occurs at 120 days after planting.
Evapotranspiration is high in the months of May with 168
mm and lowest in the months of January with 73 mm. Due
to the deficit between dependable rainfall and
evapotranspiration, irrigation is needed starting in the
month of January until July, when evapotranspiration is
higher than the dependable rainfall. From the Bureau of
Soils and Water Management laboratory analysis, silty clay
loam is the type of soil in the area having a field capacity of
0.37 m3 water/m3 of soil and permanent wilting point of
0.24 m3 water/m3 of soil.
2.2 The SIRMOD model
The SIRMOD model uses three approaches, viz., the
full hydrodynamic (HD), zero-inertia (ZI) and
kinematic-wave (KW) to simulate the hydraulics of surface irrigation
(border, furrow, and basin) on the field scale and helps in
the evaluation of alternative field layouts, i.e. field length,
slope, and management practices like water application
rates and cutoff times (Walker 1998). Moradzadeh et al.
(2013) proved that the three irrigation models in SIRMOD
could adequately predict water advance and recessions in
furrow irrigation designs in Iran and concluded that the
hydrodynamic and zero inertia models were better than the
kinematic wave model. Similarly, Valipour (2012)
compared the three available irrigation hydraulic models
and found that all of these models were capable of
representing surface irrigation processes in many situations,
however, mentioned the power of hydrodynamic and zero
inertia models in the simulation process. The hydrodynamic
model is the most complex but most accurate numerical
simulation model (Khasraghi et al., 2015). Hence, the full
hydraulic model was chosen for this study. This model is
based on the governing equations of the Saint-Venant
equations;
0
y q z
t x t
∂ +∂ +∂ =
∂ ∂ ∂
(1)
2
o f
y q z
gy gy( S S )
t y x t
∂ + ∂ + ∂ = −
∂ ∂ ∂
(2)
where y (m) is the depth of flow, q (m3 s-1) is the
discharge per unit width, z (m2) is the infiltrated volume per
unit length, g (m2 s-1) is the acceleration due to gravity,
So(m m -1
) is the field slope and Sf is the (m m -1
) energy
gradient.
The modified Kostiakov-Lewis equation (Mezencev,
1948) is used in approximating infiltration depth. Its more
a o
Z=kt + f t
(3) in which fo is the long term steady, or 'basic' infiltration rate
in units of volume per unit length per unit time and width.
The SIRMOD software allows the user to specify furrow,
border, or basin configurations with free-draining or
blocked downstream boundary conditions under continuous
or surged flow regimes and cutback options. The input data
requirements for the simulation component include the field
length, slope, infiltration characteristics, and advance data,
target application depth, water application rate, Manning’s
resistance, and furrow geometry.
2.3 Data collection for model set-up, calibration, and
validation
To calibrate and validate the SIRMOD model, double
ring infiltrometer test and irrigation experiment were
conducted. Prior to the irrigation experiment, infiltrometer
test using a double ring infiltrometer was conducted at the
middle of the field. Since the field is homogenous, one
infiltrometer test was enough to represent the infiltration
characteristics of the soil. The infiltrometer test result was
used to determine the calibrated values of k, a and fo for the
infiltration model in the area. Since the furrows are short (<
100 m), the infiltration model derived based on the
infiltrometer test is considered adequate. The simulated
infiltration rate using the modified Kostiakov-Lewis
equation was compared to the actual observed infiltration
rate in the field to determine how well the equation fits in
the area’s local soil conditions. The coefficient of
determination and t-test’s p-value were used as tests of
goodness of fit between actual and simulated data both for
calibration and validation processes. The coefficient of
determination (R2) describes the degree collinearity
between simulated and measured data. It describes the
proportion of the variance in measured data explained by
the model. R2 ranges from 0 to 1, with higher values
indicating less error variance, and typically values greater
than 0.5 are considered acceptable (Santhi et al., 2002; Van
Liew et al., 2003). Although R2 has been widely used for
model evaluation, these statistics are oversensitive to high
extreme values and insensitive to additive and proportional
differences between model predictions and measured data
(Legates and Mccabe, 1999). Thus, samples t-test
procedure was used to statistically compare evaluation
variables. The test computes the differences between values
of the two variables for each data set and tests whether the
average differs from zero. If the p-value associated with t exceeds 0.05, no significant differences can be established between observed and simulated data. Upon successfully
calibrating the infiltration equation, it was used as input to
the SIRMOD model.
Actual conditions and irrigation management of furrow
irrigation system in the study area were inputted in the
model. The field slope along the furrow is 1%. Data
measured during the experiment include the field
topography and geometry, inflow and outflow rates, time of
advance and infiltration rates. A profilometer was utilized
to measure the furrow sectional area. Furrow
cross-sectional area was found to have an average value of 480.25
square centimeters. The irrigation requirement is equivalent
to the infiltration requirement (Zreq). Soil moisture meter
was used to determine the current soil moisture in the area
which is then used to compute for the infiltration
requirement. Furrow lengths commonly used in the study
area are 50, 75 and 100 meters. These lengths were
evaluated with varying inflow rates, 4.2 lps, 4.5 lps, and 4.7
lps. With these, there were nine irrigation events
undertaken. During the irrigation, inflow at the head was
observed periodically using a Parshall flume. Also, the time
of advance was observed as the water reached the end of
the furrow. The recorded time of advance was used to
validate the performance of the SIRMOD model. It was
compared to the SIRMOD simulated time of advance. The
model was simulated under furrow irrigation field system,
and free draining downstream boundary. The simulation
shutoff control by the target application, Zreq, continuous
flow of furrow irrigation and hydrodynamic type of
simulation were selected for the inflow controls. The target
the time of application, which was 30 cm.
2.4 Evaluation of current furrow irrigation practice
After successfully calibrating and validating the
SIRMOD model for the study area, it was used to assess the
overall performance efficiency of the furrow irrigation
system. The indicators such as distribution uniformity,
application efficiency and requirement efficiency as
suggested by Walker (2003) were used. Merriam and Keller
(1978) proposed that distribution uniformity was defined as
the average infiltrated depth in the low quarter of the field,
and was divided by the average infiltrated depth over the
whole field. The application efficiency is the water losses
from the field occur as deep percolation (depths greater
than Zreq) and as field tailwater or runoff. The requirement
efficiency is an indicator of how well the irrigation meets
its objective of refilling the root zone. This parameter is the
most directly related to the crop yield since it will reflect
the degree of soil moisture stress.
2.5 Optimization of furrow irrigation design and
parameters
Optimum irrigation performance is achieved when both
application efficiency and distribution uniformity are high
while the requirement efficiency is satisfied accordingly.
The optimum target for distribution uniformity is 80% and
above which is considered high and the requirement
efficiency of 99% should be attained for optimum
application efficiency. Optimization was undertaken using a
successfully calibrated and validated SIRMOD model for
the study area. Optimum cutoff time was first determined
for the 4.2, 4.3 and 4.5 lps inflow rates. The shortest cutoff
time with optimum irrigation performance was considered
the optimum cutoff time. The optimum cutoff time for each
furrow length was used to determine the optimum irrigation
performance in terms of inflow rate for the 100-m, 75-m,
and 50-m furrow length. The relationships of application
efficiencies to cutoff time and inflow rates were established
for each furrow length.
3 Results
3.1 SIRMOD model calibration
Based on the infiltrometer test, the basic infiltration rate
was 0.000416 m3 min-1 per unit width per unit length. The a
and k parameters are empirical coefficients which were
based on the first data points in the infiltrometer test. Based
on the infiltrometer test result analysis, the infiltration
function in the area was derived as follows,
0 2016
0 016456 . 0 000416
Z= . t + . t (4)
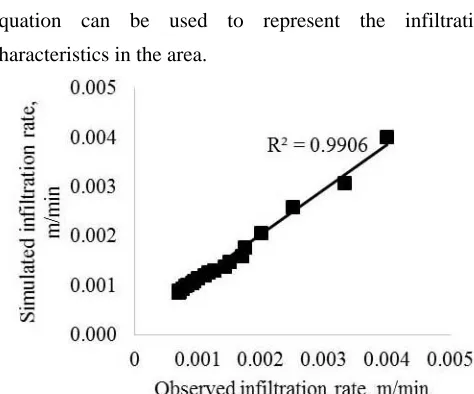
Where Z is the depth of infiltration, m and t is the time
of infiltration, min. Figure 1 shows the goodness of fit
between actual and K-L computed infiltration rate. The K-L
equation performed well in replicating the actual infiltration
rate with 0.99 R2 with a p-value greater than 0.05 in the
t-test result. This suggests that the derived infiltration
equation can be used to represent the infiltration
characteristics in the area.
Figure 1 Comparison of simulated and actual infiltration rate in the study area
3.2 SIRMOD model validation
Figure 2 shows the goodness of fit between observed
and simulated advance time. The goodness of fit between
the simulated and actual time of advance is high at 99.8%.
The t critical (2.12) is greater than the t-statistic (0.31) and
a p-value of 0.76 (>0.05) showed that the variability
between means of simulated and actual time of advance
was not significant, which means the validation was
successful. This implies that the model accurately
computed the time of advance and can be used to simulate
advance time was carefully observed and recorded which
may have contributed to high goodness of fit. This result
also proved that the calibrated infiltration equation fits the
actual soil characteristics in the area.
Figure 2 Actual versus simulated time of advance of the nine irrigation events in 100-m, 75-m and 50-m furrow length with 4.2, 4.5
and 4.7 lps inflow rates
3.3 Evaluation of the existing furrow irrigation practice
Since the model was successfully calibrated and
validated, it was used to estimate the irrigation performance
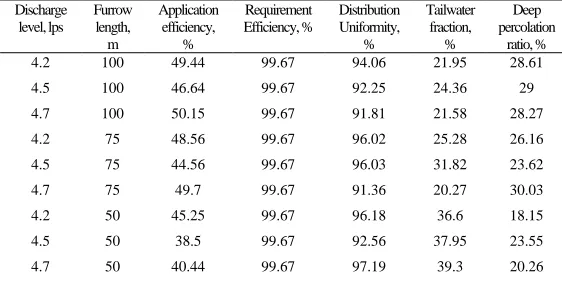
of current practice in the study area. Results showed that
the application efficiency of furrow irrigation systems in
the study area was relatively low which ranged from
33%-50% in 100-m furrow lengths, 42%-47% in 75-m furrow
lengths and 37%-45% in 50-m furrow lengths (Table 1).
Table 1 Evaluation results for the current furrow irrigation
practice in the area
Discharge level, lps
Furrow length, m
Application efficiency,
%
Requirement Efficiency, %
Distribution Uniformity,
%
Tailwater fraction,
%
Deep percolation
ratio, %
4.2 100 49.44 99.67 94.06 21.95 28.61
4.5 100 46.64 99.67 92.25 24.36 29
4.7 100 50.15 99.67 91.81 21.58 28.27
4.2 75 48.56 99.67 96.02 25.28 26.16
4.5 75 44.56 99.67 96.03 31.82 23.62
4.7 75 49.7 99.67 91.36 20.27 30.03
4.2 50 45.25 99.67 96.18 36.6 18.15
4.5 50 38.5 99.67 92.56 37.95 23.55
4.7 50 40.44 99.67 97.19 39.3 20.26
The tailwater ratios varied from 21%-24% in 100-m
furrow lengths, 20%-31% in 75-m furrow lengths and
36%-39% in 50-m furrow lengths. Deep percolation ratios
ranged from 28%-29%, for 100-m furrow lengths,
23%-30% in 75-m furrow lengths and 18%-23% in the 50-m
furrow lengths. These values are lower compared to the
60% application efficiency for surface irrigation published
by FAO. Therefore, there is an opportunity to optimize the
furrow irrigation system in the area.
3.4 Optimization of furrow irrigation
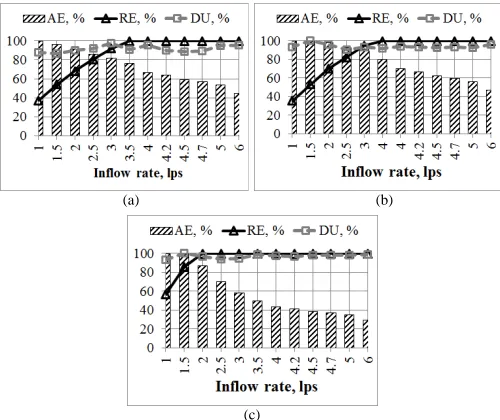
The optimum cutoff time with almost 100% irrigation
requirement satisfied and distribution uniformity of more
than 80% are shown in Figure 3, Figure 4 and Figure 5 for
the 100-m, 75-m, and 50-m furrow lengths, respectively. It
can be observed that the variation in inflow rates did not
significantly affect the optimum cutoff time for all the
furrow lengths studied. However, there were differences in
the optimum performance indices, particularly on the
application efficiency. All of the chosen optimum cutoff
time had more than 80% distribution uniformities and
almost 100% requirement efficiencies.
The optimum cutoff time for the 100-m furrow length
was 15 minutes for individual furrows for all the set inflow
rates. For this cutoff time and furrow length, the 4.2 lps
inflow rate yielded the highest application efficiency with
64%, followed by the 4.5 lps with 59% and the 4.7 lps with
57%. The same trend was observed in the 75-m furrow
length. The optimum cutoff time for the 75-m furrow length
was found to be 10 minutes per furrow. Similarly, the
lowest inflow rate gave the highest application efficiency.
The 4.2 lps inflow rate yielded an application efficiency of
67%, the 4.5 lps with 62% and the 4.7 lps with 60%. The
50-m furrow length had the same optimum cutoff time with
the 75-m furrow length but had lower application
efficiencies.
The 4.2 lps resulted in an application efficiency of 44%,
the 4.5 lps with 39% and the 4.7 lps yielded the lowest with
39%. It is notable that the set inflow rates seemed to be
most appropriate for the 100-m and 75-m furrow lengths,
which yielded better application efficiencies compared to
the shortest furrow length. Piping systems that would
provide simultaneous irrigation to individual furrows will
(a) (b)
(c)
Figure 3 Sensitivity analysis on cutoff time for the (a) 4.2 lps, (b) 4.5 lps and (c) 4.7 lps in 100 meter furrow length
(a) (b)
(c)
Figure 4 Sensitivity analysis on cutoff time for the (a) 4.2 lps, (b) 4.5 lps and (c) 4.7 lps in 75 meter furrow length
(a) (b)
(c)
Figure 5 Sensitivity analysis on cutoff time for the (a) 4.2 lps, (b) 4.5 lps and (c) 4.7 lps in 50 meter furrow length
Using the optimum cutoff time for each furrow length,
the inflow rates were further varied from 1 lps to 6 lps to
further investigate if there was still room for increasing the
performance of irrigation in the area. It can be observed in
Figure 6 that the optimum inflow rate was 3.5 lps both for
the 100-m and 75-m furrow lengths while 2 lps for the
50-m furrow length. Si50-milarly, these 50-manage50-ment
combinations yielded more than 80% distribution
uniformities and almost 100% requirement efficiencies.
However, application efficiencies varied across optimum
inflow rates and furrow lengths. The 100-m furrow length
can be optimized with an application efficiency of as high
as 76%, while the 75-m furrow length up to 80%. Notably,
the 50-m furrow length had the biggest leap with the
highest application efficiency of 87%. These suggest that
with the proper combination of cutoff time and inflow rates
depending on the furrow length, water savings can range
from 29%-49% relative to the current furrow irrigation
practice. The current practice of using 4.5 lps inflow rates
had 47% application efficiency in the 100-m furrow length,
45% in the 75-m furrow length and 38% in the 50-m furrow
length. These suggest that farmers in the area can buy lower
capacity water pumps, thus lower buying cost. These result
can now be used as decision support to farmers irrigation
operation and the government in providing water pump
subsidies for farmers.
(a) (b)
(c)
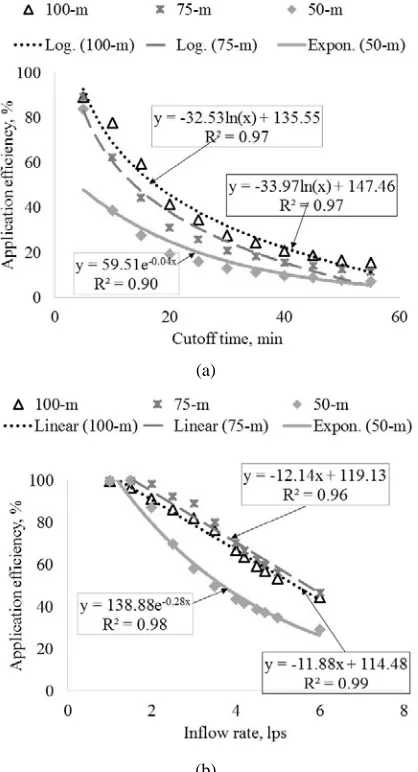
To further magnify the impact of irrigation management
on irrigation performance, the relationship of application
efficiencies to cutoff time and inflow rates were analyzed.
The results showed that as the cutoff time of irrigation was
increased, the application efficiency decreases
logarithmically for the 100-m and 75-m furrow lengths and
decreases exponentially in the 50-m furrow length (Figure
7). In addition, as the inflow rate increases, the application
efficiency decreases linearly both in the 100-m and 75-m
furrow lengths while it decreases exponentially in the 50-m
furrow length.
(a)
(b)
Figure 7 Relationship of application efficiency to (a) cutoff time and (b) inflow rate for each furrow length
3.5 Discussion
The calibration of the SIRMOD model using the
observed infiltration data from the double ring infiltrometer
test has been proven to be adequate for simulating the
advance time of irrigation in the area. This suggested that
the method could be used as an alternative to the two-point
method which needs an observed time of advance for
calibration. However, this conclusion has been drawn from
the study of short furrows (< 100 m). Ismail and Depeweg
(2005) also used SIRMOD in short furrows and found that
the two-point method could be enough to determine the
infiltration characteristics for short furrows under
continuous and surge flow irrigations. This result may be
largely due to the homogenous soil and crop conditions in
the area. This study finds and offers an alternative to the
two-point method, which needs actual irrigation
experiments to collect irrigation advance data. The double
ring infiltrometer is a simpler technique, which may need
less water, time and work compared to the two-point
method.
The evaluation of the current furrow irrigation practice
revealed low efficiencies, which implied that appropriate
irrigation management is needed. Sensitivity analyses
showed higher discharge rate yielded lower application
efficiency and lower discharge rates yielded higher
application efficiencies. Low efficiency in furrows with
high inflow rate was due to the high value of tailwater and
deep percolation ratio. The shorter cut-off time and lower
inflow rates would lead to lower fuel cost, time saving and
lower operating cost. Water savings from 29% to 49%,
depending on the furrow length can be realized by using 10
to 15 minutes cutoff time and 3 to 3.5 liters per second
inflow rates during irrigation operations. From the result of
this study, a farmer can now base his decision on buying a
pump with his existing furrow length and desired cutoff
time to achieve optimum water savings and thus, lower cost
of operation. Also, with a given pump discharge capacity, a
farmer can now select the cutoff time that will save time of
irrigation and fuel consumption that will give optimum
irrigation performance. Application efficiency is adversely
affected by an increase in inflow rates and cutoff time, thus
these changes are significant to optimize water savings in
operations. Moreover, shortening furrows to 50 meters
while using the optimum irrigation management can also be
considered since they were found to have the best
performance. The SIRMOD model demonstrated its
usefulness in assessing furrow irrigation systems in
Philippines. It also showed the doable techniques to
conserve water without reductions on crop water
requirement through improved application efficiency and
sustained distribution uniformity and requirement
efficiency. The same method of optimization for furrow
irrigation systems using the SIRMOD model can also be
employed in other soil conditions in the Philippines and
other countries.
3.6 Conclusion
This study proved that the SIRMOD model can be used
to evaluate and optimize furrow irrigation system in the
Philippines. Infiltration characteristics derived from a
double ring infiltrometer test was proven to be adequate
input to simulate time of water advance in short furrows.
Optimized furrow irrigation systems with the appropriate
combination of the cutoff time, inflow rate and furrow
length could lead to water savings ranging from 29% to
49%. The results of this study could be used as decision
support in selecting the best combination of assessed
furrow irrigation parameters that could be adjusted
depending on the available resources and field size of a
farmer. Furrow irrigation system’s evaluation and
optimization for various soil conditions in the Philippines
and in other countries could also be conducted following
the methodology of this study.
Acknowledgment
This research was financially supported by the Isabela
State University, Philippines under their general
appropriations act funds and assisted by the Central Luzon
State University by providing research tools (profilometer
and Parshall flumes) through their project funded by the
Department of Science and Technology- Philippine Council
for Agriculture, Aquatic and Natural Resources Research
and Development. The authors would also like to thank the
Cagayan Valley Research Center, Department of
Agriculture Regional Field Unit 2, Ilagan City Isabela for
the provision of experimental area.
References
Balderama, O., L. Alejo, and E. Tongson. 2016a. Calibration, validation and application of CERES-Maize model for climate change impact assessment in Abuan Watershed, Isabela, Philippines. Climate, Disaster and Development Journal, 2(1): 11–20.
Balderama, O. F., L. S. Alejandro, O. O. Barbosa, and M. R. B. Mata. 2016b. Assessment of potential yield and climate change sensitivity of selected dryland crops in Cagayan Valley, Philippines using simulation models. BIMP-EAGA Journal for Sustainable Tourism Development, 5(1): 102–113.
Clark, B., L. Hall, G. Davids, W. Walker, and J. Eckhardt. 2009. Application of SIRMOD to evaluate potential tailwater reduction from improved irrigation management. In World Environmental and Water Resources Congress, 1-11. Reston, VA, 17-21 May.
Clemmens, A. J. 2007. Simple approach to surface irrigation design: theory. Journal of Land and Water, 1: 1–19.
Elliott, R. L., and W. R. Walker. 1982. Field evaluation of furrow irrigation and advance functions. Transactions of the ASAE, 25(2): 396–400.
Irmak, S., L. O. Odhiambo, W. L. Kranz, and D. E. Eisenhauer. 2011. Irrigation efficiency and uniformity, and crop water use efficiency. Biological Systems Engineering: Papers and Publications,451.https://digitalcommons.unl.edu/biosysengfac ub/ 451
Ismail, S. M., and H. Depeweg. 2005. Simulation of continuous and surge flow irrigation under short field conditions. Irrigation and Drainage, 54(2): 217–230.
Khamssi, N. N., K. G. Golezani, S. Zehtab, and A. Najaphy. 2014. Canopy growth , irrigation water use efficiency and relative water content of chickpea under acclimation to gradual water deficit conditions. International Journal of Plant, Animal and Environmental Sciences, 4(1): 324–331.
Khasraghi, M. M., M. A. G. Sefidkouhi, and M. Valipour. 2015. Simulation of open- and closed-end border irrigation systems using SIRMOD. Archives of Agronomy and Soil Science, 61(7): 929–941.
Mehana, H. M., K. F. Bagoury, M. M. Hussein, and A. M. El-Gindy. 2009. Validation of surface irrigation model SIRMOD under clay loam soil conditions in Egypt. Misr Journal of Agricultural Engineering, 26(3): 1299–1317.
Merriam, J. L. and J. Keller. 1978. Farm Irrigation System Evaluation: A Guide for Management. Logan, Utah : Agricultural & Irrigation Engineering Department, Utah State University.
Mezencev, V. J. 1948. Theory of formation of the surface runoff. Meteorologiae Hidrologia, 3: 33–40.
Moradzadeh, M., S. Boroomandnasab, R. Lalehzari, and M. Bahrami. 2013. Performance evaluation and sensitivity analysis of various models of SIRMOD software in furrow irrigation design. Water Engineering, 6(18): 63–73.
Rodríguez, J. A., A. Díaz, J. A. Reyes, and R. Pujols. 2004. Comparison between surge irrigation and conventional furrow irrigation for covered black tobacco cultivation in a Ferralsol soil. Spanish Journal of Agricultural Research, 2(3): 445–458. Santhi, C., J. G. Arnold, J. R. Williams, W. A. Dugas, R. Srinivasan,
and L. M. Hauck. 2002. Validation of the SWAT model on a large river basin with point and nonpoint sources. Journal of the American Water Resources Association (JAWRA), 37(5): 1169–1188.
Shehata, A. A. 2009. Comparison among different irrigation systems for deficit-irrigated corn in the Nile Valley. Agricultural
Engineering International: CIGR Journal, XI: manuscript LW 08010.
Smith, R. J., S. R. Raine, and J. Minkevich. 2005. Irrigation application efficiency and deep drainage potential under surface irrigated cotton. Agricultural Water Management, 71(2): 117–130.
Valipour, M. 2012. Comparison of surface irrigation simulation models: full hydrodynamic, zero inertia, kinematic wave. Journal of Agricultural Science, 4(12): 68-74.
Van Liew, M. W., J. G. Arnold, and J. D. Garbrecht. 2003. Hydrologic simulation on agricultural watersheds: choosing between two models. Transactions of the ASAE, 46(6): 1539– 1551.
Walker, W. R. 1998. SIRMOD - Surface Irrigation Modeling Software. Logan, Utah: Department of Biological and Irrigation Engineering, Utah State University.
Walker, W. R. 2003. SIRMOD III Surface Irrigation Simulation, Evaluation and Design Guide and Technical Documentation. Logan, Utah: Department of Biological and Irrigation Engineering, Utah State University.