jalaaSayaaoM maoM vaaYpna inayaM~Na
jalaaSayaaoM maoM vaaYpna inayaM~Na
jalaaSayaaoM maoM vaaYpna inayaM~Na
jalaaSayaaoM maoM vaaYpna inayaM~Na
Evaporation Control in Reservoirs
Baart sarkar
Baart sarkar
Baart sarkar
Baart sarkar
Government of India
kond`Iya jala Aayaaoga
kond`Iya jala Aayaaoga
kond`Iya jala Aayaaoga
kond`Iya jala Aayaaoga
Central Water Commission
baoisana Aayaaojana evaM p`baMQa saMgazna
baoisana Aayaaojana evaM p`baMQa saMgazna
baoisana Aayaaojana evaM p`baMQa saMgazna
Baart sarkar
Baart sarkar
Baart sarkar
Baart sarkar
kond`Iya jala Aayaaoga
kond`Iya jala Aayaaoga
kond`Iya jala Aayaaoga
kond`Iya jala Aayaaoga
baoisana Aayaaojana evaM p`baMQa saMgazna
baoisana Aayaaojana evaM p`baMQa saMgazna
baoisana Aayaaojana evaM p`baMQa saMgazna
baoisana Aayaaojana evaM p`baMQa saMgazna
GOVERNMENT OF INDIA
CENTRAL WATER COMMISSION
BASIN PLANNING AND MANAGEMENT ORGANISATION
jalaaSayaaoM maoM vaaYpna inayaM~Na
jalaaSayaaoM maoM vaaYpna inayaM~Na
jalaaSayaaoM maoM vaaYpna inayaM~Na
jalaaSayaaoM maoM vaaYpna inayaM~Na
EVAPORATION CONTROL IN RESERVOIRS
List of Officials involved in bringing out this publication
1.
Sh. S.K.Sinha, Chief Engineer (BPMO), CWC New Delhi
2.
Sh Lalit Kumar, (Ex.) Director (Reservoir Operation), CWC, New Delhi
3.
Sh. Rishi Srivastava, Dy. Director (Reservoir Operation), CWC, New Delhi
4.
Sh. R. Thangamani, (Ex.) Dy. Director, (Reservoir Operation, CWC, New Delhi
5.
Sh Sunil Kumar, Dy. Director, (WSE), CWC, New Delhi
Table of Contents
1.0 INTRODUCTION... 1
2.0 ASSESSMENT OF EVAPORATION LOSSES IN INDIA ... 3
3.0 FACTORS AFFECTING EVAPORATION ... 4
3.1 WATER SURFACE AREA ... 4
3.2 TEMPERATURE ... 4
3.3 VAPOUR PRESSURE DIFFERENCE ... 4
3.4 WIND EFFECT ... 4
3.5 ATMOSPHERIC PRESSURE ... 4
3.6 QUALITY OF WATER ... 5
4.0 METHODS OF DETERMINING EVAPORATION ... 6
4.1 WATER BUDGET /STORAGE EQUATION METHOD ... 6
4.2 MEASUREMENT IN AN AUXILIARY PAN ... 9
4.3 EMPIRICAL FORMULAE ... 10
4.4 MASS TRANSFER OR HUMIDITY AND WIND VELOCITY GRADIENT METHOD ... 12
4.5 ENERGY BUDGET /INSOLATION METHOD ... 12
5.0 MONTHLY AND ANNUAL EVAPORATION ... 13
6.0 METHODS TO REDUCE EVAPORATION ... 28
6.1 WIND BREAKERS ... 28
6.2 COVERING THE WATER SURFACE ... 33
6.3 REDUCTION OF EXPOSED WATER SURFACE ... 34
6.4 UNDERGROUND STORAGE ... 34
6.5 INTEGRATED OPERATION OF RESERVOIRS ... 35
6.6 TREATMENT WITH CHEMICAL WATER EVAPO-RETARDERS (WER) ... 35
6.7 SHORT TERM MEASURES ... 36
6.7.1 Merits of Chemical WERs ... 36
6.7.2 Demerits of Chemical WERs ... 36
6.8 LONG TERM MEASURES ... 37
7.0 CASE STUDIES OF EVAPORATION RETARDATION– MEASURES IN INDIA ... 39
7.1 CHEMICAL WATER EVAPORATION RETARDERS (WER)... 39
7.1.1 Irrigation Development Division, Mumbai ... 39
7.1.2 Central Soil & Materials Research Station, New Delhi ... 42
7.1.3 Institute of Hydraulics and Hydrology, Poondi, Chennai ... 44
7.1.4 Karnataka Engineering Research Station, Krishnaraja Sagar ... 44
7.1.12 Review of Studies Carried out in India by Various Agencies ... 61
7.2 OTHER EVAPORATION RETARDATION MEASURES ... 71
7.2.1 Chennai Metropolitan Water Supply and Sewerage Board ... 71
7.2.2 Measures adopted in Gujarat and Other States ... 73
8.0 CASE STUDIES OF EVAPORATION CONTROL IN OTHER COUNTRIES ... 79
8.1 USING WATER EVAPORATION RETARDERS ... 79
8.1.1 Stephen Creek Reservoir, Broken Hill, Australia ... 79
8.1.2 Lake Hefner, USA ... 79
8.1.3 Malya Reservoir and Other Lakes, Africa ... 79
8.1.4 Adelaide Hills Reservoir, Australia ... 79
8.1.5 Yanling, Shanxi, China-2001 ... 80
8.1.6 Monolayer’s Role in Hurricane Mitigation through Evaporation Reduction ... 80
8.2 OTHER EVAPORATION RETARDATION MEASURES ... 81
8.2.1 Compartmentalisation of Reservoirs ... 81
8.2.2 Floating Granular Material... 81
8.2.3 Floating Rubber Sheets ... 81
8.2.4 Foamed Wax Blocks ... 81
8.2.5 GHD Pty Ltd Australia ... 81
9.0 PROPERTIES OF CHEMICAL WATER EVAPO-RETARDANTS MONOLAYER ... 84
9.1 HIGHER FATTY ALCOHOLS ... 84
9.2 INDICATOR OILS ... 87
10.0 MERITS AND DEMERITS OF SOLID AND EMULSION FORM OF WERS ... 89
10.1 DOSAGE ... 89
10.2 PROCEDURE OF SPREADING ... 89
10.3 EFFECT OF WIND ... 89
11.0 GUIDELINES FOR USE OF CHEMICAL WERS ... 90
11.1 APPLICATION IN EMULSION FORM ... 90
11.2 APPLICATION IN POWDER FORM ... 90
11.3 QUALITY OF WATER ... 91
11.4 EQUIPMENT REQUIRED ... 91
11.5 GUIDELINES FOR TESTING FILM PRESSURE ... 91
12.0 ECONOMICS IN USE OF VARIOUS METHODS ... 92
12.1 CHEMICAL WERS ... 92
12.2 COMPARTMENTALISATION OF RESERVOIRS ... 92
13.0 SUGGESTED AREAS OF FURTHER RESEARCH AND DEVELOPMENT ... 93
1.0
INTRODUCTION
Water is one of the nature’s precious gifts, which sustains life on earth. Civilizations over the world have prospered or perished depending upon the availability of this vital resource. Water has been worshiped for life nourishing properties in all the scriptures. Vedas have unequivocally eulogized water in all its virtuous properties.
The total water resources on earth are estimated to be around 1360 Million cubic km. Out of which only about (33.5 Million cubic km) is fresh water. India possesses only 4% of total average runoff of the rivers of the world although it sustains 16% of the world’s population. The per capita availability of water in the country is only 1820 m3/year, compared to 40855 m3/year in Brazil, 8902 m3/year in USA, 2215 m3/year in China, 2808 m3/year in Spain, 18162 m3/year in Australia, 3351 m3/year in France, 3614 m3/year in Mexico, and 3393 m3/year in Japan. The total water resources of India are estimated to be around 1,869 BCM. Due to topographic, hydrological and other constraints, only about 690 BCM of total surface water is considered as utilizable.
In the earlier days availability of water was taken for granted. It is now being realized that water, though replenishable, is not an unlimited resource and cannot be produced or added as and when required, by any known technological means. The other important limitation is that the availability of water over the years depends upon the spatial and temporal variation of precipitation. Thus water may be abundant during monsoon season and scarce in non-monsoon season, when most needed. The ingenuity of man, therefore, lies in his ability to modify the pattern of availability of water to suit needs. One of the commonest forms of such modification is storage of water during monsoon season for eventual use in lean season. The traditional methods are big storage in natural or artificial ranks. Lately a large number of storages have been constructed. Due to high temperatures and arid conditions in about one third of the country, the evaporation losses have been found to be substantial. Therefore, it is imperative to minimise evaporation losses in the storages/water bodies.
The need for prevention of enormous evaporation losses assumes greater significance, in view of the predictable scarcity of water; the country will be facing in future. It has been assessed that against the utilizable water resources of the order of 1123 BCM, the requirement by 2025 AD to be met from surface water resources will be around 1093 BCM, thereby surplus by just 30 BCM.
request letter was sent to all the State Governments and various Institutions involved in the water resources research field to send us the feedback of various researches on Evaporation Control. However, all the responses received, indicate that no new researches have been conducted by the State Govts or Central / State agencies. The earlier publication contained the monthly and annual evaporation maps of the country. In this regard, IMD was also approached so that the updated evaporation maps could be included in this publication. Asstt Meteorologist, IMD Pune also informed that the evaporation maps were last published in 1991. There is no difference in the evaporation maps in the earlier publication and the photocopies of the maps supplied by IMD.
The internet was also browsed to search the information on any new researches or identification of any new technology / chemicals to retard the evaporation rate. The search on internet, resulted in finding some case studies done in this field in other countries, however, the chemicals / technology used is the same as covered in the earlier publication. Some websites are from the manufacturers of WER chemicals such as Hexadecanol or Octadecanol or Acilol claiming to have conducted experiments in other countries towards evaporation control.
2.0
ASSESSMENT OF EVAPORATION LOSSES IN INDIA
As per available records, assessment of evaporation losses in the country was first made by L.A. Ramdas and presented in Symposium of Evaporation control in 1966. The assessment was based on the following assumptions:
Area of arid, Semi arid
and long dry spell regions of India 2,000,000 Sq.Km..
Estimated water area in this region(1%) 20,000 Sq.Km..
Estimated area where film
application may be feasible 2,000 Sq.Km..
The evaporation loss from the above area 6,000 MCM
The National Commission on Agriculture (1976) had estimated that the annual evaporation losses from reservoir surfaces will be of the order of 50,000 MCM.
Central Water Commission in their publication “Status Report on Evaporation Control in Reservoirs, 1988” had indicated that on an average there is a loss of about 450 MCM of water every month from an area of 2,000 Sq.Km.. which amounts to an annual loss of 5,400 MCM.
The Water Management Forum (WMF), a national body of the Institution of Engineers (India), in their publication “Water Conservation by Evaporation Control, 1988” had indicated that on the Indian sub-continent the estimate total loss of water from large, medium and small storages will be to the tune of 60,000 MCM, which according to WMF would be adequate to meet the entire municipal and rural water needs of India by 2000 AD.
The assessment of evaporation losses had been reviewed by CWC in 1990. Average annual evaporation from reservoirs/water bodies in India varies from 150 cm to 300 cm. The total surface area of existing large and medium storages, tanks and lakes in the country is of the order of 12,000 Sq.Km.. This is likely to increase to about 25,000 Sq.Km. at the ultimate stage of development. Assuming annual evaporation loss rate of 225 cm, the evaporation loss from existing water bodies works out to 27,000 MCM. In the ultimate stage, the evaporation losses may be of the order of 56,000 MCM. Thus, likely evaporation losses appear to be high, considering capital costs involved in creation of storages.
3.0
FACTORS AFFECTING EVAPORATION
Evaporation is a process by which a liquid changes into vapour form. Water molecules are in constant motion and some have the energy to break through water surface and escape into air as vapour. Evaporation in general is a beneficial phenomenon in regulating global water balance through the hydrological cycle and it is the same phenomenon contributing to massive losses from water bodies. Control of evaporation from land based water bodies, has thus remained one of the main planks of water conservation strategies. This assumes greater significance in arid regions, where water scarcities are already a common problem.
A number of factors affect the evaporation of water from open water surface, of which the major are:
3.1
Water Surface Area
Evaporation is a surface phenomenon and the quantity lost through evaporation from water stored, therefore, depends directly on the extent of its surface exposed to the atmosphere.
3.2
Temperature
The temperature of water and the air above it affect the rate of evaporation. The rate of emission of molecules from liquid water is a function of temperature. The higher the temperature, greater is the rate of evaporation.
3.3
Vapour Pressure Difference
The rate at which molecules leave the surface depends on the vapour pressure of the liquid. Similarly, the rate at which molecules enter the water depends on the vapour pressure of the air. The rate of evaporation therefore depends on the difference between saturation vapour pressure at the water temperature and at the dew point of the air. Higher the difference, more the evaporation.
3.4
Wind Effect
escaping from the water surface will collide with an air molecule and rebound into the liquid. Hence evaporation is likely to decrease with increasing pressure.
3.6
Quality of Water
4.0
METHODS OF DETERMINING EVAPORATION
Evaporation can be determined by several methods. The following methods and their modifications are generally used by different scientists:
i) The Water Budget or Storage Equation ii) Measurement in an Auxiliary Pan
iii) The Evaporation Formulae or the Empirical Formulae
iv) Mass Transfer Method or the Humidity and Wind Velocity Gradient Method
v)
Energy Budget Method or Insolation Method4.1
Water Budget / Storage Equation Method
In this method the evaporation is determined by the equation :
E = P+I-O+U+S, where, E = evaporation
P = precipitation on the water surface I = surface inflow
O = surface outflow
U = underground inflow or outflow and S = change in storage.
S is (-)ve for any increase and (+)ve for any decrease in storage. The quantities are usually expressed as millimeter depth in the water area for some convenient time interval.
Fig- 4.1 Seepage Meter developed by Irrigation Research Institute, Poondi
The top pan is covered by a lid to prevent loss of water due to evaporation and water is poured into it to the same level as that in the tank on the outside of it. The loss of water level in the top pan indicates directly the loss of water due to seepage from the tank bed. It has been reported that consistent values could not be obtained.
Fig- 4.2 Seepage Meter developed by Irrigation Research Institute, Roorkee
4.2
Measurement in an Auxiliary Pan
Kohler and others had calculated evaporation from lakes by converting measured evaporation from pans to lake evaporation by applying a coefficient. Bleney had studied the effects of high altitude on evaporation from pans and determined suitable coefficient. Studies by Bigelow had shown that the location of pans relative to the water of a reservoir has significant effect on the calculated evaporation. He concluded that evaporation from natural lakes or reservoirs is about five-eighth as fast from an isolated pan placed outside the vapour blanket. Further studies by Rohwer, Kohler, and Mansfield showed that the evaporation coefficient ranges anywhere between 0.2 to 1.5 and this factor is dependent upon size, depth and location. With this kind of evaporation measurement, it is essential that the coefficient of evaporation be measured under all different conditions, which is not practically feasible in large water storage systems.
The present practice is to estimate evaporation loss from land pan evaporimeter. In the studies being done at IHH, Poondi a floating evaporimeter is used for the experiments. A floating evaporimeter made of GI sheet was initially used. Later on it was found that the stored energy inside the water body has a significant effect on the evaporation loss. To have this effect truly reflected, IHH found it necessary to have a suitable material for manufacturing floating evaporimeter. An ideal material to achieve this objective should perhaps be the one which will have a thermal conductivity equivalent to that of water, but at the same time non-leaky. With this in mind, a study of the thermal conductivity of some materials was made. Thermal conductivity of water is 0.556 W/m oC. It is 0.75 for iron, 0.60 for brick, 0.78 for window glass, 0.1 for concrete and 0.02 for plastics. It shows that plastics and concrete have low values and the metals have high values. Ideally brick or glass should be made use of for making floating evaporimeter. But the brick is heavy and leaky and the glass is brittle. Hence a new material, Perspex sheet, which is akin to glass but at the same time non-brittle and workable, was chosen as an alternative material for the fabrication of floating evaporimeter installed at Poondi reservoir.
Fig- 4.3 Floating Pan arrangement developed by Institute of Hydraulics and Hydrology (IHH), Poondi.
Since the Meteorological factors affecting hydrological processes including evaporation vary over the year, IHH plans to obtain data for a few years for deriving reliable results for possible use in reservoir analysis problems.
Pw=vapour pressure in the film of air next to water surface Pa= vapour pressure in the air above the film; and
C= coefficient dependent upon barometric pressure, wind velocity and other variables
Many other scientists have proposed different modifications of this evaporation equation by taking into account various related factors. Fitzgerald modified the Dalton’s equation by taking into account the effect of wind velocity on evaporation. Carpenter subsequently further modified the Fitzgerald equation by taking modified coefficient factor for wind velocity and his equation was found applicable to the conditions in western United States. Research scientists, Boelter Hickox, Thomas and Ferguson have later significantly contributed in the development of evaporation equations and removal of doubts and confusion of terms adopted by different authors.
However, as can be seen from the equation, some parameters like temperature conditions, wind velocity etc. have not been separately considered, but their effect is lumped in the form of coefficient C.
In India S.P. Ghosh and S.K. Sarkar, River Research Institute, West Bengal had made attempts to develop equations, correlating evaporation with meteorological factors like temperature, degree of saturation of water vapour, wind velocity and atmospheric pressure. The following equation for calculation of Pan-evaporation from meteorological factors as suggested by them is:
E= (1.3684-0.0189B) (0.41+0.136W) (es-ed), where E= daily evaporation in inches
B= mean barometric pressure in inches of mercury, W=mean velocity of ground wind in miles per hour,
es= Mean vapour pressure of saturated air at the temperature of water surface in inches of mercury.
ed= mean vapour pressure actually present in the air in inches of mercury.
The pan evaporation as calculated can be converted into reservoir evaporation by multiplying with standard pan coefficient. The accepted standard coefficient for 1.22m (4’) dia US Class A land pan is 0.70.
i) free water surface:
E= (0.1184+0.0025 W) (es-ea)
ii) with the application of Hexadecanol: E= (0.0014 + 0.044W) (es-ea)
iii) with the application of Octadecanol: E= (0.0039 + 0.0057 W) (es-ea).
where E is evaporation rate in mm per hour, W is wind velocity in km per hour, es and ea are the saturation and actual vapour pressure respectively in millibars. The values of vapour pressure deficit (es-ea) have been calculated by the following relationship:
(es-ea) = 0.644 (Td-Tw), where Td and Tw are the dry bulb and wet bulb temperatures ( oC) respectively.
4.4
Mass Transfer or Humidity and Wind Velocity Gradient Method
As the name suggests two important factors (i) humidity and (ii) wind velocity form the basis of calculating the evaporation. The basic assumptions involved in this method are:
i) If the moisture gradient exists in air, water vapours will move towards points of lower moisture content.
ii) The rate of movement of water vapour is accentuated by the intensity of turbulence in the air.
The method is applicable to both land and water surfaces. However, relatively expensive and highly sensitive hygrometers and wind velocity meters are required to measure the corresponding factors simultaneously at two different elevations above the ground.
4.5
Energy Budget / Insolation Method
5.0
MONTHLY AND ANNUAL EVAPORATION
Evaporation data were published by India Meteorological Department in 1970. The publication entitled “Evaporation data (India)” contains evaporation data of 30 departmental observatories for the period 1959 to 1968 and 42 agro-meteorological observatories for the period 1961 to 1968.
The number of agro-meteorological observatories have now been considerably increased. The network IMD Evaporimeter stations existing in India is shown in Figure 5.1. With the availability of evaporation data of large number of stations, L.S. Rathore and B.C.Biswas of the Division of Agricultural Meteorology, Pune had prepared climatological maps based on the evaporation data of 176 observatories. Apart from data input from a large number of observatories, these maps are based on fairly long period of evaporation data of periods varying from 12-16 years. The basic data used are daily evaporation of 24 hours observed at 08.30 hrs. The monthly and annual evaporation isohyets are shown in Figures 5.2 to 5.14 at the end of this chapter.
As can be seen from the evaporation maps, the annual evaporation varies from as low as 50-75 cm over parts of Himalayan regions to as high as 325 cm over West Rajasthan and Jalgaon-Akola region. The region east of 87o E longitude, including parts of West Bengal and entire NE India, register evaporation is 175 cm. The evaporation values for West coast, south of 20o N latitude is about 150 cm, which is lower than the evaporation over the east coast. Over most of the east coast, the evaporation is 175 cm. However, the southern coast in Tamil Nadu registers comparatively very high evaporation. Annual evaporation of the order of 300 cm, though over a small portion, is also seen.
Saurashtra is another area where evaporation is fairly high (275-300 cm). The Deccan Plateau also exhibits high evaporation values ranging between 250-325 cm. Evaporation over the Himalayan region and its foot is low (60-150 cm).
6.0
METHODS TO REDUCE EVAPORATION
Although evaporation losses in the country are quite substantial, the evaporation retardant methods perhaps cannot be employed to all open surface water bodies, irrespective of their size and shape. In view of this, water conservation management by control of evaporation has so far been limited generally to drought prone and scarcity areas under specified wind speed and temperature conditions of the water bodies.
The methods of evaporation control can be grouped under two broad categories :
(i) Short term measures and (ii) Long term measures.
A number of approaches have either been applied or considered by Engineers and Scientists in their attempt to reduce evaporation losses from surface of water bodies. Since the basic meteorological factors affecting evaporation cannot be controlled under normal conditions, efforts have so far been restricted to managing the suppression or inhibition of evaporation from water surfaces by physical or chemical means. The methods generally used or being tried are broadly listed below:
i) wind breakers
ii) covering the water surface
iii) reduction of exposed water surface iv) underground storage of water v) integrated operation of reservoirs
vi) treatment with chemical Water Evapo Retardants (WER).
6.1
Wind Breakers
Wind is one of the most important factors which affect rate of evaporation loss from water surface. The greater the movement of air over the water surface, greater is the evaporation loss. Planting of trees normal to windward direction is found to be an effective measure for checking of evaporation loss. Plants (trees, shrubs or grass) should be grown around the rim of tanks in a row or rows to act as wind breaker. These wind breakers are found to influence the temperature, atmospheric humidity, soil moisture, evaporation and transpiration of the area protected.
In general, the following spacings are recommended:
a) Shrubs 0.60 to 1.00 m b) Medium height broad leaved trees 1.50 to 2.00 m c) Medium to tall evergreen trees 2.10 to 2.40 m d) Tall broad leaved trees with conical crown 2.40 to 3.00 m
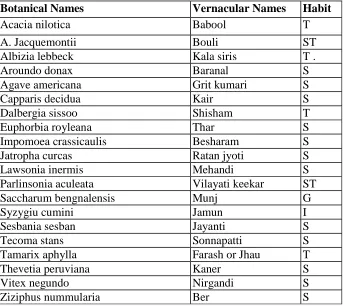
TABLE 6.1 Recommended Tree, Shrub And Grass Species For Different Regions Of India
Northern Region (plains of Punjab, Haryana, UP, Delhi and parts of Gujarat and M.P.)
Botanical Names Vernacular Names Habit
Acacia nilotica Babool T
A. Jacquemontii Bouli ST
Albizia lebbeck Kala siris T .
Aroundo donax Baranal S
Agave americana Grit kumari S
Capparis decidua Kair S
Dalbergia sissoo Shisham T
Euphorbia royleana Thar S
Impomoea crassicaulis Besharam S Jatropha curcas Ratan jyoti S
Lawsonia inermis Mehandi S
Parlinsonia aculeata Vilayati keekar ST Saccharum bengnalensis Munj G
Syzygiu cumini Jamun I
Sesbania sesban Jayanti S
Tecoma stans Sonnapatti S
Tamarix aphylla Farash or Jhau T
Thevetia peruviana Kaner S
Vitex negundo Nirgandi S
Ziziphus nummularia Ber S
Central Region (Parts of Gujarat, MP, Andhra Pradesh and Maharashtra)
Acacia nilotica Babool T
A. Catechu Khair T
Agave sislana Grit kumari S
Boswellia serrata Salai T
Cassia siamea Siamea T
Dalbergia latifolia Sitsal T
Gliricida maculata Madre ST
Hardwickia binata Anjan T
Jatropha curcas Ratan jyoti S Leucaena leucocephola Ipil-ipil ST Melia azadirachta Bakain T Pithecellobium dulcis Jangal jalebi ST
Pongamia pinnata Karanj T
Ricinus communis Arand ST
Sesbania grandiflora Basna ST
Southern Region (Chennai, parts of Andhra Pradesh, Mysore and Kerala)
Acacia nilotica Babool T
A. Auriculiformis Wattle T A. Decurrens Blackwattle T
Agave sp. Grit kumari S
Anacardium occidentale Kolamavu T
Albizia lebbeck Magei T
Bambusa sp. Mungli G
Borassus flabellifer Panei T Casuarina equisitifolia Chauku T Erythrina spp. Mulu moduyu T Eucalyptus spp. Eucalyptus T
Gliricida maculata — ST
Grevillea robusta Silveroak ST Jatropha curcas Nepalam S
Pueraria javanica — S
Sesbania sesban Chittikatti S
S. Bispinosa Jayanti S
Eastern Region (W. Bengal, Assam, Orissa and Bihar) (a) inland areas
Acacia catechu Khair T
Agave sislana Kantala S
Anacardium occidentale Kaju T Artoarphus heterophyllus Kathal T
Arundo donax Gaba nal S
Bambusa sp. Bans G
Borassus flabellifer Tal T Casuarina equisetifolia Janguli saru T
Cocos-nucifera Narial T
Dalbergia sissoo Shisham T
Imperata cylindrica Ulu G
Lannea caromandelica Jhingal T
Musa paradisiaca Kela ST
Syzygium cumini Jamun ST
Tephrosia candida Lashtia S
Vitex negundo Nirgandi S
(b) Coastal areas
Acacia auricuiformes Sonejhur T Anacardium occidentale Kaju T Borassus flabellifer Tar T Casuarina equisitifolia Janglisaru T .
Cocos nucifera Narial T
Delonix elata Gulmohar T
Erythrina indica Polita mandas T Buphurbia tirucalli Sehund S
Bicus spp. Gad gubar T
Indiqofera aspalathoides Sivanimba S
Ipomoea biloba Natilata T
Pongamia pinnata Karanj T
Prosopis juliflora Vilayati babool T Inifex littorcus Rawn moonch G
Tamarix aphyila Farash T
Arid-Region
(Western Rajasthan, Part of Andhra Pradesh and Mysore)
Acacia nilotica Babool T
A. Leucophloea Reonja T
A. Planifrons Godugh thumba T
A. Senegal Kummet T
A. Tortilis Israeli babool T Balanites aegyptiaca Hingot S'T Calligonurn polygonoides Phog S
Capparis decidua Kair S
Clerodendrum phlomoides Arni S
Saccharum munja Munj G
Eucalyptus camaldulensis Eucalyptus T Euphoribia caducifolia Thor S
Lasiurus sindicus Sewan G
Panicum turgidum Murat G
Tamarix aphyilla Farash T
Zizyphus numrnularia Jharber S T = Tree, ST = Small Tree, S = Shrub, G = Grass
Source : Technical Bulletin (AGRIC) No. 22, ICAR, New Delhi (1969) by J.K. Ganguly and R.N. Kaul.
Some scientists had also advocated use of synthetic polytrees and poly shrubs in place of vegetative trees, keeping in view the vast availability and economy of this product in the country. According to them these synthetic plants can be raised as barriers against the hazardous wind in minimum possible time, particularly in arid areas, where it is otherwise difficult to grow vegetation. However, no experimental data to substantiate the effectiveness of these synthetic plants and its economy in conservation of water is available.
Fixed covers are suitable only for relatively small storages. For large storages, floating covers or mat or spheres may be useful and effective. However, for large water surfaces the cost of covering the surface with floats is prohibitive. Further in case of reservoirs with flood outlets, there is also the danger of floats being lost over spillway or through outlets. The floating covers are thus of limited utility to larger water bodies.
Genet and Rohner had reported that floating spheres of a polystyrol reduced evaporation to 80% in small experimental tanks. The white spheres have the added advantage of reflecting solar energy and thus influencing evaporation.
Department of Soil and Water Conservation Engineering, College of Technology and Agriculture Engineering, Rajasthan Agriculture University has done experiments with other floating bodies as vegetable oils, wax, wheat husk, paddy husk, wooden blocks, saw dust and thermocol boards. According to these studies, conducted for a limited period of 15 days, the most effective evapo-retardant is mustard oil, which resulted in 46% saving in water. The next in the order of effectiveness was found to be thermocol, followed by wax, Paddy straw, wheat straw, saw dust and wooden blocks were found to have less effect on reducing the evaporation. However, mass scale and economic use of these materials were not recommended, till conclusive results providing their economics and utility are available, based on some more experiments under varying conditions and on varying sizes of water bodies.
6.3
Reduction of Exposed Water Surface
In this method shallow portions of the reservoirs are isolated or curtailed by construction of dykes or bunds at suitable locations. Water accumulated during the monsoon season in such shallow portions is diverted or pumped to appropriate deeper pocket in summer months, so that the shallow water surface area exposed to evaporation is effectively reduced. This method is one of the recognized methods of conservation in drought areas and has been successfully tried for lake Worth in Texas, USA. In India, this method has been tried for Nayka reservoir, supplying water to Surendranagar in Gujarat, which yielded good results. The compartmentalisation work in the lakes supplying water to Chennai city has indicated that this method is more economical and effective than chemical WER method.
6.4
Underground Storage
recharge of the aquifer adjoining Talaji rivulet near the town of Talaja in Bhavnagar District of Gujarat where significant water level rise was registered, after the limited monsoon. The main advantage of this method is that loss of valuable lands and forest areas due to surface submergence can be altogether avoided. The method has a great future all over India in view of the environmental advantage.
6.5
Integrated Operation of Reservoirs
This method is suitable for a system of reservoirs which can be operated in an integrated way. The method consists of operating the reservoirs in such a way that total exposed water surface area is kept minimum for the system as a whole. Consequently evaporation loss gets minimized. For achieving this objective water use should be planned in such a way that shallow reservoirs with large water spread area are depleted first. This method has been successfully practiced by Mumbai Municipal Corporation in their water supply scheme. Such techniques were also tried in the Hiran dam 1 & 2 in Junagarh district of Saurashtra region of Gujarat. The Chennai Metropolitan Water Supply and Sewerage Board has also been practicing integrated operation of Red Hills, Cholavaram and Poondi reservoirs, which supply water to Chennai City, so that the exposed water surface is kept minimum.
6.6
Treatment with Chemical Water Evapo-Retarders (WER)
Chemicals capable of forming a thin mono-molecular film have been found to be effective for reducing evaporation loss from water surface. The film so formed reflects energy inputs from atmosphere, as a result of which evaporation loss is reduced. The film allows enough passage of air through it and hence, aquatic life is not affected. The film developed by using fatty alcohols of different grades has been found most useful for control of evaporation. These materials form a film of mono-molecular layer when applied on water surface which works as a barrier between water body and the atmospheric conditions. These fatty alcohols used for evaporation control are generally termed as chemical water evapo-retardants (WERs) and these are available in the form of powder, solution or emulsion.
These chemical water evapo-retardants have the disadvantage of high cost of application. However, when adopted in scarcity period, drought, etc. the quantity of water saved by this method would work out cheaper than alternate means of bringing water from far off places by manual or mechanical transport. The economics of WERs application may however vary from site to site depending on local factors. The chemical water evapo-retardants have another limitation of the mono-layer breaking at high wind velocities. Following chemicals are generally used for water evaporation retardation:
6.7
Short Term Measures
Short-term measures are employed in the drought and scarcity conditions especially for crisis management. Since these are cost prohibitive, the use of chemical retardants can be restricted to crisis management to tide over the periodic and acute shortages of water when even drinking water may not be adequately available. This method, however, is not cost effective for mass scale use. This method is also not suitable under following conditions :
(i) When the wind velocities are more than 10-16 km/hr.
(ii) When the temperature rises above 40-42o C.
(iii) The size of reservoir/ water body is relatively large.
Fatty alcohols can be used for the purpose having following properties :
(i) The chemical selected should have cohesive property which can maintain the monolayer on the surface of the body irrespective of the effect of wind. Even if the layer is broken due to occasional high wind velocities, the material should have the property of reuniting and forming the layer.
(ii) The chemical selected for use should have no effect on the quality of water , especially no toxic effect on aquatic and human life.
(iii) The chemical should also be such that the film should allow enough passage of air through it so that the aquatic life is not affected.
6.7.1 Merits of Chemical WERs
Use of evaporation control techniques requires a small capital investment. Locally constructed rafts can be used in its application, and skilled labour is not required, except for operation of motorized boats. Fatty alcohols cause no hazards in handling, and are inflammable, non-toxic, and non-irritating. There perhaps may be no known harmful effects, making this technology safe for application on drinking water lakes and reservoirs. There are also no known ecological ramifications, as the alcohols contain straight chain carbon compounds, which are biodegradable and permeable to oxygen.
6.7.2 Demerits of Chemical WERs
a more effective manner. Floating covers constructed of low density (110-130 kg/m3) closed cell synthetic rubber sheeting (EFDM) can also be used. The covers can be fabricated from 6.4 mm thick sheeting bonded together with contact adhesive. The life of such covers may be around 8 years, if the material and methodology as adopted by Dean (1930) and Dedrick (1976) is used. The size of covers should be slightly larger to accommodate shrinkage. These methods can be used to cover water storage tanks. The other floating materials tried are wheat husk, paddy husk, wooden blocks, thermocol boards etc. Thermocol board has been found to be more effective than straw, dust and wooden blocks. However, mass scale use of these materials is not recommended till results providing their economic and utility are available.
6.8
Long Term Measures
Although some long-term measures like wind breakers, reduction of exposed water surface, storing water in underground storages etc. have been employed in some or the other parts of the country, their economics and long term utility effectiveness have yet to be established. Nevertheless, these methods are in use and continue to be employed reportedly with some success.
Reduction of exposed water surface: This method is useful if some shallow portions in
reservoirs are available, which can be isolated by constructing dykes and water diverted or pumped to the deeper pockets so that the exposed surface is effectively reduced. This is a recognized method of evaporation control for water conservation management in drought areas. The reduction in exposed water surface can also be achieved with integrated operation of reservoirs. In this case the reduction is achieved by storage management in reservoirs, so that shallow reservoirs are utilized first and deeper reservoirs later.
Underground storages of water: The water can be stored underground in cavities and aquifers,
where available, which do not entail higher lateral dispersion losses. This method has the advantage of saving valuable lands on the ground, since there is no surface submergence involved. However, areas where this method can be employed will need to be identified by geological investigations prior to resorting to this method. The advantage of this method is that the surface water can be used as and when required. However, the disadvantage is that the water needs to be pumped for use, which entails additional pumping costs and energy consumption. This method may therefore be suitable only when the economics of valuable land saved compares well with additional expenditure on pumping and energy is generally available.
Wind breakers: This method can also be employed only in small reservoirs/ water bodies. In
Shrubs 0.60 m to 1.00 m Medium height broad leaved trees 1.50 m to 2.00 m Medium to tall evergreen trees 2.10 m to 2.40 m Conical crown 2.40 m to 3.00 m
7.0
CASE STUDIES OF EVAPORATION RETARDATION–
MEASURES IN INDIA
7.1
Chemical Water Evaporation Retarders (WER)
Experiments using various chemical Water Evapo Retardants (WER) were in practice all over the world from the year 1957 onwards. A review of these studies shows a variation of percentage of savings in evaporation loss from as low as 8% for a long duration study to as high as 64% for short duration period (Table 7.1).
In India also, many leading research stations and State Govt. agencies were engaged in conducting laboratory and field experiments in controlling evaporation from water bodies. The agencies which have contributed significantly in experimentation of evaporation control and the salient features of the work carried out by them are enumerated in the following paragraphs and also abstracted in Table 7.13
7.1.1 Irrigation Development Division, Mumbai
This Division is one of the first few premier organizations in India to carry out investigations during end of 1957 with Cetyl alcohol. The experiments were carried out in Kasurdi Tank (capacity 0.42 MCM) and Bhandgaon Tank (capacity 0.32 MCM) both situated near Pune. Cetyl alcohol was used for evaporation suppression studies and was dispensed on water surface in a powder form by a hand-operated duster, mounted on a boat. A quantity of 0.91 kg of Cetyl alcohol was spread in four rows in each of the two tanks covering the entire area of the tanks. The following data were collected during the field experiments:
i) water level of the tank ii) inflow into the tank
iii) outflow by way of seepage and for irrigation
iv) evaporation with and without Cetyl alcohol from pan evaporimeter of 3m dia kept by the side of the tank and
v) wind velocity, air and water temperature in different periods of the day.
TABLE 7.1 : Evaporation retardation work carried out in foreign countries
SI. No Location Organisation Duration of the work
Chemical used % Saving in evaporation
Reference/ Publication Basis for results
1. Lake Hefner, Oklahoma City, USA Reported by NEERI, Nagpur 1958 (Summer) Hexadecanol (emulsion form)
9 Evaporation control as a measure of
conservation of water by S.R. Kshirsagar, presented at the 15th Annual convention of IWWA.
Results computed on the basis of energy balance approach combined with mass transfer theory.
2. Field trials in . 274 cm diameter outdoor steel tanks, USA.
ASCE, USA March 63 Alkanol 30 Stable Alkanol Dispersion to reduce evaporation by Gary W. Frasier et al, Jrnl. of Irrigation and Drainage Division, ASCE, March, 1968.
Tank data (1% alkanol concentration)
3. — do— — do— March 64 (7 days)
— do— 64 — do— — do—
4. —do— — do— Sep. 66 (30 days)
Alkanol dispersion
26 —do— — do— (3% alkanol
concentration)
5. —do— — do— Feb. 67 (7 days)
— do— 28 — do— Tank data (1% alkanol
7. — do— — do— March 67 (10 days)
Powdered alkanol
15 —do- —do—
8. Boulder Basin in Lake Mead, USA
USBE Denver, USA
June to Sept. (4 months) year not known
Ethoxylated Alcohols and Linear Alcohols.
8-20 Evaluation by the bureau of
Reclamation's
Evaporation Reduction Research Program by Darid C. Bomberger & Paul V. Roberts, A revision of final report - March 1970 Revised October 1980.
Wind speeds used in the calculation exceeded 9 MPH in 50% of the time.
9. —do- —do- All year application
—do— 18-41 —do- Wind speeds exceeded
7.1.2 Central Soil & Materials Research Station, New Delhi
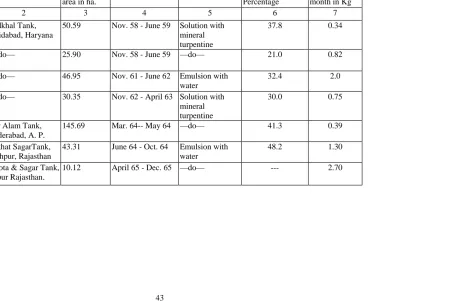
This Research Station, earlier known as Central Soil Mechanics and Concrete Research Station had conducted studies with chemical WER for a period about eight years from 1958 to 1966 on Badkhal Tank, Haryana; Takhat Sagar Maota and Sagar tanks, Rajasthan and Mir Alam tank, A.P. The chemicals used were mostly Cetyl or Cetyl Stearyl alcohol and were dispense in the solution or emulsion form. As a trial, powder form of WER was also used. Mineral turpentine as a solvent and indicator oils having film pressure in the range of 11 to 40 dyne/cm were used. A film pressure of 24 dyne/cm is reported to have been maintained at these sites. Meteorological observations like temperature, wind direction, wind velocity were regularly observed during the studies. A contour survey of the tanks was also undertaken to know the quantity of stored water. Besides, gauges were fixed in different parts of the tank to record water level. Pan evaporimeters were also installed at the site.
TABLE 7.2 Studies conducted by Central Soil and Materials Research Station, New Delhi S. No Name of Reservoir Average
water spread area in ha.
Period of study Method of Application
Evaporation Reduction Percentage
Retardant used per ha. per month in Kg
1 2 3 4 5 6 7
1. Badkhal Tank, Faridabad, Haryana
50.59 Nov. 58 - June 59 Solution with mineral turpentine
37.8 0.34
2. — do— 25.90 Nov. 58 - June 59 —do— 21.0 0.82
3. — do— 46.95 Nov. 61 - June 62 Emulsion with water
32.4 2.0
4. — do— 30.35 Nov. 62 - April 63 Solution with mineral turpentine
30.0 0.75
5. Mir Alam Tank, Hyderabad, A. P.
145.69 Mar. 64-- May 64 —do— 41.3 0.39
6. Takhat SagarTank, Jodhpur, Rajasthan
43.31 June 64 - Oct. 64 Emulsion with water
48.2 1.30
7- Maota & Sagar Tank, Jaipur Rajasthan.
The inference drawn from these studies were as under:-
i) evaporation reduction achieved was in the range of 21 to 48%
ii) an effective film pressure of 24 dyne/cm can be achieved at a lower cost in the solution form as compared to emulsion form.
iii) Cetyl Stearyl alcohol is harmless to aquatic and plant life.
7.1.3 Institute of Hydraulics and Hydrology, Poondi, Chennai
The studies on evaporation control with chemical WER were conducted from 1959 to 1965 in Buderi tank situated near the institute. The tank had a water spread area of about 11.34 ha and depth of 3.66 metres. There were no withdrawals from this tank for irrigation or for other purposes. The inflows into the tank were only from monsoon rains. Regular meteorological observations and pan evaporimeters studies were conducted at the location of study. Cetyl Stearyl alcohol was used for the study. Cetyl Stearyl alcohol was applied on water surface at the rate of 0.05 kg to 0.25 kg in the form of solution and emulsion and at the rate of 0.36 kg in the powder form. Applications were made during the daylight hours for short periods ranging from 7 to 10 days.
Film pressure was tested by indicator oils of standard strength. It was maintained at 40 dyne/cm, which is the equilibrium value at which the film was found to offer maximum resistance to the escape of water molecules.
The inference drawn on the basis of the study were:
i) From economic considerations and facility of operation, application in the form of emulsion appeared to be the best, under local conditions.
ii) Layer is found to break due to wind velocity above 8-16 km per hour and also due the presence of bacteria and protein in water.
iii) The efficiency of the layer decreases with increase in temperature iv) The saving in water was to the tune of 20%
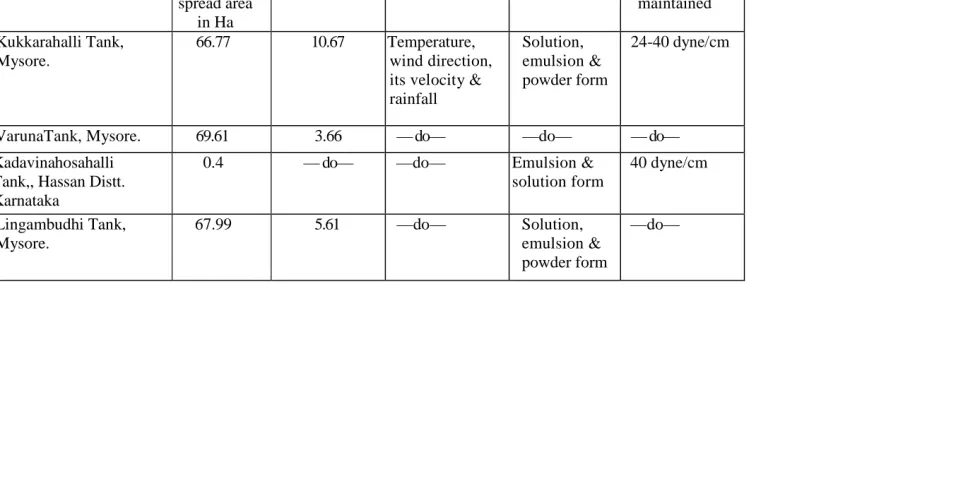
7.1.4 Karnataka Engineering Research Station, Krishnaraja Sagar
TABLE 7.3 Details of Studies Conducted by Karnataka Engineering Research Station, Krishnaraja Sagar S. No Name of Reservoir Average
water spread area
in Ha
Maximum depth in m
Meteorological observations
Method of application
Surface film pressure maintained
1. Kukkarahalli Tank, Mysore.
66.77 10.67 Temperature, wind direction, its velocity & rainfall
Solution, emulsion & powder form
24-40 dyne/cm
2. VarunaTank, Mysore. 69.61 3.66 — do— —do— — do—
3. Kadavinahosahalli Tank,, Hassan Distt. Karnataka
0.4 — do— —do— Emulsion &
solution form
40 dyne/cm
4. Lingambudhi Tank, Mysore.
67.99 5.61 —do— Solution,
emulsion & powder form
a) Kukkarahalli Tank : This tank had a limited catchment and the main source of
water supply to the tank was from a feeder channel and had two draw-off points. Cetyl alcohol was mainly used as evaporation retardant. Water level recording was done by means of Hook-Gauge. Contour survey was done as and when the water level got depleted. Seepage meters were also used to measure seepage losses. Cetyl alcohol in the solution form was dispensed either by the shore dispenser or by raft dispenser. Semi-field studies using pan evaporimeters were also done. The studies indicated saving in evaporation loss varying from 5.7 to 24%.
b) Varuna Tank: The methodology adopted for studies in this tank is similar to the
methodology adopted for Kukkarahalli Tank. Semi-field studies using CS pan evaporimeter deploying all the 3 methods (emulsion, solution and powder form) at various film pressure were undertaken. It was observed that an appreciable savings could be achieved by an increase in surface film pressure using solution and emulsion techniques. The saving in water achieved was found to be varying from 8.9 to 36.91%.
c) Kadavinahosahalli Tank: The studies done in this tank are similar to
Kukkarhalli Tank. Cetyl alcohol was spread both in emulsion and solution form. It was observed that the factors such as concentration of the retardant, temperature, rate of spreading and rate of evaporation have an important role to play in maintaining the optimum surface pressure of 40 dyne/cm. Emulsion technique was found to be more economical than the solution technique.
d)
Lingambudhi Tank : Field and semi-field studies using all the three techniquesare reported to have been conducted. Studies on correlation of evaporation observed in different evaporimeters namely Piche Evaporimeters, CS Pan, USWB Land Pan and two floating pans have also been reported. The percentage of saving in evaporation loss varied from 8.50 to 35.24%.
The inferences drawn from the study were:-
i) The quantity of chemical required to maintain a surface pressure of 40 dyne/cm would be much more than to maintain 16 dyne/cm, but the cost of additional chemical is offset by the increase in the quantity of water saved. ii) Percentage saving is nearly the same at 40 dyne/cm by either of the techniques
namely solution or emulsion.
7.1.5 Central Public Health Engineering Institute, Nagpur
This Institute had conducted studies on three lakes namely Walwhan, Vihar and Gorawara as per suggestions from Australian experts and guidance from C.S.I.R. in the mid-sixties. The Walwhan Lake had a water spread area of 0.22 Sq.Km.. at FRL Meteorological data such as maximum and minimum temperature, wind direction, wind velocity, rainfall were reported to have been recorded daily at fixed interval of time. Besides, gauges were fixed in different parts of the tank.
Cetyl alcohol as evaporation retardant and indicator oils from M/s Shell Company having surface pressure in the range of 16-40 dyne/cm were used. While the Cetyl alcohol was dispensed in the form of emulsion in the Walwhan and Vihar lakes, powder technique was used in the Gorawara Tank. The powder was dispensed by means of a duster fitted on the boat.
The inflow and outflow characteristics of the lakes were regularly recorded by measuring the water level differences.
Inferences drawn from the studies are given below:
i) The chemical required ranged between 0.02 to 0.05 kg/hectare/day to maintain the film pressure of 21 dyne/cm in Walwhan and Vihar lakes, while in Gorawara tank it was 0.05 kg/hectare/day.
ii) The evaporation saving ranged from 3.7 to 17.8% for the period of study in Walwhan Lake, 0.25 to 20% in Vihar lake and 8-16% in Gorawara Tank.
7.1.6 Central Salt and Marine Chemicals Research Institute, Gujarat
This Institute conducted evaporation control studies using Cetyl Stearyl alcohol in sixties at Khodiyar lake, Bhavnagar. The Khodiyar Lake has a maximum water spread area of 1.90 ha and storage capacity of 6.3 MCM. Both the powder and emulsion techniques were used. The data were collected for a period of 2 to 5 years. The film pressure was maintained at less than 24 dyne/cm. Its presence was detected by the absence of any movement of particles of antipyrine and camphor when dusted on the water surface and also with the help of indicator oils. The record of weather data were also maintained during the study. Studies by the institute showed lake evaporation (E) to be 0.65 times the standards pan evaporation (Es).
TABLE 7.4 : Studies Conducted By Central Salt And Marine Chemical Research Institute, Bhavnagar At Khodiyar Lake
Method of application
Evaporation Data (mm per day) (Average of the months) Months Penman's
Aerodynamic formula
Penman's Sink- strength formula
Rowher's formula
Standard pan Evaporation
Es
Lake Evaporation
0.65 x Es
Actual observed Evaporation
Percentage saving
Aqueous Suspension
Dec. '62 3.5 5.1 5.5 11.7 7.6 6 20.0
Jan. 63 6 6.2 6.4 10.4 6.8 5 23.0
Feb. 63 4 10.5 10.7 13 8.2 6.4 24.2
Mar. 63 11.3 20.4 21.6 11.5 7.4 6.1 17.4
Apr. 63 6.2 14.6 13.2 13 8.4 6.8 18.2
May 63 6 21.4 20.5 17.4 11.3 9.6 13.6
June 63 6.3 20.4 18.5 18.5 12 10.6 10.6
No treatment period
Dec. 63 2.7 3 2.9 -- -- -- --
Jan. 64 3 10.4 10.7 5.3 3.4 -- --
Powder technique
Feb. 64 3.1 4.6 4.5 7.8 5 3.3 35.0
Mar. 64 9.7 16.7 16.6 10.9 7.1 4.8 32.2
Apr 64 8.9 22.6 23 14.7 9.5 6.8 27.1
May 64 7.4 28.4 27.2 13.6 8.9 7.6 14.3
7.1.7 National Environmental engineering Research Institute, Nagpur
This Institute had conducted evaporation control studies on three lakes namely Sagar lake (Jaipur) and Jawai lake (Pali) in Rajasthan and Vehar lake (Thane) in Maharashtra. The salient features of these lakes details of experiments conducted, methodology followed, observations carried out and percentage of reduction in evaporation achieved are detailed in Table 7.5
TABLE 7.5 : Studies Conducted By NEERI, Nagpur, Maharashtra SI.
no
Experimental Details Name of the Lakes
Sagar Lake (Jaipur)l Jawai Lake (Pali) Vihar Lake (Thane)
1. Gross area at FRL 2.25 ha 2600 ha 370 ha
2. Gross Capacity — 210 MCM —
3. Period of study April-June 1968 June & July in 1966, 67 Jan. - June 1965
4. Chemical used Cetyl alcohol Cetyl alcohol Cetyl alcohol
5. Measurement of rate of evaporation
Field — Standard evaporation pan
Field — Standard evaporation pan Field — Standard evaporation pan 6. Area covered 2.25 ha 246 ha in 1966 and 451 ha in 1967 370 ha
7. Rate of application 0.24 kg/ha 0.24 Kg/ha 0.12 Kg/ha
8. Optimum pressure 16-25 dyne/cm 16-40 dyne/cm
40 dyne/cm
9. Meteorological data
Temperature Min. 28°C-33°C Max. 39°C-40°C
1966 1967 22-24°C 22-24°C 41-37°C 41-46°C
22°C-24°C 29°C-41°C Relative Humidity Min. —
Max. —
30-48% 11-40% 97-98% 90-95%
54.25-75.2% (mean)
Wind Velocity 10 km/hr 4-6 km/hr (Min) 2-3 km/hr 16km/hr (Max) 6.5-8.5 km/hr
TABLE 7.5 (CONTD.)
1 2 3 4 5
Rainfall — 812mm 812mm —
Lake Temperature Min. — Max. —
27-30°C 26-28°C 33-35°C 32-36°C
24°C-30°C
10. Wind effect on layer drifting of the layer to the shore
drifting of the layer to the shore drifting of the layer to the shore
11. Permeability to CO2 & 02 Good Good Good
12. Frequency of reapplication Once in a day Twice in a day Once in a day
13. Hazard to public health Nil Nil Nil
14. Methodology adopted for calculating evaporation loss
Water Budget Water Budget Water Budget
15 % saving in evaporation Losses
7.1.8 A.P. Engineering Research Laboratories, Himayatsagar, Hyderabad
Studies were conducted by this Institute in Himayatsagar reservoir in the Ranga Reddy District of Andhra Pradesh during the period from April, 1983 to June 1983. Cetyl alcohol dissolved in mineral turpentine oil was spread over an area of 697 ha at the rate of 0.125 kg of chemical per hectare per day. The chemical was sprayed by petrol driven automatic sprayer and an optimum pressure of 18-24 dyne/cm was maintained. Meteorological data such as temperature, wind velocity, humidity, rainfall were recorded. Daily application of the chemical was found necessary to maintain the required film pressure. The study for this small period of time indicated evaporation reduction of 38%.
7.1.9 Directorate of Irrigation Research and Development, Pune
TABLE 7.6 : Studies by Directorate of Irrigation Research and Development, Pune Sl.
No
Particulars Kondhapuri M.I.
Tank
Aundhengnath M. I. Tank
Baradhari M.I. Tank Kedarpur
percolation tank
Indira percolation tank
1. Village Kondhapuri Aundha Mahektri Ladgaon Rajgurunagar
2. District Pune Parbhani Ahmednagar Nagpur Pune
3. Average monsoon rainfall (mm) 480 800 500 890 600
4. Gross storage at FRL (MCM) 2.51 2.81 1.87 0.40 0.57
5. Full Tank level (m) 136.22 554.62 109.06 997.14 62.18
6. Water spread area (ha) 66.52 45.00 38.00 13.70 14.18
7. Gross command area (ha) 580.00 590.00 360.00 131.00 188.00
8. Percentage evaporation retardation compared with Pan Evaporation
i) 1976-77 — — — — 35
ii) 1977-78 19.50 37.00 — 34.78 39.19
iii) 1978-79 — — 11.17 — 35.20
The basic compound Linoxyd CS-40 was used for preparing the emulsion. The composition of the emulsion was 40% original compound and 60% other material. The emulsion was stabilized by surface active reagents like detergents. The required quantity of the emulsion at 650 gm/ha/day was taken and mixed with a little quantity of water manually. The diluted paste was then sieved through a thick cloth to act as a filter. This was then re-diluted to about 15 times by adding adequate quantity of water. The diluted Linoxyd CS-40 was then spread over the water surface to form a thin film. For this purpose, the water surface was divided into a number of bays by using floats. One float was covering approximately 0.8 to 1.0 ha. Each float had one container with a pinchcock. The container had a capacity of 18 liters and was mounted on a platform of 1.2 m X 1.2 m. The pinchcock ensured regular dripping of the diluted emulsion. The wooden platform had 4 sealed empty tins (2 litres) at the four corners to enable the platform to float on the surface. The floats were anchored with nylon chords and heavy weights to keep them stationary. A manually operated boat was used for carrying the emulsion to the containers. There were about 20 floats placed in different bays in the reservoir. The rate of drip was one litre / hr for 10 hours day. SAE-40 indicator oil was used to test the existence of the film.
The lake levels and therefore the contents were monitored through gauge data. Visible seepage was measured through a V-notch. Outflow into the canals is measured through a V-notch coupled with an automatic stage recorder. Pan Evaporimeter was established and observations were taken twice a day (08.30 and 17.30 hrs). Maximum and minimum temperature and relative humidity were recorded at 0830 hrs. Wind speed and direction were measured every 2 hours and rainfall once a day. About 6 workers were required for 20 ha. of water surface.
The Pan coefficient for the Pan evaporimeter established near the lake was found to be 0.9 and was so adopted in the analysis.
The Linoxyd CS-40 was also thoroughly checked from the angle of toxicity, at two laboratories namely Haffkins Institute and Hindustan Lever Research Laboratory. The report says that the compound is neither toxic nor harmful to human beings, animals and aquatic life. The film was found allowing oxygen to pass through and hence the percentage of dissolved oxygen remained unaffected.
An analysis of the cost per unit of water saved was also carried out. The cost was considered to include equipment, material and labour. The conclusions drawn from the experiments were :
Directorate however concluded that during drought conditions and in the years of scarcity this method of water conservation may be viable proposition on small tanks (water spread areas 20-50 ha) which supply water for domestic purpose.
TABLE 7.7 : Studies Conducted by M/S Aegis Chemical Industries Limited, Mumbai S.
No
Details Name of Reservoir/lake/tank etc.
Ramgarh
Lake
Foy sagar Meja Dam Nyari Dam Sasoi Dam Osman Sagar
1 Location Jaipur,
Rajasthan . Ajmer, Rajasthan Bhilwara, Rajasthan Rajkot, Gujarat Jamnagar, Gujarat Hyderabad, A.P.
2 Purpose (Hydel, Irrigation, Drinking, Industrial etc.)
Drinking Water Drinking Water Drinking Water Drinking Water Drinking Water Drinking Water 3 Period of study April 85-
July85 Jan. 86- June 86 Jan. 86- July86 Jan. 86- June86 Jan. 86- June86 April 86- June 86 4 Measures adopted ---Chemical treatment ---
5 Experimental
a) Equipments used for
measuring rate of evaporation (both in the field and lab- scale)
---Pan evaporimeter and other meteorological instruments---
b) Area covered (ha) 102 6 144 92 164 410
c) Name of the chemical used ---Cetyl Stearyl Alcohol Emulsion---
d) Thickness of the monolayer applied
---0.015 micron---
e) Optimum pressure of layer ---35 dyne / cm---
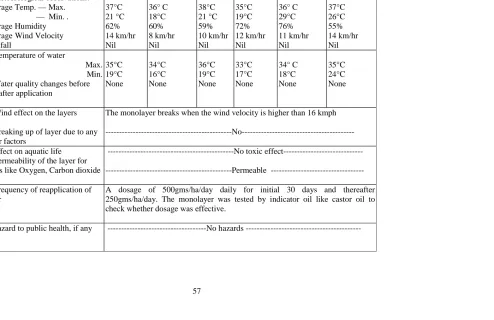
TABLE 7.7 (CONTD.) 6. Observations during the study :
a) Meteorological observations: Average Temp. — Max. — Min. . Average Humidity Average Wind Velocity Rainfall 37°C 21 °C 62% 14 km/hr Nil 36° C 18°C 60% 8 km/hr Nil 38°C 21 °C 59% 10 km/hr Nil 35°C 19°C 72% 12 km/hr Nil 36° C 29°C 76% 11 km/hr Nil 37°C 26°C 55% 14 km/hr Nil b) Temperature of water
Max. Min. c) Water quality changes before and after application
35°C 19°C None 34°C 16°C None 36°C 19°C None 33°C 17°C None 34° C 18°C None 35°C 24°C None
d) Wind effect on the layers
e) Breaking up of layer due to any other factors
The monolayer breaks when the wind velocity is higher than 16 kmph
---No---
f) Effect on aquatic life g) Permeability of the layer for gases like Oxygen, Carbon dioxide etc.
---No toxic effect---
---Permeable ---
h) Frequency of reapplication of layer
7 Methodology adopted for calculating evaporation loss
---Water Budget ---
8
Evaporation Control
a) % reduction in loss due to evaporation
23.4 (from May, June it was 29%)
7.1.10 G.B.Pant University of Agriculture and Technology, Pantnagar
This University had conducted experiments to evaluate the performance of chemical films in evaporation retardation by using wind tunnel. The wind tunnel used is a closed type open circuit aerodynamic tunnel in which provision for controlling wind velocity exists. It consists of three sections (i) a honey combed screen protected square entrance (ii) a square section test chamber (61 cm X 61 cm) and (iii) a diffuser.
The honey combed square entrance has contraction ratio of nine to one, which converges to the test section. The square section test chamber gradually diverges to the circular diffuser section. At the end of the diffuser a fixed pitch four blade propeller operated by a 20 H.P. motor is fitted, which sucks air through the tunnel. The speed of the propeller is controlled with the help of an electric resistance regulator. A pair of adjustable flap gate is provided at the end of the test section and at the beginning of the diffuser section to control the wind velocity. These gates are operated from outside to adjust a part of the air to be sucked from the side windows and partly through the test chamber to maintain the desired wind velocity in the test chamber.
The test tank was made of 6 mm mild steel sheet having an area of 1568 square cm. The test tank was fixed at the bottom of the opening of the test chamber in such a way that the top edge of the tank was just at the floor elevation of the test chamber. A layer of thick paper was pasted around the test tank to eliminate chances of air leakage.
The chemicals Hexadecanol and Octadecanol were used for the study and were applied over the water surface in a fine power form with a hand dust sprayer. Care was taken to maintain a uniform thickness of the film. Measurements of loss of water due to evaporation from the test tank were made with the help of a calibrated inclined manometer. Evaporation data from free water surface were recorded with and without application of chemicals.
A vane type sensitive anemometer was used to measure the wind velocity in the test chamber. Calibration of opening of flap gate for maintaining the required wind velocity in the test chamber was made with the help of a micro manometer. Wet bulb and dry bulb thermometers were used to determine vapour pressure deficit in the test chamber.
Where es and ea are the saturated and actual vapour pressure respectively and Td and Tw are the dry bulb and wet bulb temperature respectively. It is evident from