Development of an improved Fitch apparatus for application in
technologically less developed countries
Ugwuishiwu B. O., Ezeoha S. L., Nwakaire Joel Nwaeze
*(Department of Agricultural &Bioresources, University of Nigeria, Nsukka)
Abstract: This study was a contribution to increasing the technology availability for agro-material testing. The principles which were considered in design of thermal conductivity probe included the heat transfer methods like conduction and convection. Fitch apparatus was reviewed and found to be deficient on heat transfer through convection and radiation. An improved Fitch apparatus was developed and tested. It was designed based on radiative-convective-conductive heat transfer that was using non steady state heat transfer through non-line heat sources. The major components included an electric bulb, the casing, a digital thermometer and a sample hanger. The standard temperature of the system was kept at 81.5°C for testing
of products. The results of experiments which were conducted on three samples of cocoyam, sweet potato, and Irish potato with the improved Fitch apparatus, showed K-values of 1.032 Wm-1 K-1, 0.92 Wm-1 K-1, and 0.604 Wm-1 K-1 respectively at
specimen thickness of 0.025 m and moisture content of 71.3% (w.b). The Cronbach reliability test showed that the equipment had a reliability of 99%, and that indicated the device was desirable. The main contribution of developed Fitch apparatus is to complement the knowledge of the development of agricultural equipment in Nigeria.
Keywords: drying, Fitch apparatus, heat transfer, moisture content, thermal conductivity
Citation: Ugwuishiwu, B. O., S. L. Ezeoha, and J. N. Nwakaire, 2017. Development of an improved Fitch apparatus for application in technologically less developed countries. Agricultural Engineering International: CIGR Journal, 19(2): 159–167.
1 Introduction
The primary goal of the food processing industry is to supply the market with safe products. One common means of achieving this goal is food preservation by way of thermal processing. The application of heat can induce reduce many chemical reactions, deactivate enzymes, and kill microorganisms. As a result, the product could have hopefully of appetizing quality, an extended shelf – life and safe to consume. For efficient and economical design of all food processing operation which involving heat transfer, the knowledge of thermal properties is essential. The thermal properties of food are the mode of action of heat distribution in a food product (Singh and Groswami, 2000). Thermal properties which affect drying or thermal
Received date: 2016-07-29 Accepted date: 2017-04-27 * Corresponding author: Nwakaire J. N., Lecturer/Senior Research Fellow of Department of Agricultural &Bioresources, University of Nigeria, Nsukka. Email: [email protected]. Tel: +2347035020691.
treatment of biomaterials are thermal diffusivity, specific heat capacity, thermal resistance, and thermal conductivity. Two thermal properties of great importance are thermal conductivity and thermal diffusivity. Thermal conductivity measurement is very advanced and meets stringent requirement for accuracy. In most developing countries like Nigeria, the non-existent of apparatus for measuring thermal properties have slowed down the research in the area of drying and processing of agro-products. Yet, values of thermal conductivity (K) reported for agricultural materials are still estimates, which usually exhibit variations of ±15% (Dickerson and Read, 1968). Estimating the thermal conductivity of agricultural food materials is necessary for the design and analysis of the numerous machines and processes involving heat treatment of these materials in cooking, thermal curing, drying, dehydration, blanching and storage.
except garri and other contact drying which using the means of heat transfer from the source to the material is by conduction. For efficient measurement of K-value, the principle of convective and radiative heat transfer should be utilized. The modified Fitch apparatus by Odigboh (1978) does not take care of these modes of heat transfer. The specific objectives of this work were to improve the Fitch apparatus for thermal conductivity studies, determine the K-value of three known Nigerian food product, use the improved Fitch apparatus, and compare results with existing data from a standard test apparatus.
Methods for measuring thermal conductivity can be classified into two broad categories. They are the steady-state heat transfer method and the transient-state heat transfer method. There are a number of developed experimental techniques for each category. According to Njie et al. (1998) claimed the steady-state methods often require a long time to complete, and moisture migration may introduce significant measurement errors. One way thermal conductivity of biological or agricultural products can be determined based on steady state is using the Guarded Hot Plate Apparatus (Njie et al., 1998). The transient-state heat transfer method of thermal conductivity of biological materials is more suitable for the materials which are generally heterogeneous and often contain high moisture (Njie et al., 1998). The line source method is the most widely used transient-state method. This method uses a bare wire or a thermal conductivity probe as a heating source and estimates the thermal conductivity based on the relationship between the sample core temperature and the heating time. The apparatus for the measurement of thermal conductivity are guarded hot plate apparatus, thermal conductivity probe, thermistor probe, and the modified Fitch apparatus. Lentz (1961) described the use of a modified guarded hot plate apparatus in measuring the thermal conductivity of meats, fats, gelatine gels, and ice. The standard guarded hot plate method is based on the steady-state longitudinal heat flow principle, which determines the thermal conductivity of the material by applying Fourier’s law. As described by Mileset et al. (1983), the experimental set-up consisted of the sample material on each side of the Hot Plate. This assemble was then sandwiched
between cold plates which maintained at lower temperature by liquids circulating through them. Thermal conductivity was determined by measuring the heat flux through the samples for a resulting temperature gradient. The apparatus is so called, as the edge losses from the sample being prevented by a guard ring. Lentz (1961) used an insulation material of known thermal conductivity on one side of the hot plate instead of introducing a second sample to minimize the error. Lentz (1961) used the guarded hot plate apparatus in measuring thermal conductivity of different types of meat, fish and poultry over a range of temperature, between 5°C and –25°C. He reported that above freezing temperatures, the
thermal conductivity of the measured meats were nearly equal to each other and slightly lower than water.
Mohsenin (1980) reported that with this method, the measurements would take a considerable amount of time, as the several hours needed for the sample to reach a steady state condition and because of the larger sample size. This will eventually promote moisture migration within the sample. So, it proved to be a successful method for dry homogenous samples in the form of slabs. Sweat and Haugh (1974) reported the use of a thermal conductivity probe for the measurement of thermal conductivity for small food samples, which was based on the theory of the line heat source method. This is based on a line heat source of infinite length and infinitesimal diameter. It essentially consisted of a thermocouple with a constantan heater wire running along its length which is the heat source and a copper constantan thermocouple as the temperature recorder. The entire assembly was then enclosed in 21 gauge stainless steel tubing, with 3.9cm long and 0.07cm outer diameter.
0.52 to 0.04 Wm-1 K at 30°C and that would be decreased
with decreasing the moisture. The probe consisted of Teflon insulated constantan heater wire in double length, acted as a heat source and constantan thermocouple. They were both inserted in a stainless steel syringe needle. In both cases, the probes were inserted into the sample of interest at uniform temperature initially. The source is heated at a constant rate, and the probe temperature closest to the line source is monitored.
Kumbhar (1981) also reported the use of similar type of probe made with a sewing needle instead of a hypodermic needle for better accuracy in thermal conductivity measurements of food. A simultaneous measurement technique for both thermal conductivity and diffusivity based on the line source probe has been presented by Chato (1968) on different species of fishes over temperatures of –20°C to 40°C. Their results also showed that thermal conductivity was increased with temperature and moisture.
The use of thermistor probe in the measurement of thermal conductivity of food is very limited. The use of thermistors for the determination of thermal conductivity of biomaterials was reported as early as in Chato (1968). After that, it was used for the measurement of thermal conductivities of biomaterials and tissue perfusion, but not for food. Kravets (1988) used thermistor to measure the thermal conductivity of various milk products at high temperature. He concluded that the method was very practical and thermal conductivity measurement correlated well with the physical changes in milk at higher temperature. Van Gelder (1996) measured thermal nutritional supplements at higher temperature. Thermal conductivity values for tomatoes products agreed quite well with the reported values, but thermal diffusivity values were larger than literature values. Van Gelder (1996) also reported a positive relation between temperature and moisture content. A thermistor is thermally sensitive and exhibits a change in electrical resistance with the change of temperature. These are ceramic semi-conductors, which made of oxides of manganese, nickel, cobalt, copper, iron, and titanium. The Fitch method reported by Fitch in 1935 is one of the most suitable methods for measuring the thermal conductivity
of food and agricultural products. The Fitch apparatus, which was described by Fitch in 1935, was later modified by Choi and Okos (1983). The Fitch apparatus is used for determining thermal conductivity by a non-steady-state method. The Fitch method uses a plane source of heat. It is applicable to poor conductors of heat that can be formed into a slab. The Fitch apparatus consists of a heat source and a heat sink. The heat source is a constant temperature vessel, insulated on the sides and with a highly conductive bottom. The heat transfer areas are smooth to minimize contact resistance. The roles of heat sink and source are reversed when the vessel is maintained at temperature lower than the copper block.
According to Folorunso (1976), the following assumptions were considered in the development of Fitch apparatus;
1) That heat flows only in a direction normal to the heat transfer surfaces.
2) That heat transfer is entirely by conduction.
3) The rate of heat flow from the source is uniform over the test area of the sample.
4) That there is always a perfect contact between each pair of heat transfer surfaces, and
5) There is further heat flow beyond the lower surface of the heat sink, thus, the sink accumulates the absorbed heat with time.
1.1 Summary of literature findings
Deduction from literature review showed that the Fitch apparatus gave the best result in series of tools used for thermal conductivity study. The review shows that the approach used in thermal conductivity studies was heat transfer by conduction or convection, and there have not been thermal conductivity studies regarding the combination of radiative-convective-conductive heat transfer, which simulates the natural drying process of agricultural products in solar dryers and open air systems.
2 Materials and methods
2.1 Principles of heat transfer used
place. The mechanism of heat transfer from heat source is radiation, while the movement or transfer of thermal energy from the heat source to the material is through radiation and convection, and the transfer of heat from the surface of the material to the point of insertion of the thermometer is by conduction and convection (through the thickness of material). Thermal conductivity was determined by considering the quantity of heat (Q), thickness of material (L), in a direction normal to a surface area (A) and temperature difference (ΔT).
2.2 Type of crop(s) tested
In this research, sweet potato (red), Irish potato and cocoyam were used for experiments. Sweet potato (Ipomoea batatas L Africana) was chosen due to high demand for the product because it is a cheap source of carbohydrate, and cocoyam (Colocasiaesculenta L Africana) was selected because of its use in soup making in Nigeria. Irish potato (Solanumtuberosum L Africana) was used because of its use in dietary restrictions.
2.3 Design Parameters
The design parameters required are volume, power source and quantity of heat.
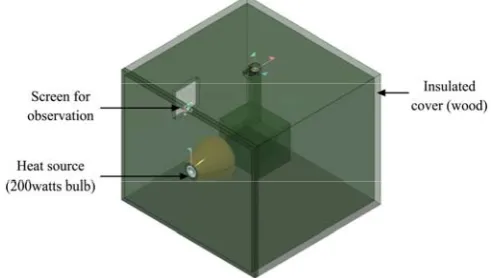
The volume of solid is the amount of space that the solid occupies. The solid in this case of the thermal conductivity probe is the cuboids. A cuboid is a solid with six faces, which are all rectangles. In this case, we clearly understand that we need to know the volume of the cuboid. The dimensions used were 37 cm × 35 cm × 43 cm. Volume of Cuboid = Length × Breadth × Height = 35 cm × 43 cm × 37 cm = 5568 cm3. Minimal volume of the apparatus is desired to ensure the attainment of uniform high heat-source temperature of 80°C in a short time. However, adequate apparatus volume is necessary to accommodate both the bulb, sample holders and to allow for maneuverability by the experimenter during execution of conductivity experiments. The dimension of the cuboid (37 cm×35 cm×43 cm) was chosen to satisfy both the minimization and adequacy requirements.
Figure 1 and Figure 2 show the three-dimensional and sectional views of the improved Fitch apparatus. The heat source is from the bulb which simulates local drying method from the sun. The power emission by the heat source is 200 Watts. 200 Watts bulb was chosen to attain
a uniform high heat-source temperature of 81.5°C within
a record short time of 45 min. A smaller capacity bulb would take longer time to produce the high heat source temperature if given the chosen cuboid volume. A high heat source temperature of 80°C is desirable to ensure detectable and measurable sample temperature changes within a short time.
Figure 1 The three-dimensional design view of the modified Fitch apparatus
Figure 2 Sectional view of the modified Fitch apparatus
2.4 Materials
2.4.1 Testing Procedure
Irish potato, sweet potato (red), and local cocoa yam were used as the agricultural product. Three different samples of Irish potato, sweet potato and local cocoa yam were cut to obtain a uniform thickness of 0.02 m. To obtain a perfect cubic sample, the various samples were cut using a sharp knife and measured accurately using a meter rule and Vanier calliper.
2.4.2 Determination of moisture content.
Moisture contents on wet-basis of the three different samples were determined using Mythili and Venkatachalam (2013) claimed technique. It was observed that the various samples had uniform moisture content. The moisture content was determined using Equation (1).
Moisture content, W D 100
wb
W
M M
MC
M
−
= × (1)
where, MCwb is the moisture content of the sample in %
wet basis; MW is the initial weight of the sample in g; MD
is the weight of the sample after testing in g. The weights of samples were measured using a digital weighing balance (Ohaus CL5000F) with capacity of 5000 g at sensitivity level of ±0.0001 g.
2.4.3 Determination of Thermal Conductivity
The thermometer was inserted into the system (sample hanger) without the specimen, and the electric bulb was switched on and after 45 minutes the system temperature remained constant at 81.5°C. This temperature was taken as the standard temperature of the system. The standard temperature that was obtained served as the temperature of heat source (th), 81.5°C. The
initial temperature of sample 1 was obtained, before the sample was placed in the system. The thermometer was inserted into the sample. The thermal conductivity equations modified by (Choi and Okos1983) were used to determine thermal conductivity. These modified Equations (2), Equations (3) and Equations (4) are given below:
2 1
1
ln( ) / ( )
p h s
k MC L t t
A θ θ
⎛ ⎞
= ⎜ ⎟ − −
⎝ ⎠ (2)
k=LBγ (3)
where MCp, ln(B th ts) / ( 2 1)
A
γ = = − θ −θ (4)
where, K = thermal conductivity (W/m °k); M = mass of the sample (kg); Cp = specific heat capacity of the sample, th–ts = the temperature difference between initial
apparatus reading and measured at the centre of the sample at a time (ϴ); L = the thickness of the sample (m); and A = Area of the sample (m2). To determine the heat transferred from the bulb to the sample, the principle that heat lost is equal to the heat gained by the sample was used as shown in equation (5) and (6).
p
MC Δ =θ IVt (5)
p
IVt C
M θ
=
Δ (6)
where, Cp is specific heat of material (sample); M is the
mass of the sample (kg); Δθis change in temperature (K);
I is the current flow to the heat source (amps); V is the voltage (v); and t is the time for heating from the heat source.
Readings were obtained from the digital thermometer at intervals of two minutes using a stop watch. After 20 minutes, readings of sample one were obtained following the stated procedure. Samples two and three data were collected using the same procedure as sample one. These temperatures obtained after every two minutes from the centre of the sample was known as ts
(temperature of sample). ln(th–ts) was calculated, and a
graph of ln(th–ts) against time was plotted to obtain the
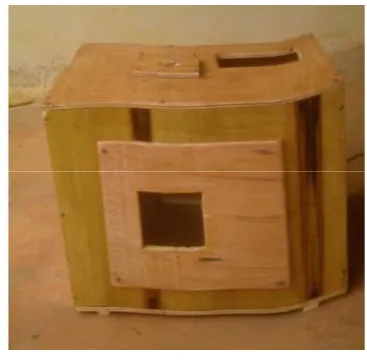
slope, B. Figure 3 shows a pictorial view of the modified Fitch apparatus.
Figure 3 The completed modified Fitch Apparatus
2.4.4 Comparison of test results
probe that offers the possibility to perform a practical and fast measurement of the thermal conductivity (or thermal resistivity) of the medium of it is inserted at a high accuracy level. It works in compliance with the ASTM D 5334-00, D 5930-97 and IEEE 442-1981 standards. The TP08 sensor utilizes the non-steady state transient heat method based on line heat source.
3 Results and discussion
The plot of temperature difference against time for the three samples of local sweet potato is shown in Figure 4. The plot shows similar trend with work reported by Miles et al. (1983), in which the slope of the temperature-time plot was negative. It was also similar to the work of Taiwo et al. (1995) on the thermal properties of ground and hydrated cowpea which showed similar negative slope. The correlation coefficient of the value was high with a value of 0.996, 0.995, and 0.995. The R2 value shows the accuracy of the reading obtained from the developed apparatus.
Figure 4 The plot of ln(th–ts) against time intervals of heat flow
from outer to inner tissue of the sample
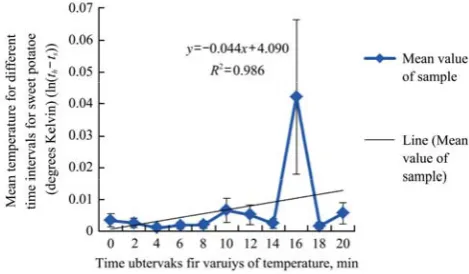
The overall plot of the average value for the three samples of sweet potato is shown in Figure 5 with correlation coefficient of 0.98.
Figure 5 Plot of mean temperature difference for sweet potatoes with error bars
Table 1 shows the summary of K measurements for sweet potato. It was observed that although the samples attained uniform moisture content, the thermal conductivity of the samples varied. The variation in thermal conductivities may be as a result of their variation in weight temperature, etc. It was also observed that the initial temperatures of the samples decreased as the weight of the samples increased. All these variations may have also contributed to the variations in thermal conductivity of sweet potatoes with equal moisture content. The average thermal conductivity of sweet potatoes was obtained as 0.9196 Wm-1 K-1. This value is
in line with the k-value calculated by Odigboh (1978) but is not when compared with Njie et al. (1998) who gave k-value for yam as 0.6 Wm-1 K-1 at moisture content of
59%.
Table 1 Measured thermal conductivity for Sweet potatoes
Sample of Sweet Potatoes
Initial temperature of samples, ℃
Moisture content on
wet basis Slopes of the plots of ln(against time th–ts)
Thermal conductivity, K, (Wm-1 k-1)
at Heat source temperature, th = 81.8℃
Sample 1 27.6 71.3% 0.048 0.9208
Sample 2 27.6 71.3% 0.047 0.9831
Sample 3 27.5 71.3% 0.047 0.8550
Average = 0.9196
The result of the cocoyam test shows that the thermal conductivity of the three samples of cocoyam were 1.022, 1.042, and 1.032 Wm-1 K-1, respectively at a moisture content of 71.3% and it is in line with the results shown by Stroshine and Hamann, (1994). The coefficient of determination, R2 for the three sample test were 0.985, 0.995, and 0.996 respectively which shows that the total
variation in the dependent variable was caused by variations in all the regress and in the model as shown in Figure 6. Thus, the explanatory variable explains about 98.9% of the total variations in the change in temperature and therefore accurately explains the thermal conductivity
of the material under study. The model equation
sample plot for cocoyam can be used to predict the value of the relationship ln(th–ts).
Figure 6 Graph of ln(th–ts) against time for the three samples of
cocoyam
Figure 7 Plot of the mean values of ln(th–ts) against time for the
cocoyam
The calculated average thermal conductivity of cocoyam was 1.032 Wm-1 K-1 at 71.3% moisture content.
TP08small size non-steady-state probe for thermal conductivity measurement was used to compare the obtained thermal conductivity of the samples of sweet potato and cocoyam.
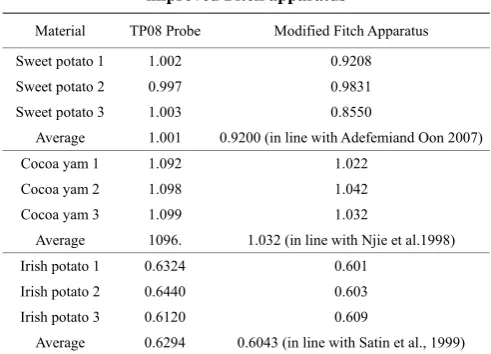
The result of the comparison of TP08 sensor results and the modified Fitch apparatus is shown in Table 2 below, which showed similarity in trends but different in values due to the non-steady heat flow method used. While the TP08 utilizes line heat source process, the modified Fitch apparatus utilizes radiative convective non-line heat source, hence the reason for the difference in values. Analysis of variance, Duncan post hoc test and reliability test were conducted to determine the reliability of the developed apparatus when compared with the standard TP08 sensor.
From Table 3, the analysis of variance at P<0.05 shows that there was no significant difference between the k-values for the improved Fitch apparatus and the
TP08 sensor. This means that the results from the improved Fitch apparatus were related to each other without significant difference at the said confidence level of 95%. But when the result from the improved apparatus was compared to that of the TP08 sensor, the calculated F-test was higher than the F-tabulated, showing that at
P<0.05 there was a significant difference between the results from the TP08 sensor. The difference may be due to the process of thermal conductivity determination, where TP08 utilizes line heat source while the improved utilizes non-line heat source.
Table 2 K-values from TP08 standard probe and the improved Fitch apparatus
Material TP08 Probe Modified Fitch Apparatus
Sweet potato 1 1.002 0.9208 Sweet potato 2 0.997 0.9831 Sweet potato 3 1.003 0.8550
Average 1.001 0.9200 (in line with Adefemiand Oon 2007) Cocoa yam 1 1.092 1.022
Cocoa yam 2 1.098 1.042 Cocoa yam 3 1.099 1.032
Average 1096. 1.032 (in line with Njie et al.1998) Irish potato 1 0.6324 0.601
Irish potato 2 0.6440 0.603 Irish potato 3 0.6120 0.609
Average 0.6294 0.6043 (in line with Satin et al., 1999)
Table 3 Analysis of variance comparing the results from TP08 and Improved Fitch Apparatus
Sum of Squares d f Mean square F-cal Sig.
Between Groups 0.674 5 0.135 179.521* 0
Within Groups 0.009 12 0.001
Total 0.683 17
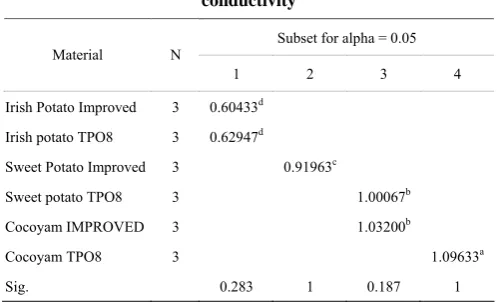
Duncan multiple range tests were carried out to determine the biomaterial that has the highest thermal conductivity. From Table 4, cocoyam (Colocasiaesculenta L. Africana) has the highest with a value of 1.09633a under rank 4, which is the highest rank for the means. According to Table 4, the material that has the lowest thermal conductivity was Irish potato (Solanumtuberosum L Africana), while the material with the second highest thermal conductivity was sweet potato (Ipomoea batatas L.Africanna) with a value of 1.03200b.
apparatus based on its similarity with the standard TP08 probe.
Table 4 Duncan multiple test result for material with highest conductivity
Subset for alpha = 0.05 Material N
1 2 3 4
Irish Potato Improved 3 0.60433d
Irish potato TPO8 3 0.62947d
Sweet Potato Improved 3 0.91963c
Sweet potato TPO8 3 1.00067b
Cocoyam IMPROVED 3 1.03200b
Cocoyam TPO8 3 1.09633a
Sig. 0.283 1 0.187 1
Table 5 Cronbach’s reliability test result for the improved Fitch apparatus
Cronbach’s Alpha Cronbach’s Alpha based on standardized items N of Items
0.989 0.991 2
4 Conclusions
Based on the results and test conducted by using the developed improved Fitch apparatus, the following conclusions were reached:
The improved Fitch apparatus was successfully developed based on the principle of non-steady state heat transfer method, but not the line heat source method. The method used was non-line heat source which simulates the actual process of natural heat transfer from the sun and most solar dryers.
The average thermal conductivity of 1.032, 0.604, and 0.92 Wm-1 K-1 for cocoyam, Irish potato, and sweet potato respectively were reliable values according to Cronbach’s reliability test which gave a standardized value of 99%. This reliability was based on its relationship with a standard test apparatus TP08 probe.
According to Duncan’s multiple range tests, cocoyam gave the highest thermal conductivity with a value of 1.032 W m-1 k-1 at probability level of 0.05.
Based on the reliability test, similarity with an internationally accepted standard apparatus TP08, the improved Fitch apparatus may be used in various laboratories for K-studies. It is also a plus for agricultural equipment development in Nigeria.
References
Adefemi, F., and B. Ooon-Doo. 2007. Thermal properties of sweet potato with it moisture content and temperature. International Journal of Food Engineering, 10(4): 703–719.
Annamma, T., and C. V. N. Rao. 1974. Studies on thermal diffusivity and conductivity of fresh and dry fish. Fisher Technology, 11(1): 28–33.
ASTM D5334-00. 2000. Standard test method for determination of thermal conductivity of soil and soft rock by thermal needle probe procedure. West Conshohocken: ASTM International. Available at: www.astm.org. Accessed 10/08/2016.
Chato, J. C. 1968. A Method for the Measurement of the Thermal Properties of Biological Materials in Thermal Problems in Biotechnology. New York: The American Society of Mechanical Engineers. Available at: www.scholar.lib.vt.edu. Accessed 04/03/2016.
Choi, Y., and M. R. Okos. 1983. The thermal properties of tomato juice concentrates. Transactions of the ASAE, 26(1): 305–311. Folorunso, A. B. 1976. Determination of thermal conductivity by
using the Fitch apparatus. B. Eng. Project in Department of Agricultural Engineering, University of Nigeria Nsukka. Kravets, R. R. 1988. Determination of thermal conductivity of food
materials using a bead thermistor. Ph.D. thesis. Food Science and Technology, Virginia Polytechnic Institute and State University. Available at: www.scholar.lib.vt.edu. Accessed 03/06/2016.
Kumbhar, B. K. 1981. Thermal properties of fresh and frozen fish. International Journal of Refrigeration, 4(3): 143–146. Lentz, C. P. 1961. Thermal conductivity of meats, fats, gelatine
gels and Ice. Food Technology, 15: 243–247.
Miles, C. A., G. Van Beek, and C. H. Veerkamp. 1983. Calculation of the thermo-physical properties of foods. In Physical Properties of Foods. R. Jowitt, et al. ed. London: Elsevier Applied Science.
Mohsenin, N. N. 1980. Thermal Properties of Food and Agricultural Materials. New York: Gordon and Breach Science Publishers.
Mythili, R., and P. Venkatachalam. 2013. Briquetting of agro-residues. Journal of Scientific and Industrial Research, 72(1): 58 – 61.
Njie, D. N., T. R. Rumsey, and R. P. Singh. .1998. Thermal properties of cassava, yam, and plantain. Journal of Food Engineering, 37(1): 63–76.
Odigboh, E. U. 1978. Instruments for measurement of thermal conductivity of solid food materials. Nigerian Journal of Engineering and Technology, 1(3): 10–19.
Sahin, S., S. K. Sastry, and L. Bayindirh. 1999. Effective thermal conductivity of potato duringfrying: measurement and modeling. International Journal of Food Properties, 2(2): 151–161.
Singh, K. K., and T. K. Goswami. 2000. Thermal properties of cumin seed. Journal of Food Engineering, 45(1): 181–187 Stroshine, R. and D. D. Hamann. 1994. Physical Properties of
Agricultural Materials and Food Products. Course manual. USA: Purdue University.
Sweat, V. E., and C. Haugh. 1974. A thermal conductivity probe for small food samples. Transactions of the ASAE, 17(1): 56–58.
Taiwo, K. A., C. T. Akanbi, and O. O. Ajibola. 1995. Thermal properties of ground and hydrated Cowpea. Journal of Food Engineering, 29(3-4): 249–256.
Van Gelder, M. F. 1996. A Thermistor Based Method for Measuring Thermal Conductivity and Thermal Diffusivity of Moist Food Materials at High Temperatures. London: Thermal Conductivity, Academic Press. Available at: www.scholar.lib.vt.edu. Accessed November, 20, 2015. Wang, D. Q., and E. Kolbe. 1990. Thermal conductivity of