Representing the human experts judgment on quality indices of
white rice
Z. Esmaeili
1, B. Hosseinzadeh Samani
*1, S. Rostami
1and H. Zareiforoush
2 (1. Department of Mechanical Engineering of Biosystem, Shahrekord University, Iran2. Mechanization Engineering Department, Faculty of Agricultural Sciences, University of Guilan, Rasht, Iran)
Abstract: In the present study, a grading system based on fuzzy logic was developed to simulate the behavior of an expert in the evaluation and classification of physical properties of rice grains for pricing the product. Based on two desired qualit y indices in this study and the input linguistic variables of fuzzy grading system, 250 samples were prepared with different quality conditions which include all the possible states for the rice grains. Lighting and imaging were carried out from each 250 samples of rice products in the same condition. Image processing algorithm was conducted to extract geometric features and light intensity of grains and also fuzzy product pricing model was developed in MATLAB software. Fuzzy inference system was designed with the help of fuzzy toolkit. The input variables of the fuzzy system designed in this study were degree of milling (DOM) and percent of broken kernels (PBK) that were obtained as a real numbers of an image processing algorithm. In total, 25 rules of If-Then were formulated with considering the number of inputs’ fuzzy sets. Fuzzy inputs for degree of milling and the percentage of broken kernels were five membership functions of very low, low, medium, high and very high that were selected based on the evaluations conducted from quality of rice production within the rice field factories in north of the country. The results of pricing through fuzzy logic indicated good overall matching with results of product pricing by an expert (overall accuracy of 92%).
Keywords: rice, image processing, broken kernels, degree of milling, pricing, fuzzy logic
Citation: Esmaeili, Z., B. H. Samani, S. Rostami, and H. Zareiforoush. 2016. Representing the human experts judgment on quality indices of white rice. Agricultural Engineering International: CIGR Journal, 18(4):97-106.
1 Introduction
1Among grain products, rice with scientific name of
Oryza Sativa L. is considered the world's most important
food as a dietary product strategic and it is cultivated in a
wide area of the world’s agricultural lands after wheat
due to the essential need of humans to consume it. Rice
cultivation in the world and its production in terms of
quality and quantity is important. According to Food and
Agriculture Organization of the United Nations in 2010,
the world’s rice production was 672 million tons which
have been produced in 114 rice growing countries of the
world (FAOFOODS, 2004). Gilan province is considered
Received date: 2016-09-17 Accepted date: 2016-09-26
*Corresponding author: B. Hosseinzadeh Samani, Department of mechanical engineering of biosystem, Shahrekord University, Iran Tel: +989132075881.
Email: [email protected]
as one of the most important rice-producing provinces in
the country, the province produces more than 30% of the
country's rice. The characteristics of rice cultivation in
Gilan province is the diversity of cultivars cultivated by
rice producers. One of the problems about rice is sharp
price fluctuations and its traditional marketing system
which often creates irreparable damage for rice producers.
Thus, providing a method for rice pricing based on its
physical characteristics in a way that price of this product
to be same in the whole country can help producers and
consumers of this product. One of the important aspects
of distinguishing rice plant compared to other cereals is
qualitative and economic importance or marketability of
this product. Unlike the other grain products, healthy and
completeness of the grains are important about rice. One
of the basic criteria in the production of rice is amount of
complete and not broken form. This index strongly
affects the economic value of rice, as the economic value
of healthy grains is almost twice the broken grains in
various stages of production (Siebenmorgen et al., 1998).
Typically, two major indicators including degree of
milling and broken grains percent are raised to determine
the quality of rice grains among the manufacturers and
producers of grains. Investigating these criteria is mainly
done visually and empirically in factories by workers of
conversion lines. That is, a person evaluates the quality of
product by looking at output product samples of
conversion machines and reviewing the above-mentioned
indexes depending on his skill and experience of working
with rice production systems in factories and exerts the
required changes in the conversion system if necessary.
Traditional methods of sensory evaluation are widely
used in determining the quality of food, but these
methods are time consuming and expensive. Also, human
physical conditions like fatigue or psychological
conditions can affect the end result. These factors
motivate the development of alternative methods that
evaluate the key characteristics of product in shorter time
with more accuracy. One of the methods used is the
machine vision method that the image features can be
extracted with the help of the method and carried out the
classification or quality assessment of the product
according to it (Gonzales and Wintz, 1987). Many studies
have shown that image processing technique has been
successfully used for grading process of agricultural
production (Lleó et al., 2011; MakkySoni, 2013). Given
that rice allocated the bulk of the country agriculture to
itself, but there is still no an appropriate grading process
in the country to improve the quality of grading for this
product; therefore, image processing and fuzzy logic are
ideas that can be used for automatic grading of
agricultural products with high quality and precision.
Now, a lot of separation and grading systems of
agricultural products are done by human based on human
judgments) Winter et al., 1996). Manual fruit grading
causes fatigue and eye strain and also causes problems in
the quality of fruits’ grading which results from
differential diagnosis of individuals (Gonzales and Wintz,
1987). While this is continuously done in the vision
system during the very long time; in other words, it can
guarantee that the entire timeframe is used for reviewing
the products (Bato et al., 1999). The benefits of reviewing
and grading of automatic separation systems such as
machine vision systems have been proven for separating
many product as an alternative to the traditional
separation method (Bato et al., 1999).
Image processing is an effective and non-destructive
tool of technology for preparation and analysis of image
from a real scene via computer to acquire information or
control a process. An obvious example of image
processing applications is the food industry. Image
characteristics can be extracted by using the image
processing, and it is used to detect and identify the quality
of products. Researchers have used the apparent color of
the fruit as maturation index to classify the product in
numerous reports (Blasco et al., 2009; Nogales-Bueno et
al., 2014; Pedreschi et al., 2006). Pabamalie et al
extracted both events and colored features matrix from
images of different cultivars of rice and carried out the
classification by using a neural network. The result of this
study was precision between 68% and 94% for the four
different cultivars of rice (Pabamalie and Premaratne,
2011). Liu et al provided a method for the classification
of six cultivars of paddy rice by using color and shape
properties. In this paper, seven colorful features and forty
morphological features have been extracted from each
type of paddy rice, 17 features have been introduced as
superior characteristics by using the correlation between
features. The precision of this method has been reported
88.3% (Liu et al., 2005). (Verma, 2010) used the
morphological features derived from images of rice
grains including perimeter, area, length, compression and
elongation to classify rice grains by using MLP neural
network. He reported that machine vision system used is
able to classify rice grains in normal, cracked, plaster,
Because of benefits such as reduced labor costs,
higher accuracy, providing proven results in different
conditions, the use of machine vision method has been
quickly replaced by manual methods (Jelinski et al.,
2007). Dehrouyeh developed a system based on machine
vision and fuzzy logic for automatic grading of eggs.
Information on the various qualitative parameters of eggs
including size, crack on the shell, breakage, degree of dirt
and blood spots was calculated by using image processing
algorithm and placed at the disposal of a fuzzy controller.
Fuzzy controller, in which an inference system based on
the expert opinion had been used, calculated the final
grade of eggs according to data from the images and
moved a controller channel by programmable logic
controller proportional to the recognized grade. Results
obtained of his research showed that the developed
system can properly grade the eggs with precision 95.4%.
He also reported that the overall time of implementing the
control process from the moment of announcing the
product grade by the separation algorithm to moment of
full stop of grading channel was equal to 1.87 seconds in
average (Dehrouyeh et al., 2010). Omid used the
acoustics method and fuzzy logic to develop a grading
system of pistachio. In his study, the decision tree was
used in order to develop the rules. The results showed
that the developed system has capability to accurately
diagnose of product with the accuracy of 95.27% (Omid,
2011). Kavdir and Guyer used the fuzzy logic for grading
apples as offline. They had graded apples in terms of
indicators such as color, external defects, shape, weight
and size (Kavdir and Guyer, 2004). Soft computing is a
new computational method that brings together the salient
abilities of human mind for reasoning and learning in
uncertain and imprecise environment. Study of previous
research shows that methods based on fuzzy logic have
the ability to simulate human behavior in uncertain
decision making about the diagnosis and determining the
quality of food products. Given that broken grains percent
and color of rice grain determine the quality and rice
prices for each cultivar, but a little diversity of prices is
available for buying any cultivars. The aim of this study
is to grade the rice according to attributes such as color
and size and then, a reasonable price to be considered
with regard to product quality by designing a grading
system based on fuzzy logic to simulate the behavior of
an expert in the evaluation and classification of physical
properties of rice grains. In this case, the buyer can select
his desired product according to taste and purchasing
power, and this leads to attracting the customers
satisfaction.
2 Materials and methods
2.1 Samples preparation
Considering the primary reviews conducted in rice
processing plants in north of the country, it was found
that human experts used five linguistic variables "very
low", "low", "medium", "high" and " very high " to judge
on both quality indices used in this study i.e. (broken
grains percent and degree of milling). As a result, due to
the combination of these variables for both indices i.e.
degree of milling and broken grains percent, 250 samples
with different quality conditions which include all
possible qualitative modes for the rice grains were
prepared. Rice moisture was measured by using a digital
moisture meter (GMK model 303 RS, Korea) that was
determined for the examined samples of 11%-13.5%. In
order to prepare the samples, 5 kg brown rice of Hashemi
cultivar which is the common and local cultivar of rice in
the north of Iran was initially prepared. The samples were
converted into white rice using a laboratory rice whitener
(SATAKE, Model JNMS15, Japan). To achieve the
desired degrees of milling, duration of whitening was
changed by laboratory whitener. Then, samples’ degree
of milling was measured using a digital milling meter
device (KM, Model C-100, Japan) used in the Rice
Research Institute of Iran. After preparation of the
samples with different degrees of milling, samples related
to each degree of milling were divided into five sections
so that five different levels of broken grains were
at first the broken grains in the milled samples were
completely isolated from the sound grains using a
laboratory rotary sieve (SATAKE, Model TRG 5A, Japan)
with a groove size of 3 mm and . The range of broken
grains obtained from the results of evaluations conducted
in rice mills in north of the country. Five different
positions were created in terms of broken grains in the
samples. After preparing 250 samples with different
quality conditions, samples were labeled and referred to
different rice field factories in Gilan province to evaluate
and determine the ratings by skilled experts. The process
of quality assessment was performed by people who work
with the rice processing machines through filling a
questionnaire which was prepared for this purpose. After
collecting the questionnaire forms and via averaging the
opinions of experts, 25 product samples were graded.
2.2 Imaging
Images were captured from each 250 sample products
in the same illumination condition. A digital camera
(Canon power Shot SX520 HS, Japan) was used with a
resolution of 16 megapixels to obtain images of rice grains.
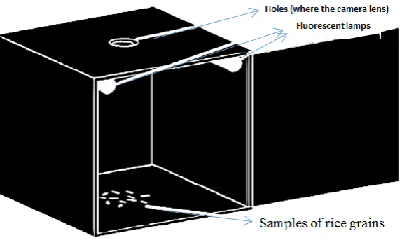
A cube-shaped chamber was used for imaging that its
inside was completely black. Also, two rod-shaped
fluorescent lamps with a power of 18 watts, optical gain 38
lmw -1, coefficient of color resolution 67 CRI and life of
5000 h were installed on both sides of the box and in the
near box roof. There was also a hole in the middle of the
roof on which the camera lens was placed. Thus, imaging
was done without any interference of light from outside.
The height of camera in the compartment was 20 cm. A
schematic of the imaging system is shown in Figure 1.
Figure 1 A schematic of the box used for imaging
2.3 Image processing of grains
The captured images were transferred to a computer.
In the next step, for the improvement of images quality,
rice image was separated from background and its color
and size was measured using MATLAB software and
image processing methods.
Each image processing algorithm included functions
and operators that extract special features of image using
the data of each pixel of the digital image and provide it
basis for decision-making. At first, the grains were
separated from the main background by performing the
preprocessing and image optimization. Then, the images
were prepared for final processing and extraction of the
desired quality indicators. With regard to the quality
properties in this study, the important features which
should be processed and measured in the captured images
include the total number of grains in the image, the
number of broken grains in the image, and degree of
milling. After obtaining the total number of grains in the
image, the morphological and dimensional characteristics
of each identified grain (including main axis length,
minor axis length and area) were measured using pixels
data related to each grain (Courtois et al., 2010). Then,
according to the provided standards (Iran National
Standard No. 127) that announced the length of broken
grain is less than three-quarters of the length of healthy
grain and definition of this standard index to the desired
image processing algorithm, the number of broken and
intact grains in each image was calculated. The ratio of
broken grains to the total grains (NPBK) was calculated
using Equation (1) (Payman et al., 2014).
(1)
In which Nbk is the number of broken grains and Nt
is the number of total grains in the image.
The main steps of leading the app to classify rice
have been provided as a template in the following (Figure
Figure 2 Major stages of program progress for the
classification of rice using image processing
In order to evaluate the performance of algorithm in
determining the number of broken grains (PBK), 100
grains of rice were placed manually in imaging chamber.
The length of this grain was measured using a digital
caliper and recorded before imaging. The experiment was
replicated 10 times. After comparing the values obtained
for PBK in manual measurement and image processing
method, the precision of image processing algorithm to
determine the PBK was determined via Equation (2).
( (
| |
)) (2)
In which Abk is the precision of image processing
algorithms in determining the PBK (%), Pm and Pip are
PBK values obtained by manual measurement and image
processing algorithms respectively.
To measure the degree of milling (DOM) grains,
intensity of white rice grains in each image recorded was
measured by the camera. Precision of image processing
algorithms to determine the DOM was calculated using
Equation (3).
( (
| |
)) (3)
Where Adm is the precision of image processing
algorithms to determine the DOM (%), Dwm and Dip are
the degree of milling obtained by manual measurement
and image processing algorithm respectively.
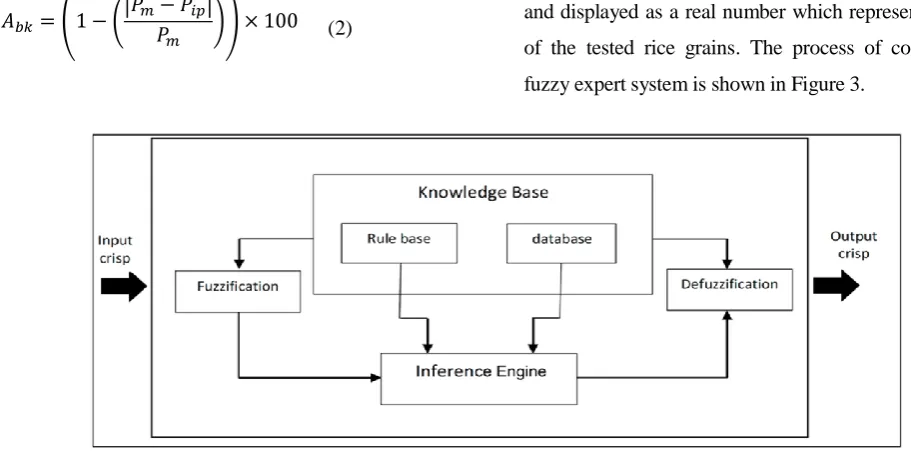
2.3 Development a fuzzy model
Fuzzy inference system was implemented in the fuzzy
toolbox of MATLAB software (MATLAB 2011). The
input variables of the fuzzy system designed in this study
were degree of milling (DOM) and percentage of broken
grains (PBK) that were obtained from an image processing
algorithm as a real numbers. The fuzzy system initially
converted this definite numbers to the fuzzy values. Then,
the (minimum) Mamdani fuzzy rules were imposed using
the product inference engine and the necessary processing
carried out on them. Finally, the result was defuzzified by
the center of maximums (COM) defuzzification method
and displayed as a real number which represents the price
of the tested rice grains. The process of constructing a
fuzzy expert system is shown in Figure 3.
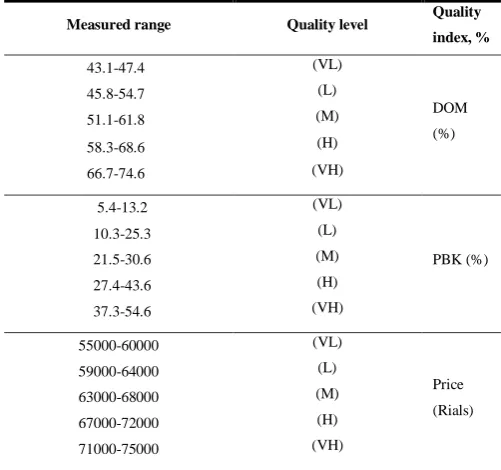
At first, five membership functions, namely very
low, low, medium, high and very high were considered to
write the fuzzy inputs for degree of milling and percent of
broken grains in the ranges of 43.1%-47.4%,
45.8%-54.7%, 51.1%-61.8%, 58.3%-68.6% and
66.7%-74.6% for degree of milling, and 5.4%-13.2%,
10.3%-25.3%, 21.5%-30.6%, 27.4%-43.6% and
37.3%-54.6% for the percentage of broken grains. In
general, given the number of input linguistic variables, 25
rules were obtained with the AND logical operator. As
well as, five membership functions including very low,
low, medium, high and very high were considered as
Rials for output of the fuzzy system in the ranges of
(55000-60000), (59000-64000), (63000-68000),
(67000-72000) and (71000-75000). These ranges were
selected based on assessments performed on production
quality of rice in the rice mill factories in north of the
country. In this research, two variables i.e. degree of
milling the grains and percent of broken grains were used
for pricing the product in the introduction of fuzzy rules.
Because the two variables were used simultaneously in
the decision-making fuzzy, the AND logical operator was
used for the development of fuzzy rules. After
determining the appropriate ranges for variables,
membership functions were determined for the fuzzy
inference systems. Accordingly, five membership
functions (MFs) in fuzzy inference system were
considered for the input and output variables. The
membership function is a curve which defines the
mapping the each point of input space to a membership
value (degree of membership) between 0 and 1. The
simplest membership function is composed of the straight
lines. This is the triangular membership function which called “trimf”. The trapezoidal membership function is called “trapmf” which is actually a triangle function
cropped from above. These two membership functions
benefit the advantage of simplicity. A defuzzifier
converts the fuzzy results obtained from inference to
definite outputs. There are many different methods of
fuzzification such as the center of gravity (COG), mean
of maximum (MOM), smallest of maximum (SOM),
largest of maximum (LOM), center of maximum (COM)
and center of area (COA) that the method of COA was
chosen in this study as one of the most common methods
of fuzzification to perform the process of fuzzification. In
order to evaluate the developed model, the results
obtained from image processing algorithms for 250 rice
samples were given to fuzzy system designed in this
study for pricing, and the results obtained from fuzzy
logic were compared by an expert with the results of
product pricing.
3 Results and discussion
The results of the laboratory analysis to determine
the level of DOM, PBK and product prices are presented
in Table 1. These values were identified at different rice
mill factories in Gilan province according to surveys
obtained from five experienced experts. Changes of
indexes DOM, PBK and product price were from very
low to very much respectively, roughly in the ranges of
43%-75%, 5%-55% and 55000- 75000 Rials.
Table 1 Results of the laboratory analysis to
determine the level of DOM, PBK and product prices
Measured range Quality level Quality
index, %
43.1-47.4 45.8-54.7 51.1-61.8 58.3-68.6 66.7-74.6
(VL) (L) (M) (H) (VH)
DOM (%)
5.4-13.2 10.3-25.3 21.5-30.6 27.4-43.6 37.3-54.6
(VL) (L) (M) (H) (VH)
PBK (%)
55000-60000 59000-64000 63000-68000 67000-72000 71000-75000
(VL) (L) (M) (H) (VH)
Price (Rials)
3.1 Investigation of the image processing algorithm
The program related to image processing operations
following. The desired image was recalled. After
recalling, the image was converted to binary ones using
im2bw function. Then, noises in the image were removed
with the bwareaopen function, so that only the image of
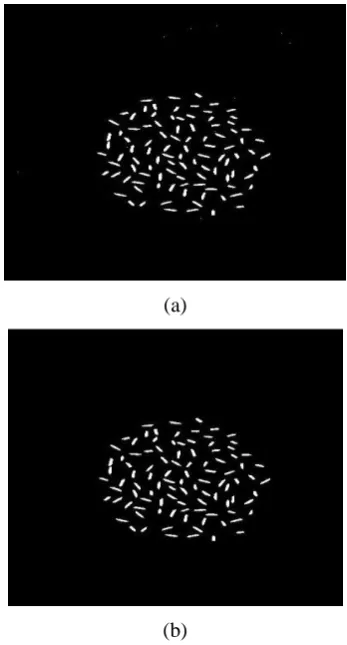
rice grains was remained. Figure 4 shows the sample of
rice binary image, and the image after executing the
bwareaopen function respectively by MATLAB software.
(a)
(b)
(a) Binary Image of rice grains (b) Image of rice grains after execution of bwareaopen function
Figure 4 Sample of rice grains image processing
Bwlabel function was used to count the rice grains,
in which n was the number of rice grains in the image.
The total number of rice grains was 100 in Figure (4-b).
To calculate the percentage of broken grains, the
number of broken grains in the image was obtained and it
was divided by the total grains in the image. In the
sample image (Figure 4-b), the number of broken grains
was 45 and the number of healthy grains was 55 and the
percentage of broken rice grains in the above image was
obtained 45%. To calculate the length of rice grains, the
length of Hashemi cultivar of rice was initially measured
in terms of millimeters with a digital caliper and then, the
length of the same grains was measured in terms of pixels
in MATLAB software environment. Then, values
obtained were entered in the CurveExpert software and its
corresponding equation was obtained. According to this
equation, the length obtained in millimeters can be
converted to its corresponding pixel. The average length
of whole grain of Hashemi cultivar of rice was equal to
7.47 mm that of this value was 5.6 mm which is
considered same as the length of broken grain.
The equation obtained to convert the length of rice
in millimeters to pixels is y= 9/0467x + 18/588 with
R2=0.9216 and S=1.3912 where X is the length of rice in millimeters and Y is the length of rice in pixels (Figure 5).
Figure 5 Conversion of grains length from millimeters to
pixels.
In the next step, rice grains’ degree of milling should
be determined. To do this, the desired image should be
converted to gray scale and then, the created matrix
should be used equal to brightness level or intensity. A
command was written in a for loop in MATLAB to obtain
the amount of brightness in which each pixel apart from
rice grains pixels in the image was equal to zero,
otherwise it placed the same pixels in the matrix.
Consequently, a matrix was obtained which included only
the pixels related to rice grains and brightness level of
rice was obtained by averaging these numbers. Finally,
the program written was tested for 250 images of rice and
result was obtained with precision of 92%. Then, the
results of image processing algorithms in fuzzy inference
results of fuzzy inference systems were determined as the
desired output variable which is the product price.
3.2 Formation of FIS
Fuzzy inference system had two inputs including the
degree of milling and percentage of broken grains and
one output (product price). The related ranges of each
listed factors were prepared in questionnaire forms
according to expert opinion and determined in Table 1.
Then, the related rules were also defined according to
certified experts which provided in Table 2. These rules
were applied for communication between input and
output variables. In this system, the Mamdani method and
triangular MF (trimf) were used.
The process of defining MFs for evaluated indices
and determining the fuzzy rules for qualitative grading of
rice grains in MATLAB software is shown in Figure 6.
Figure 6 Overall form of the membership functions for
PBK
According to the opinion of experts, the samples
were classified to five classes (s1-s2-s3-s4-s5). Several
images were prepared from each sample, and the degree
of milling for each sample was obtained in image
processing algorithms. Through averaging the results
obtained of image processing algorithm for each sample,
intervals were specified in terms of intensity index in
image processing algorithm that the values for each
samples s1-s2-s3-s4-s5 were (161-166) - (159-163) -
(156-160) - (154-158) - (150-155), respectively.
Intervals obtained in the image processing algorithm
were used in the fuzzy inference system which its results
can be seen in Figure 7.
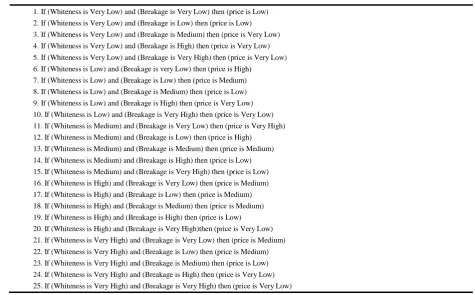
Table 2 Fuzzy rules used for creating a relationship between the input and output variables
1. If (Whiteness is Very Low) and (Breakage is Very Low) then (price is Low) 2. If (Whiteness is Very Low) and (Breakage is Low) then (price is Low) 3. If (Whiteness is Very Low) and (Breakage is Medium) then (price is Very Low) 4. If (Whiteness is Very Low) and (Breakage is High) then (price is Very Low) 5. If (Whiteness is Very Low) and (Breakage is Very High) then (price is Very Low) 6. If (Whiteness is Low) and (Breakage is very Low) then (price is High)
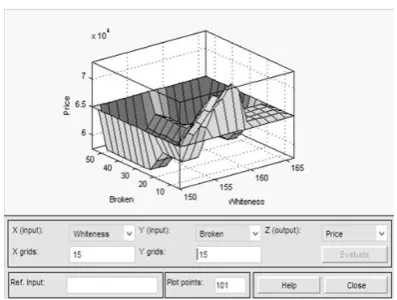
Figure 7 Surface viewer of the fuzzy rules in MATLAB
software considering DOM and PBK as input variables
The graphic relationship of displaying the levels
offers very useful information about issues with two
inputs and one output. It can be seen in Figure 7 that how
two input values (degree of milling the grains and
percentage of crushed grains) affect one output value
(product price); i.e. reaction can be seen in a single view.
After creating the fuzzy sets and determining the fuzzy
rules, pricing the rice grains that which had already been
done by certified experts was compared with values that
was prepared through using the model based on fuzzy
logic. Figure 8 shows the evaluation of fuzzy rules in the
fuzzy model provided in MATLAB software environment.
This Figure shows the fuzzy model output with respect to
degree of milling and percentage of broken grains in
(Medium) and (Very-Low) ranges respectively. In such
circumstances, the model output (product price) is located
in (Very-High) range. This result is consistent with the
basic definitions of fuzzy rules.
Figure 8 Evaluation of the developed fuzzy model in
MATLAB software.
As seen in Figure 8, if the degree of milling of rice
grains is medium (57) and the percentage of broken
grains is very low (9), the product price will be very high
(73000 rials). Through analyzing the model and expert
opinion, it was found that the product value decreases by
increasing the percentage of broken grains; but because
there is a certain level of this index about the degree of
milling grains in which the product quality is desirable in
terms of producers, thus increasing the degree of milling
increases the product price to a certain extent. In order to
evaluate the fuzzy model, specifications related to the
intensity and size characteristics of samples which their
price were determined by certified experts according to
two desired quality indices were calculated by using
image processing algorithm and used as input in fuzzy
model. The results of comparing these two methods and
evaluating the precision of fuzzy grading model have
been provided in Table 3.
The results obtained showed that the fuzzy model
used in the research had good predictability for
determining the price of rice grains. The percentage of
diagnosis thee correct model to estimate the price of rice
grains in the ranges "very low", "low", "medium", "high" Table 3 Results of evaluation of the fuzzy grading model
Percentage Sample
number (VH) (H) (M) (L) (VL) Fuzzy grading
90% 50 0 0 0 5 45 (VL)
92% 50 0 0 3 46 1 (L)
86% 50 0 4 43 3 0 (M)
92% 50 2 48 2 0 0 (H)
and "very high" was obtained 90%, 92%, 86%, 92%, and
100% respectively.
4 Conclusions
According to the developed algorithm, it became clear
that the written image processing algorithm has high
precision and accurate results were achieved from it in
most images. Also, the quality of the studied rice can be
realized by obtaining the percentage of breakage and
brightness level of rice that this would be very effective in
the classification and pricing the rice by using fuzzy
inference system and an acceptable rate can be determined
for it based on the rice quality. In this study, a model based
on fuzzy logic was developed and used successfully as a
decision support method for pricing the rice grains. The
results of pricing through fuzzy logic indicated good
overall matching with results obtained from product
pricing by the expert (overall accuracy of 92%). It was also
observed that the selection of two indices i.e. degree of
milling grains and percentage of the broken grains was
suitable for pricing the rice product.
References
Bato, P., M. Nagata, Q. Cao, B. P. Shrestha, and R. Nakashima. 1999. Strawberry sorting using machine vision. Proceeding of ASAE: Paper, 993162.
Blasco, J., N. Aleixos, S. Cubero, J. Gomez-Sanchís, and E. Molto. 2009. Automatic sorting of satsuma (Citrus unshiu) segments using computer vision and morphological features.Computers and Electronics in Agriculture, 66(1):1-8.
Dehrouyeh, M., M. Omid, H. Ahmadi, S. Mohtasebi, and M. 2010. Grading and quality inspection of defected eggs using machine vision. International Journal of Advanced Science and Technology, 16:23-30.
FOODS, M.H.I. 2008. Food and Agriculture Organization of the United Nations.
Gonzales, R. C., and P. Wintz. 1987. Digital image processing. Addison-Wesley Longman Publishing Co., Inc.
Jelinski, T., C. J. Du, D. W. Sun, and J. Fornal. 2007. Inspection of the distribution and amount of ingredients in pasteurized cheese by computer vision. Journal of Food Engineering,
83(1):3-9.
Kavdir, I., and D. E. Guyer. 2004. Apple grading using fuzzy logic.
Turkish Journal of Agriculture and Forestry, 27(6):375-382. Lleó, L., J. M. Roger, A. Herrero-Langreo, B. Diezma-Iglesias, and
P. Barreiro. 2011. Comparison of multispectral indexes extracted from hyperspectral images for the assessment of fruit ripening. Journal of Food Engineering, 104(4):612-620. Liu, Z. Y., F. Cheng, Y. B. Ying, and X. Q. Rao. 2005.
Identification of rice seed varieties using neural network. Journal of Zhejiang University. Science. B, 6(11):1095. Makky, M., and P. Soni. 2013. Development of an automatic
grading machine for oil palm fresh fruits bunches (FFBs) based on machine vision. Computers and Electronics in Agriculture, 93(2):129-139.
Nogales-Bueno, J., J. M. Hernandez-Hierro, F. J. Rodríguez-Pulido, and F. J. Heredia. 2014. Determination of technological maturity of grapes and total phenolic compounds of grape skins in red and white cultivars during ripening by near infrared hyperspectral image: a preliminary approach. Food Chemistry, 152(1):586-591.
Omid, M. 2011. Design of an expert system for sorting pistachio nuts through decision tree and fuzzy logic classifier. Expert Systems with Applications, 38(4):4339-4347.
Pabamalie, L., and H. Premaratne. 2011. An intelligent rice quality classifier. International Journal of Internet Technology and Secured Transactions, 3(4):386-406.
Payman, S. H., I. Bagheri, and H. Zareiforoush. 2014. Milling characteristics of rice grains as affected by paddy mixture ratio and moisture content. International Journal of Biosciences (IJB), 4(2):87-97.
Pedreschi, F., J. Leon, D. Mery, and P. Moyano. 2006. Development of a computer vision system to measure the color of potato chips. Food Research International,
39(10):1092-1098.
Siebenmorgen, T., Z. Nehus, and T. Archer. 1998. Milled Rice Breakage Due to Environmental Conditions 1. Cereal Chemistry, 75(1):149-152.
Verma, B. 2010. Image processing techniques for grading & classification of rice. in Computer and Communication Technology(ICCCT), International Conference onIEEE.
Winter, P., S. Sokhansanj, H. C. Wood, and W. Crerar. 1996. Quality assessment and grading of lentils using machine vision. Canadian Society of Agricultural Engineering Annual Meeting at the Agricultural Institute of Canada
Annual Conference.