RESEARCH
Where do people purchase food?
A novel approach to investigating food
purchasing locations
Lukar E. Thornton
*, David A. Crawford, Karen E. Lamb and Kylie Ball
Abstract
Background: Studies exploring associations between food environments and food purchasing behaviours have been limited by the absence of data on where food purchases occur. Determining where food purchases occur rela-tive to home and how these locations differ by individual, neighbourhood and trip characteristics is an important step to better understanding the association between food environments and food behaviours.
Methods: Conducted in Melbourne, Australia, this study recruited participants within sixteen neighbourhoods that were selected based on their socioeconomic characteristics and proximity to supermarkets. The survey mate-rial contained a short questionnaire on individual and household characteristics and a food purchasing diary. Par-ticipants were asked to record details related to all food purchases made over a 2-week period including food store address. Fifty-six participants recorded a total of 952 food purchases of which 893 were considered valid for analysis. Households and food purchase locations were geocoded and the network distance between these calculated. Linear mixed models were used to determine associations between individual, neighbourhood, and trip characteristics and distance to each food purchase location from home. Additional analysis was conducted limiting the outcome to: (a) purchase made when home was the prior origin (n. 484); and (b) purchases made within supermarkets (n. 317). Results: Food purchases occurred a median distance of 3.6 km (IQR 1.8, 7.2) from participants’ homes. This distance was similar when home was reported as the origin (median 3.4 km; IQR 1.6, 6.4) whilst it was shorter for purchases made within supermarkets (median 2.8 km; IQR 1.6, 5.6). For all purchases, the reported food purchase location was further from home amongst the youngest age group (compared to the oldest age group), when workplace was the origin of the food purchase trip (compared to home), and on weekends (compared to weekdays). Differences were also observed by neighbourhood characteristics.
Conclusions: This study has demonstrated that many food purchases occur outside what is traditionally considered the residential neighbourhood food environment. To better understand the role of food environments on food pur-chasing behaviours, further work is needed to develop more appropriate food environment exposure measures. Keywords: Food environment, Food purchasing, Neighbourhood, Built environment, Geographic information system (GIS)
© The Author(s) 2017. This article is distributed under the terms of the Creative Commons Attribution 4.0 International License (http://creativecommons.org/licenses/by/4.0/), which permits unrestricted use, distribution, and reproduction in any medium, provided you give appropriate credit to the original author(s) and the source, provide a link to the Creative Commons license, and indicate if changes were made. The Creative Commons Public Domain Dedication waiver (http://creativecommons.org/ publicdomain/zero/1.0/) applies to the data made available in this article, unless otherwise stated.
Background
The potential influence of neighbourhood factors on food purchasing and consumption has received growing atten-tion, however empirical evidence remains inconclusive
[1–3]. One of the reasons for this is that research has employed a range of different measures of food store access [4–6]. Two measures are commonly used: proxim-ity to the nearest store, and the count of stores within a neighbourhood [1, 3, 7, 8]. Proximity measures typically ignore other store options nearby, whilst count meas-ures are often limited to specific store types and apply a dichotomous categorisation to stores as being either
Open Access
*Correspondence: lukar.thornton@deakin.edu.au
accessible (within buffer) or not accessible (outside the buffer). Furthermore, when buffers are used there is little consensus on an appropriate buffer size, which is impor-tant as associations with food behaviours have been shown to be dependent on this [4].
Two additional limitations are common in many stud-ies. First, exposure measures have been limited to a single context, most often within the residential neighbour-hood. This ignores the multiple places people visit on a daily basis such as work, schools, and recreational set-tings. Second, existing measures also assume that all indi-viduals within a particular neighbourhood have an equal ability to access facilities [9] and do not factor in other individual (e.g. cultural, socioeconomic, demographic and mobility) and environmental (e.g. public transport) factors which may influence food store choice [10]. As it stands, there are limited solutions to these problems as appropriate data on where people typically purchase foods to inform such measures are scarce.
A small but growing number of studies internationally have attempted to establish the spatial locations of habit-ual food purchasing patterns, both among adolescents [11, 12] and adults [13–19]. These studies have broadly concluded that many food purchasing behaviours occur beyond the boundaries of the residential neighbourhood or in stores that are not considered the most proximate to home. For example, Kerr et al. extracted food shopping trips from travel diary data in the US and found return trips between home, the food store, and home again were 5.37 mile (~8.64 km) in length and that trips to grocery stores were on average a distance of 4.67 mile (~7.52 km) from the trip origin, which may have been home, work, or some other location [19]. Whilst this body of work suggest that the access measures commonly applied may be too restrictive, further details related to food purchas-ing behaviours are required to help understand potential influences.
This paper presents findings from a novel data collec-tion methodology which captured data on food purchas-ing locations and characteristics associated with food purchasing behaviours over a 2-week period. Data were mapped and distances calculated between the household address and food purchase locations. This study sought to explore purchase location relative to household address. Additional analysis examined whether purchase locations varied by characteristics of the individual, their neigh-bourhood and the food purchase trip. All food purchases, food purchases made when home was the trip origin, and supermarket purchases were examined separately. Those purchases made when home was the prior location may reflect habitual purchase behaviours that are less likely to be influenced by incidental travel (e.g. to social outings outside of their neighbourhood) and may be more likely
to be influenced by neighbourhood food resources. Pur-chases made at supermarkets were also examined sepa-rately as supermarkets are the predominant location for food expenditure in Australia [20] and therefore have major influence on overall eating behaviours.
Methods Study sites
This study was conducted within four local governments areas (LGAs) located to the east of the Melbourne CBD (Australia’s second largest city). Four Statistical Area Level 1 (SA1) administrative units were chosen within each LGA [average SA1 size within the four selected LGAs: 401 people (SD = 127), 0.215 km2 (SD = 0.35)]. The SA1s were sampled based on: (1) area-level socio-economic disadvantage defined by the Australian Bureau of Statistics (ABS) Socio-Economic Indexes for Areas (SEIFA) Index of Relative Socio-Economic Disadvantage (IRSD) [two SA1s in the lowest quartile (low disadvan-tage termed “high socioeconomic status” (SES)) and two in the highest quartile (high disadvantage termed “low SES”)]; and (2) by access to supermarkets (high access: neighbourhoods with two or more Coles or Woolworths (two largest chains (~70% supermarket market share [21]) supermarkets within 2 km; and low access: neigh-bourhoods with no Coles/Woolworths supermarkets within 2 km). In each LGA, a SA1 was drawn from each quadrant of: low SES-low access; low SES-high access; high SES-low access; high SES-high access. This approach was employed to seek greater heterogeneity amongst par-ticipants in terms of socioeconomic and food environ-ment characteristics. Whilst other supermarket chains (e.g. Aldi, IGA) and food store types (e.g. greengrocers) were present in the study region, the access measure was limited to the two dominant chains. However, even when limiting to these two chains, within one of the LGAs, no low SES-low access SA1s could be identified using the criteria above. In this instance the low SES SA1 located furthest (1.4 km) from the nearest (Coles/Woolworths) supermarket was used to represent low SES-low access in this LGA.
Data collection
food purchases. The delivered material was addressed to the main household food purchaser and this person was also required to complete a short questionnaire on their personal and household characteristics (e.g. age, sex, household composition, income). As a gesture of thanks, those who returned valid food purchasing diaries received a $20 gift voucher for a leading retailer and were entered into a prize draw for one of two $100 vouchers.
Food purchasing diary and survey
Within the food purchasing diary, participants were required to record details of all food purchases made over a 2-week period. This included foods made for immediate consumption, restaurant meals, and foods bought to be consumed later including packaged foods. Details to be reported included the date, name and address of store, where they were prior to making the purchase (home, work, other), primary mode of transport to the store (car, public transport, walk/cycle, other, or was home deliv-ered), and what foods they purchased. The diary allowed for multiple purchases to be recorded on any given day and participants were to report if no food was purchased on a particular day.
The specific food items purchased could be recorded in one of two ways. First, participants could record what was purchased by ticking boxes against the categories listed in Additional file 2: Table S1. Second, participants had the option of attaching receipt data. Receipts were later coded against the same categories. Instructions noted that the purchase of multiple items from the same store should be recorded (e.g. hot fast food/takeaway and soft drink). Participants were asked to specify what the “other” item was when this box was checked. Many of these items were able to be recoded into one of the existing categories and therefore the “other” category was not examined further in analysis. Bottled water was also not examined due to the low number of purchases of this item.
Sample and food purchase records
Fifty-six participants returned valid food purchasing dia-ries [quadrant break-down: low SES-low access (n = 11 participants); low SES-high access (n = 11); high SES-low access (n = 19); high SES-high access (n = 15)]. The majority of respondents were female (80%) with fewer participants in the youngest age bracket [18–34 years (20%); 35–54 years (36%); 55 years or over (41%)] (two participants did not report their sex or age).
The 56 participants recorded a total of 952 food pur-chases. The within-participant average total number of purchases made across the 2 weeks was 16.1 (SD = 7.6) at an average of 10.6 (SD = 5.2) different stores. Out of the 14 days, participants recorded purchases on an average of 9.0 (SD = 2.6) days. Whilst a slightly higher percentage of
all purchases were recorded on Day 1 (11.8%) of the data collection period, purchases were generally spread evenly across the remaining days ranging from 5.3% of all pur-chases on Day 10 to 9.1% of purpur-chases on Day 3. On Day 14, 6.9% of all purchases were recorded. This indicates that participants continued to report food purchases across the entire study period.
Distance to food purchase location
Each participant’s household address (recorded in the con-sent form and stored separately to the survey) and where they made their food purchases were geocoded in ArcGIS 10.2 [22]. Store name and addresses recorded by partici-pants were verified against online resources to supplement address information where required or to verify the full address. Of the 952 food purchases recorded, 916 were able to be geocoded (96.2%) with those not geocoded due to insufficient store details provided (n = 28) or because the purchase occurred interstate and was not considered a regular purchase location (n = 8). The shortest network path [8] between household address and food purchase location was calculated using the Network Analyst exten-sion in ArcGIS. Pedestrian network paths were used for when the mode of travel was recorded as walking/cycling whilst street networks were used for all other modes.
Statistical analysis
Data were examined for outliers and distances greater than 35 km (~21.7 mile) were excluded from analysis as these were considered locations that were less likely to be part of a regular routine (n = 24; 2.6% of geocoded purchases; distance range 47.3–248 km). This left a final sample of 893 food purchases. The distance between home and food purchase location was examined for all purchases and for two additional dependent variables: (1) distance between home and food purchase loca-tion for purchases made when home was reported as the prior location; and (2) distance between home and food purchase location for purchases within supermar-kets. Supermarket purchases were defined as purchases within the four largest supermarket chains in Australia which have over 91% of the market share (Coles (market share 32.5%), Woolworths (37.3%), Aldi (12.1%), and IGA (9.7%) [21]). These stores were determined by the store name recorded by participants.
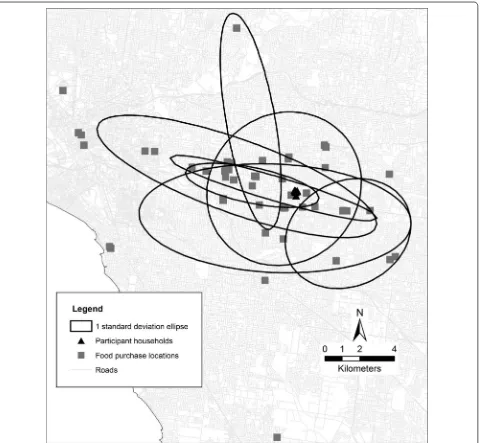
To visualise the dispersion of purchase locations amongst individuals within the same neighbourhood (SA1), ArcGIS 10.2 was used to create a map with all purchase locations for a single SA1. Added to this were individual-specific standard deviation ellipses which represent the dispersion of purchase locations around the mean centre of these for each of the seven individu-als who returned food purchasing diaries from this SA1. Standard deviation ellipses are a common way to repre-sent dispersion of locations and are increasingly applied to studies exploring health behaviours or access to health services [14, 23, 24]. A one standard deviation ellipse was used which captures 68% of all food purchase locations for each individual. In the example SA1, the minimum number of unique purchase locations for an individual was five meaning a sufficient number of unique points were available to generate the ellipses. Household loca-tions were not considered in the generation of these ellip-ses as the ellipellip-ses were created to visualise the dispersion of regular purchase locations which may or may not be near the household location. Food purchase locations are counted each time a purchase is made at that loca-tion. This essentially weights a location based on the fre-quency of trips to that location to purchase food.
Prior to inferential statistical analysis, all distance out-comes were log transformed to account for the skewness in the data and results are presented on these log trans-formed values. Linear mixed models were used to deter-mine associations between individual, neighbourhoods, and trip characteristics and distance to each food pur-chase in Stata 14.0 [25] (Table 2). This three-level mul-tilevel analysis examined each purchase accounting for the nesting of purchases individuals and within-areas (SA1s). Both the fixed effects and the level of clus-tering within-individuals and within-SA1s are reported. The clustering [intraclass correlation (ICC)] of purchase distance from home within-individuals and within-SA1s were estimated as part of the mixed effect models. The two ICC values presented are the proportion of the total variance in distance from home that is accounted for by the clustering within-individuals and within-SA1s. Essen-tially the ICC represents the correlation in the outcome within each cluster. One limitation when interpreting these is that the outcome assessed is distance from home and therefore it is not estimating if the same stores were visited but rather whether the stores visited were a simi-lar distance from home. Two models were fitted for each of the three outcomes (Model 1: Null; Model 2: inclusive of individual characteristics (age, sex), neighbourhood characteristics (combined area-level disadvantage and supermarket access), and trip characteristics (location prior to purchasing (for all purchases and supermar-ket purchases only), mode of travel (for purchases made
from home only), day of week). Mode of travel was only considered for purchases made when home was the prior location as this was a sensible trip origin to assess this variable. As the outcome assessed is distance from the home and not distance from the origin, results would have been biased if we included, for example, trips made from work during a lunch break where the mode of travel was walking but the actual purchase location is several kilometres from home. Both models were run on all non-missing values for each of the characteristics in Model 2 for comparability (all purchase n = 845; purchases made when home was the origin n = 460; purchases made within supermarkets n = 300). These two models allowed level of clustering within individuals and SA1s to be assessed prior to and after the addition of the individual, neighbourhood and trip characteristics.
Results
Descriptive results
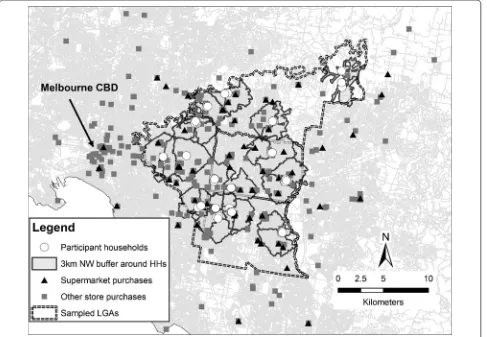
A total of 893 food purchases were considered in the descriptive analysis; 484 (54.2%) of these were made when home was reported as the prior location and 317 (35.5%) were made within supermarkets. Mapped house-hold and food purchase locations are presented in Fig. 1.
Across all purchases, food purchases were found to take place a median distance of 3.6 km (IQR 1.8, 7.2) from participants’ homes, with the within-person median ranging from 0.3 to 16.8 km (Table 1). The median dis-tance for purchases made when home was the prior loca-tion was only slightly lower than that for all purchases [3.4 km (IQR 1.6, 6.4)] whilst supermarket purchases were generally closer to home [2.8 km (IQR 1.6, 5.6)].
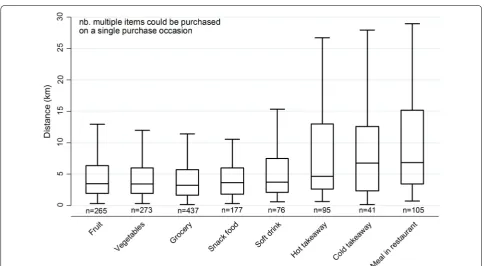
Over 60% of all food purchases occurred beyond 3 km of participant’s homes (Table 1). This is demonstrated in Fig. 2 with the 3 km distance (a commonly used buffer size in studies of food environment exposure) marked on this graph to highlight the food purchases taking place beyond this distance. Two participants made all pur-chases during the 2 weeks within 3 km of their home, whilst six participants made all of their purchases more than 3 km from their home.
concurrently in supermarkets. Median distances were greater when the item purchased was hot takeaway (4.6 km; IQR 2.6, 13.0), cold takeaway (6.7 km; IQR 2.3, 12.6), and meals in restaurants (6.8 km; IQR 3.4, 15.2).
Figure 4 presents the food purchase locations for all seven individuals living within a single high SES-low access SA1. The standard deviation ellipses presented in this figure highlight the dispersion of purchases locations within individuals but also the similarities and differences in regular purchase locations between individuals who live within close proximity of each other.
Multilevel analysis
For all purchases and for purchases made when home was the prior location, there was evidence to suggest that the distance between home and the food purchase loca-tion was greater amongst the youngest age group com-pared to those aged 55 years and over (Table 2). For the purchases made at supermarkets, age was not associated with distance from home, however supermarket pur-chases made by men were closer to home than supermar-ket purchases by women.
Compared to those in low SES-low access SA1s, pur-chases made by those in high SES-low access SA1s were a further distance from home for all purchases and pur-chases made when home was the prior location. Pur-chases were further from home for all three outcomes for those in high low access SA1s compared to low SES-high access SA1s (Additional file 2: Table S2). Conversely, amongst SA1s deemed high SES-high access, purchases were nearer to the home when compared to purchases made by those in high SES-low access SA1s for all out-comes. Amongst those in low SES SA1s, there was no dif-ference in purchase distance from home between those in high access compared to low access neighbourhoods.
When the workplace was the prior location compared to when home was the prior location, all purchases and supermarket purchases were further from home. For pur-chases made when home was the origin, mode of travel was examined with trips made by walking found to be significantly shorter than trips made by car. For all pur-chases and purpur-chases made when home was the prior location, purchases made on the weekend were further from the home compared to purchases on the weekday.
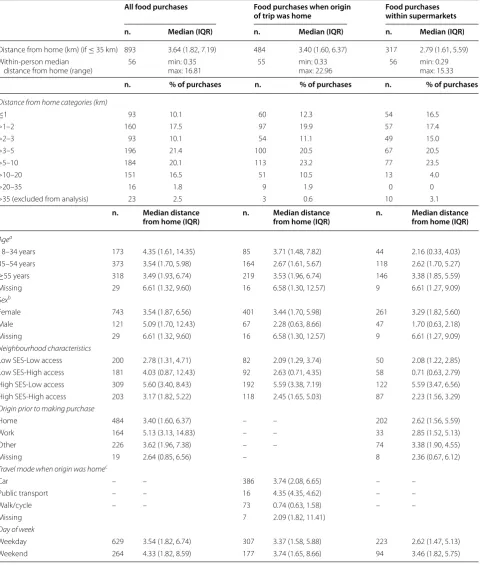
Table 1 Descriptive statistics for distance between home and food purchase locations by individual, neighbourhood, and trip characteristics
All food purchases Food purchases when origin
of trip was home Food purchases within supermarkets n. Median (IQR) n. Median (IQR) n. Median (IQR)
Distance from home (km) (if ≤ 35 km) 893 3.64 (1.82, 7.19) 484 3.40 (1.60, 6.37) 317 2.79 (1.61, 5.59) Within-person median
distance from home (range) 56 min: 0.35max: 16.81 55 min: 0.33max: 22.96 56 min: 0.29max: 15.33 n. % of purchases n. % of purchases n. % of purchases
Distance from home categories (km)
≤1 93 10.1 60 12.3 54 16.5
>1–2 160 17.5 97 19.9 57 17.4
>2–3 93 10.1 54 11.1 49 15.0
>3–5 196 21.4 100 20.5 67 20.5
>5–10 184 20.1 113 23.2 77 23.5
>10–20 151 16.5 51 10.5 13 4.0
>20–35 16 1.8 9 1.9 0 0
>35 (excluded from analysis) 23 2.5 3 0.6 10 3.1
n. Median distance
from home (IQR) n. Median distance from home (IQR) n. Median distance from home (IQR)
Agea
18–34 years 173 4.35 (1.61, 14.35) 85 3.71 (1.48, 7.82) 44 2.16 (0.33, 4.03) 35–54 years 373 3.54 (1.70, 5.98) 164 2.67 (1.61, 5.67) 118 2.62 (1.70, 5.27)
≥55 years 318 3.49 (1.93, 6.74) 219 3.53 (1.96, 6.74) 146 3.38 (1.85, 5.59) Missing 29 6.61 (1.32, 9.60) 16 6.58 (1.30, 12.57) 9 6.61 (1.27, 9.09)
Sexb
Female 743 3.54 (1.87, 6.56) 401 3.44 (1.70, 5.98) 261 3.29 (1.82, 5.60)
Male 121 5.09 (1.70, 12.43) 67 2.28 (0.63, 8.66) 47 1.70 (0.63, 2.18)
Missing 29 6.61 (1.32, 9.60) 16 6.58 (1.30, 12.57) 9 6.61 (1.27, 9.09)
Neighbourhood characteristics
Low SES-Low access 200 2.78 (1.31, 4.71) 82 2.09 (1.29, 3.74) 50 2.08 (1.22, 2.85) Low SES-High access 181 4.03 (0.87, 12.43) 92 2.63 (0.71, 4.35) 58 0.71 (0.63, 2.79) High SES-Low access 309 5.60 (3.40, 8.43) 192 5.59 (3.38, 7.19) 122 5.59 (3.47, 6.56) High SES-High access 203 3.17 (1.82, 5.22) 118 2.45 (1.65, 5.03) 87 2.23 (1.56, 3.29)
Origin prior to making purchase
Home 484 3.40 (1.60, 6.37) – – 202 2.62 (1.56, 5.59)
Work 164 5.13 (3.13, 14.83) – – 33 2.85 (1.52, 5.13)
Other 226 3.62 (1.96, 7.38) – – 74 3.38 (1.90, 4.55)
Missing 19 2.64 (0.85, 6.56) – 8 2.36 (0.67, 6.12)
Travel mode when origin was homec
Car – – 386 3.74 (2.08, 6.65) – –
Public transport – – 16 4.35 (4.35, 4.62) – –
Walk/cycle – – 73 0.74 (0.63, 1.58) – –
Missing 7 2.09 (1.82, 11.41)
Day of week
Weekday 629 3.54 (1.82, 6.74) 307 3.37 (1.58, 5.88) 223 2.62 (1.47, 5.13) Weekend 264 4.33 (1.82, 8.59) 177 3.74 (1.65, 8.66) 94 3.46 (1.82, 5.75)
a Number of participants by age group: 18–34 years n = 11 (19.6%); 35–54 years n = 20 (35.7%); ≥ 55 years n = 23 (41.1%); missing n = 2 (3.6%) b Number of participants by sex: female n = 45 (80.3%); male n = 9 (16.1%); missing n = 2 (3.6%)
Fig. 2 Distance from home of all food purchase locations for each participant
No difference in weekend compared to weekday was found for supermarket purchases.
Intraclass correlations
The within-person and within-neighbourhood (SA1) correlations were assessed for both models across the three outcomes. For all purchases in Model 1, the ICC for individuals (18.4%) and for SA1s (20.6%) were simi-lar. The inclusion of individual, neighbourhood, and trip characteristics in Model 2 accounted for some of this ICC with individual ICC reducing to 14.5% and
SA1 ICC to 16.8%. For purchases made from home and supermarket purchases, the amount of clustering was higher within SA1s than within individual in the null models. For purchase made from home, the individual and SA1 ICC were more similar when accounting for individual, neighbourhood and trip characteristics (individual ICC: 9.5%, SA1 ICC: 11.6%). For purchases made in supermarkets, the SA1 ICC reduced from 60.6% in Model 1 to 52.8% in Model 2 but still sug-gested a much higher degree of clustering than within-individuals (6.1%).
Discussion
The study builds upon a developing evidence base that demonstrates that the neighbourhood food environ-ment, as traditionally defined, is inadequate for capturing important locations where individuals are exposed to and purchase food. Further, it has shown that distance from home to purchase location varies by the type of food being purchased and also by individual, neighbourhood and trip characteristics. This study’s results are supported by prior work from the US. Kerr et al. report the average travel distance (from any origin) to a grocery store to be 4.67 mile (~7.52 km) [19]. They also reported that trips
made from home, to a food store, and back home again were an average distance of 5.37 mile [19], or a one way trip of approximately 2.69 mile (~4.32 km). In this pre-sent study median distance is reported rather than aver-age due to skewed distribution of the data. The median distance found in the study was 3.40 km but the average distance was 5.03 km.
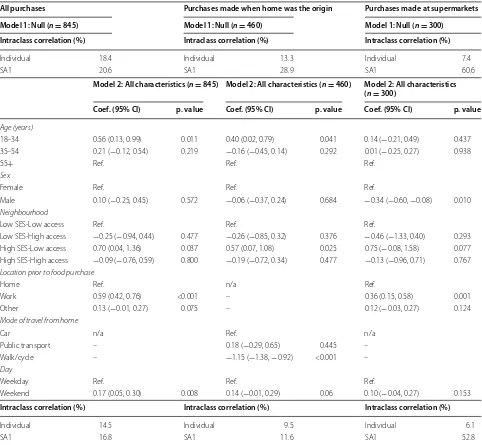
The sampled neighbourhoods were a mix of those defined as having access to the two major chain super-markets (Coles and Woolworths) nearby and those with-out. However, when considering all four major chains (Coles, Woolworth, Aldi and IGA) only three of the 56 Table 2 Linear mixed models for distance from home to food purchase location (log transformed)
Nb. n. for both Model 1 and Model 2 based on non-missing values in Model 2 for comparability
All purchases Purchases made when home was the origin Purchases made at supermarkets Model 1: Null (n = 845) Model 1: Null (n = 460) Model 1: Null (n = 300)
Intraclass correlation (%) Intraclass correlation (%) Intraclass correlation (%)
Individual 18.4 Individual 13.3 Individual 7.4
SA1 20.6 SA1 28.9 SA1 60.6
Model 2: All characteristics (n = 845) Model 2: All characteristics (n = 460) Model 2: All characteristics (n = 300)
Coef. (95% CI) p. value Coef. (95% CI) p. value Coef. (95% CI) p. value
Age (years)
18–34 0.56 (0.13, 0.99) 0.011 0.40 (0.02, 0.79) 0.041 0.14 (−0.21, 0.49) 0.437 35–54 0.21 (−0.12, 0.54) 0.219 −0.16 (−0.45, 0.14) 0.292 0.01 (−0.25, 0.27) 0.938
55+ Ref. Ref. Ref.
Sex
Female Ref. Ref. Ref.
Male 0.10 (−0.25, 0.45) 0.572 −0.06 (−0.37, 0.24) 0.684 −0.34 (−0.60, −0.08) 0.010
Neighbourhood
Low SES-Low access Ref. Ref. Ref.
Low SES-High access −0.25 (−0.94, 0.44) 0.477 −0.26 (−0.85, 0.32) 0.376 −0.46 (−1.33, 0.40) 0.293 High SES-Low access 0.70 (0.04, 1.36) 0.037 0.57 (0.07, 1.08) 0.025 0.75 (−0.08, 1.58) 0.077 High SES-High access −0.09 (−0.76, 0.59) 0.800 −0.19 (−0.72, 0.34) 0.477 −0.13 (−0.96, 0.71) 0.767
Location prior to food purchase
Home Ref. n/a Ref.
Work 0.59 (0.42, 0.76) <0.001 – 0.36 (0.15, 0.58) 0.001
Other 0.13 (−0.01, 0.27) 0.075 – 0.12 (−0.03, 0.27) 0.124
Mode of travel from home
Car n/a Ref. n/a
Public transport – 0.18 (−0.29, 0.65) 0.445 –
Walk/cycle – −1.15 (−1.38, −0.92) <0.001 –
Day
Weekday Ref. Ref. Ref.
Weekend 0.17 (0.05, 0.30) 0.008 0.14 (−0.01, 0.29) 0.06 0.10 (−0.04, 0.27) 0.153 Intraclass correlation (%) Intraclass correlation (%) Intraclass correlation (%)
Individual 14.5 Individual 9.5 Individual 6.1
participants lived further than 3 km of any supermarket and it is plausible that the presence of a supermarket may be a proxy for the presence of other food retailers. It is therefore unlikely that the lack of nearby food retailers was the key reason that over 60% of all food purchase and over 50% of supermarket purchases occurred more than 3 km from the home.
Distances from home were greatest when the food being purchased was hot takeaway food, cold takeaway food, or meals within sit down restaurants. The location of both the workplace and social activities are likely to be key contributors to this as would an individual’s prefer-ence for a particular cuisine which may require them to travel a greater distance. US studies have also reported a higher distance to sit down restaurants compared to other store types [17, 19].
In the present study greater distance to food purchase locations was observed among younger age groups which perhaps indicates higher levels of daily mobility. Com-pared to trips made when home was the origin, distance between home and the purchase location was unsurpris-ingly greater when workplace was reported as the origin. It is likely this was largely dictated by workplace loca-tion. Whilst prior work by this study’s authors did not find evidence that the relationship between food stores near home and eating behaviours differed by work status [26], Zenk et al. [14] have previously shown that those employed have larger activity spaces than those not in the labour force suggesting that use of stores further away is more likely. Although that study took place in the US, the clustering of employment opportunities outside of subur-ban residential areas across Melbourne means this is also likely to be the case in this sample.
Purchases on the weekend were also a greater distance from home than purchases on weekdays (though not to the same extent as the origin of trip differential). Non-work day purchases were also a greater distance from home in Kerr et al.’s study [19]. Purchase locations on the weekend, where more free time is expected, may be more heavily influenced by store preferences and the loca-tion of social outings whereas weekday purchase may be determined by time scarcity and convenience.
When home was the prior location, food purchase locations reached by walking or cycling were a median distance of 3 km closer to home than purchase made using a car. This indicates that those engaging in active forms of transport more often used local food stores than those who travelled by car. However, it is not pos-sible to determine whether specific purchases made by active travel were due to personal preference or because of lack of access to a motor vehicle at the time of pur-chase. Whilst the benefits of active transport are well
established, if purchase location was restricted because of limited vehicle access then this has the potential to result in less healthy food purchases [27].
The linear mixed model results show the neighbour-hood of residence (combined area SES and supermarket access) was associated with food purchase distance from home. Participants from high SES-low access SA1s pur-chased food further from home than participants from each of the other three sampling quadrants. This indi-cates that whilst nearby supermarkets (and potentially other food stores) may have been located further away, the high SES status of these neighbourhoods could mean that higher levels of employment or greater personal means (e.g. access to a motor vehicle) facilitated the abil-ity and willingness to travel further for food purchases.
Differences in food purchase locations presented in Figs. 3 and 4 highlight that the utilisation of stand-ard food environment exposure measures within a set boundary from household locations may not result in the generation of new and important advances in the field. Whilst the purchase locations and standard deviation ellipses presented in Fig. 4 indicate the home is an impor-tant ‘anchor point’ [9, 28, 29] around which purchases take place, individual variations were apparent. Given differences in individual characteristics, it should not be expected that residents utilise their neighbourhood in the same way. Further, a number of often unmeasured environment differences would also impact on the use of neighbourhoods for food purchasing purposes. For example, neighbourhoods with two supermarkets may differ with regards to a number of other important envi-ronmental characteristics (e.g. crime, public transport, walkability) meaning individual use of local supermarkets between these neighbourhoods would likely differ. For this reason, there needs to be a greater emphasis on both individual- and environmental-level moderators.
Kwan has previously described the need to give further consideration to individuals when considering contex-tual effects [30, 31]. Sharkey and Faber have previously called on researchers investigating residential contextual effects to be more flexible in their approach and answer the questions of where, when, why, and for whom do resi-dential contexts matter [32]. There is an increasing body of food environment research adapting such an approach to investigate where and, in some cases, when food envi-ronments matter [12, 33–38]. However, future research needs to continue to evolve to ensure the equally impor-tant questions of why and for whom are also answered.
Strengths
data on behaviour location. This study was strengthened by the collection of food purchasing data over a 2-week period which allowed for the capture of regular and occa-sional purchase behaviours. Food purchasing data pro-vides an insight into how individuals interact with the environment and removes assumptions associated with studies that link neighbourhood exposure measures to consumption or health outcomes. Whilst it is not possi-ble to verify missing purchases, the fact participants con-tinued recording data across all fourteen days and that multiple purchases on each day were often recorded indi-cates good compliance. There were very few problems with the food store data provided (name/address) mean-ing that over 96% of purchase locations were able to be identified.
Limitations and considerations for future research
This study was limited to a single region of Melbourne, Australia. Whilst an attempt was made to diversify the sample through choosing sample locations that differed by levels of socioeconomic disadvantage and access to major supermarket chains, future work would benefit from being undertaken across a more expansive and diverse area with regards to both population characteris-tics and the local environments.
A larger study involving more participants would allow for a deeper investigation into the role of individual- and household-level modifiers. Individual and household factors such as age, motor vehicle ownership, disability, family composition (e.g. presence of young children in the household), hours worked per week, workplace loca-tion and food preferences are all likely to influence which food stores are visited. Greater consideration of these and other environmental factors (e.g. walkability of neigh-bourhoods, provision of public transport, and in-store factors such as product range, quality and price) would allow us to understand why two people living in the same neighbourhood access different food stores.
This study objective was to capture the food purchas-ing locations of the main household food purchaser and consequently the study material was addressed to this person. Whilst this approach potentially captured a large portion of food purchased for consumption by other household members, independent purchases by other household members were not recorded. The completion of the diary by all members of the household would allow for both individual and household purchasing patterns to be assessed.
Future studies should also consider collecting further (precise) address information of the origin of trips (e.g. workplaces). Whilst the addition of GPS data would help to capture this information, the simple reporting of addi-tional address information on other key origins would
provide more context into why purchases are occurring where they do. Whilst this study collected data on work postcode, the large size of these areal units did not pro-vide a meaningful location to be able to calculate pur-chase distance between work and purpur-chase location when work was the origin. Prior studies suggest food stores outside of the residential context for example, near workplaces, may be important to food behaviours [26, 39]. Therefore it is important that precise address data on workplaces and other frequently visited locations are col-lected in future studies.
The food categories collected could be further refined (e.g. any vegetables instead of fresh vegetables only which excluded frozen options). This would potentially allow a more detailed analysis on the impact of the food pur-chase location on the healthiness of food purpur-chases.
Finally, it is acknowledged that the definition of super-market was different for access (Coles and Woolworths) and purchases (Coles, Woolworths, Aldi and IGA). How-ever, our access measure was based on the two most dominant chains which have ~70% market share and it is unlikely a sufficient neighbourhoods that did not have supermarket access would have been identified if addi-tional supermarket chains were included. Whilst the dominant supermarket chains were used as a proxy for food store access in this study, it is by no means a perfect measure. Future work should pay particular attention to the development of access measures prior to sampling to ensure even greater heterogeneity in neighbourhood food environment measure. This will require access to detailed food retail datasets with accurate and complete data and a range of food store categorisations. Other environmen-tal heterogeneity could also be introduced through the inclusion of other metrics such as walkability.
Conclusions
Through the collection of food purchasing locations this study has been able to demonstrate that many food purchases occur beyond what is commonly defined as the residential neighbourhood food environment. Fur-ther, results highlight the potential role of individual and neighbourhood characteristics as an influence on food purchase locations. This study’s methods and results can inform our thinking on the appropriateness of using nar-rowly-focussed neighbourhood exposure measures when trying to understand the associations between food envi-ronments and food purchasing behaviours.
Additional file
Authors’ contributions
LT led the conceptualisation and design of the study with input from DC and KB. LT led the analysis and write up of this study. KL advised on the analysis used in this study. DC, KL, and KB provided critical feedback on the drafts of this study. All authors read and approved the final manuscript.
Acknowledgements
The authors would like to acknowledge Ralf-Dieter Schroers, Jennifer McCann, and Kate Parker for their assistance with data collection and data processing.
Competing interests
The authors declare that they have no competing interests.
Availability of data and materials
The datasets used and/or analysed during the current study available from the corresponding author on reasonable request. Data collection material is available in Additional file 1.
Ethics approval and consent to participate
Ethical approval for the study was provided by the Deakin University Human Research Ethics Committee (HEAG-H 109_2011). Participants provided written informed consent to participate.
Funding
Internal funding was used to support project costs.
Received: 4 December 2016 Accepted: 27 February 2017
References
1. Caspi CE, Sorensen G, Subramanian SV, Kawachi I. The local food environ-ment and diet: a systematic review. Health Place. 2012;18:1172–87. 2. Giskes K, van Lenthe F, Avendano-Pabon M, Brug J. A systematic review
of environmental factors and obesogenic dietary intakes among adults: are we getting closer to understanding obesogenic environments? Obes Rev. 2011;12(5):e95–106.
3. Ni Mhurchu C, Vandevijvere S, Waterlander W, Thornton LE, Kelly B, Cameron AJ, Snowdon W, Swinburn B. Informas: monitoring the avail-ability of healthy and unhealthy foods and non-alcoholic beverages in community and consumer retail food environments globally. Obes Rev. 2013;14(Suppl 1):108–19.
4. Thornton LE, Pearce JR, Macdonald L, Lamb KE, Ellaway A. Does the choice of neighbourhood supermarket access measure influence asso-ciations with individual-level fruit and vegetable consumption? A case study from Glasgow. Int J Health Geogr. 2012;11:29.
5. Ball K, Timperio AF, Crawford DA. Understanding environmental influ-ences on nutrition and physical activity behaviors: where should we look and what should we count? Int J Behav Nutr Phys Act. 2006;3:33. 6. Lytle LA. Measuring the food environment: state of the science. Am J Prev
Med. 2009;36(4 Suppl):S134–44.
7. Charreire H, Casey R, Salze P, Simon C, Chaix B, Banos A, Badariotti D, Weber C, Oppert JM. Measuring the food environment using geographi-cal information systems: a methodologigeographi-cal review. Public Health Nutr. 2010;13(11):1773–85.
8. Thornton LE, Pearce JR, Kavanagh AM. Using geographic information systems (GIS) to assess the role of the built environment in influencing obesity: a glossary. Int J Behav Nutr Phys Act. 2011;8:71.
9. Perchoux C, Chaix B, Cummins S, Kestens Y. Conceptualization and measurement of environmental exposure in epidemiology: accounting for activity space related to daily mobility. Health Place. 2013;21:86–93. 10. Cummins S. Neighbourhood food environment and diet: time for
improved conceptual models? Prev Med. 2007;44(3):196–7.
11. Sadler RC, Clark AF, Wilk P, O’Connor C, Gilliland JA. Using GPS and activity tracking to reveal the influence of adolescents’ food environment expo-sure on junk food purchasing. Can J Public Health-Revue Canadienne De Sante Publique. 2016;107:Es14–20.
12. Shearer C, Rainham D, Blanchard C, Dummer T, Lyons R, Kirk S. Measuring food availability and accessibility among adolescents: moving beyond the neighbourhood boundary. Soc Sci Med. 2015;133:322–30. 13. Chaix B, Bean K, Daniel M, Zenk SN, Kestens Y, Charreire H, Leal C, Thomas
F, Karusisi N, Weber C, et al. Associations of supermarket characteristics with weight status and body fat: a multilevel analysis of individuals within supermarkets (RECORD study). PLoS ONE. 2012;7(4):e32908.
14. Zenk SN, Schulz AJ, Matthews SA, Odoms-Young A, Wilbur J, Wegrzyn L, Gibbs K, Braunschweig C, Stokes C. Activity space environment and dietary and physical activity behaviors: a pilot study. Health Place. 2011;17(5):1150–61.
15. Christian WJ. Using geospatial technologies to explore activity-based retail food environments. Spat Spatio-temporal Epidemiol. 2012;3(4):287–95.
16. Hillier A, Cannuscio CC, Karpyn A, McLaughlin J, Chilton M, Glanz K. How far do low-income parents travel to shop for food? Empirical evidence from two urban neighborhoods. Urban Geogr. 2011;32(5):712–29. 17. Liu JL, Han B, Cohen DA. Beyond neighborhood food environments:
distance traveled to food establishments in 5 US cities, 2009–2011. Prev Chronic Dis. 2015;12:E126.
18. Cannuscio CC, Tappe K, Hillier A, Buttenheim A, Karpyn A, Glanz K. Urban food environments and residents’ shopping behaviors. Am J Prev Med. 2013;45(5):606–14.
19. Kerr J, Frank L, Sallis JF, Saelens B, Glanz K, Chapman J. Predictors of trips to food destinations. Int J Behav Nutr Phys Act. 2012;9:58.
20. Spencer S, Kneebone M. FOODmap: an analysis of the Australian food supply chain. Canberra: Department of Agriculture, Fisheries and Forestry; 2012.
21. Roy Morgan Research. Supermarket sweep: ALDI’s share of the Aussie market still rising.
http://www.roymorgan.com/findings/6762-super-market-sweep-aldis-share-of-aussie-market-still-rising-201604142258.
Accessed Sept 2016.
22. Environmental Systems Research Institute (ESRI). ArcGIS 10.2 for Desktop. Redland, CA: ESRI; 2013.
23. Sherman JE, Spencer J, Preisser JS, Gesler WM, Arcury TA. A suite of meth-ods for representing activity space in a healthcare accessibility study. Int J Health Geogr. 2005;4:24.
24. Rainham D, McDowell I, Krewski D, Sawada M. Conceptualizing the healthscape: contributions of time geography, location technolo-gies and spatial ecology to place and health research. Soc Sci Med. 2010;70(5):668–76.
25. StataCorp. Stata Statistical Software: Release 14. College Station, TX: StataCorp LP; 2015.
26. Thornton LE, Lamb KE, Ball K. Employment status, residential and work-place food environments: associations with women’s eating behaviours. Health Place. 2013;24:80–9.
27. Burns C, Bentley R, Thornton L, Kavanagh A. Associations between the purchase of healthy and fast foods and restrictions to food access: a cross-sectional study in Melbourne, Australia. Public Health Nutr. 2015;18(1):143–50.
28. Chaix B, Meline J, Duncan S, Jardinier L, Perchoux C, Vallee J, Merrien C, Karusisi N, Lewin A, Brondeel R, et al. Neighborhood environments, mobility, and health: towards a new generation of studies in environ-mental health research. Revue D Epidemiologie Et De Sante Publique. 2013;61:S139–45.
29. Chaix B, Meline J, Duncan S, Merrien C, Karusisi N, Perchoux C, Lewin A, Labadi K, Kestens Y. GPS tracking in neighborhood and health studies: a step forward for environmental exposure assessment, a step backward for causal inference? Health Place. 2013;21:46–51.
30. Kwan MP. From place-based to people-based exposure measures. Soc Sci Med. 2009;69(9):1311–3.
31. Kwan M-P. The uncertain geographic context problem. Ann Assoc Am Geogr. 2012;102(5):958–68.
32. Sharkey P, Faber JW. Where, when, why, and for whom do residential contexts matter? Moving away from the dichotomous understanding of neighborhood effects. Annu Rev Sociol. 2014;40(1):559–79.
• We accept pre-submission inquiries
• Our selector tool helps you to find the most relevant journal
• We provide round the clock customer support
• Convenient online submission
• Thorough peer review
• Inclusion in PubMed and all major indexing services
• Maximum visibility for your research
Submit your manuscript at www.biomedcentral.com/submit
Submit your next manuscript to BioMed Central
and we will help you at every step:
34. Horner MW, Wood BS. Capturing individuals’ food environments using flexible space-time accessibility measures. Appl Geogr. 2014;51:99–107.
35. Kestens Y, Lebel A, Chaix B, Clary C, Daniel M, Pampalon R, Theriault M, Subramanian SVP. Association between activity space exposure to food establishments and individual risk of overweight. PLoS ONE. 2012;7(8):e41418.
36. Kestens Y, Lebel A, Daniel M, Theriault M, Pampalon R. Using experi-enced activity spaces to measure foodscape exposure. Health Place. 2010;16(6):1094–103.
37. Widener MJ, Farber S, Neutens T, Horner MW. Using urban commuting data to calculate a spatiotemporal accessibility measure for food environ-ment studies. Health Place. 2013;21:1–9.
38. Widener MJ, Shannon J. When are food deserts? Integrating time into research on food accessibility. Health Place. 2014;30:1–3.