Models of alien species richness show moderate
predictive accuracy and poor transferability
César Capinha1,2, Franz Essl3, Hanno Seebens4,
Henrique Miguel Pereira1,5,6, Ingolf Kühn5,6,7
1 CIBIO/InBIO, Centro de Investigação em Biodiversidade e Recursos Genéticos, Universidade do Porto, Campus Agrário de Vairão, 4485-661 Vairão, Portugal 2 Zoologisches Forschungsmuseum Alexander Koenig, Adenauerallee 160, D-53113 Bonn, Germany 3 Division of Conservation Biology, Vegetation and Landsca-pe Ecology, University Vienna, Rennweg 14, 1030 Wien 4 Senckenberg Biodiversity and Climate Research Centre (SBiK-F), Senckenberganlage 25, 60325 Frankfurt am Main, Germany 5 Martin Luther University Halle-Wittenberg, Institute of Biology/Geobotany and Botanical Garden, Am Kirchtor 1, 06108 Halle, Ger-many 6 German Centre for Integrative Biodiversity Research (iDiv) Halle-Jena-Leipzig, Deutscher Platz 5e, 04103 Leipzig, Germany 7 Helmholtz Centre for Environmental Research – UFZ, Dept. Community Ecology, Theodor-Lieser-Str. 4, 06120 Halle, Germany
Corresponding author:César Capinha ([email protected])
Academic editor:Petr Pyšek | Received 9 January 2018 | Accepted 23 May 2018 | Published 6 June 2018
Citation: Capinha C, Essl F, Seebens H, Pereira HM, Kühn I (2018) Models of alien species richness show moderate predictive accuracy and poor transferability. NeoBiota 38: 77–96. https://doi.org/10.3897/neobiota.38.23518
Abstract
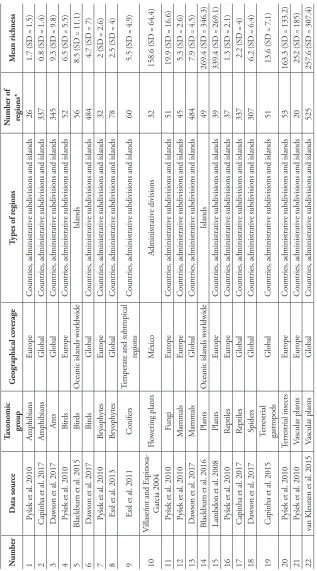
Robust predictions of alien species richness are useful to assess global biodiversity change. Nevertheless, the capacity to predict spatial patterns of alien species richness remains largely unassessed. Using 22 data sets of alien species richness from diverse taxonomic groups and covering various parts of the world, we evaluated whether different statistical models were able to provide useful predictions of absolute and rela-tive alien species richness, as a function of explanatory variables representing geographical, environmental and socio-economic factors. Five state-of-the-art count data modelling techniques were used and com-pared: Poisson and negative binomial generalised linear models (GLMs), multivariate adaptive regression splines (MARS), random forests (RF) and boosted regression trees (BRT). We found that predictions of absolute alien species richness had a low to moderate accuracy in the region where the models were developed and a consistently poor accuracy in new regions. Predictions of relative richness performed in a superior manner in both geographical settings, but still were not good. Flexible tree ensembles-type tech-niques (RF and BRT) were shown to be significantly better in modelling alien species richness than para-metric linear models (such as GLM), despite the latter being more commonly applied for this purpose. Importantly, the poor spatial transferability of models also warrants caution in assuming the generality of the relationships they identify, e.g. by applying projections under future scenario conditions. Ultimately,
Copyright César Capinha et al. This is an open access article distributed under the terms of the Creative Commons Attribution License (CC BY 4.0), which permits unrestricted use, distribution, and reproduction in any medium, provided the original author and source are credited.
our results strongly suggest that predictability of spatial variation in richness of alien species richness is limited. The somewhat more robust ability to rank regions according to the number of aliens they have (i.e. relative richness), suggests that models of aliens species richness may be useful for prioritising and comparing regions, but not for predicting exact species numbers.
Keywords
biological invasions; clamping; model evaluation; predictive modelling; transferability
Introduction
Knowing the distribution patterns of alien species richness is increasingly crucial for as-sessing and monitoring global biodiversity (Dornelas et al. 2014, Tittensor et. al. 2014, Capinha et al. 2015, Latombe et al. 2017). Knowledge about alien species richness is also required by environmental managers and researchers to assist in decision-making of tasks such as ecosystem restoration (Catford et al. 2012), the identification of points of entry for introduced species (e.g. Seebens et al. 2013), the quantification of impacts posed by invasive alien species (i.e. the subset of alien species that have harmful effects on the recipient ecosystems; Blackburn et al. 2014) or the assessment of the ecological degradation of habitats (Vandekerkhove et al. 2013).
Despite substantial progress being made in the availability of alien species distribu-tions, there still are numerous regions worldwide for which alien species richness data are lacking or highly incomplete (Dawson et al. 2017, Pyšek et al. 2017). These gaps occur at multiple spatial scales and, although often related to lower levels of socioeco-nomic development (McGeoch et al. 2010), they can also be found in generally well-studied taxonomic groups and regions (Pyšek et al. 2008, 2010). A further challenge for preparing an inventory of alien species richness is the highly dynamic nature of alien species spread, which requires regular updates as time progresses (McGeoch et al. 2010, Tittensor et al. 2014, Seebens et al. 2017).
Despite the relevance of information on alien species richness, little work has been done to assess whether alien species richness can be accurately predicted for areas where such data are lacking. If this metric is possible to predict with accuracy, then available data can be used to geographically broaden the current knowledge on biodiversity pat-terns and to support conservation and alien species management decisions in areas that are currently not surveyed. Further, high reliability of predictive models would enable the integration of predictive modelling in alien species mapping.
et al. 2006, Nobis et al. 2009). The framework for this approach is similar to that of de-scriptive models relating alien species richness to spatial factors (e.g. Kühn et al. 2003, Westphal et al. 2008, Pyšek et al. 2010, Blackburn et al. 2016, Capinha et al. 2017, Dawson et al. 2017), but it goes one step further by using the identified relationships to make predictions.
Species distribution modelling has been intensively applied to alien species in re-cent years and modelling practices are increasingly refined (e.g. Calabrese et al. 2014). Thus, one might expect that the stacked modelling approach would be a preferred means for predicting alien species richness. However, stacked species distribution models, which imply developing models for each species individually, are data- and resource-demanding and may not be applicable when a high number of species or regions are involved. For instance, one would need to have at least 10 times as many presence points as one has predictor variables (Babyak 2004) – and ideally at least as many absence points (but see MaxEnt; Elith et al. 2011). Further, in species distribu-tion models, one of the most important fundamental assumpdistribu-tions, i.e. the species modelled being in equilibrium with the environment, is violated. This would lead to underestimating the potential niche space of the species and would result in biased models, usually leading to incorrect predictions and inflated turnover rates in projec-tions (Pompe et al. 2008, Pompe et al. 2011). In this context, statistical models directly relating alien species richness with spatial drivers (hereafter referred to simply as “spe-cies richness models”) become particularly relevant as they are less data-demanding. However, benchmarking the accuracy and performance of these models using typical datasets of alien species distributions has rarely been done, which hampers the assess-ment and comparison of the model predictions.
Here, we perform a formal evaluation of the ability of species richness models to predict the richness of alien species. We measure and compare the predictive accura-cies of five modelling techniques extensively used in ecology: i) a Generalised Linear Model (GLM) using a Poisson distribution (GLM-P), ii) a GLM using a negative binomial distribution (GLM-NB), iii) boosted regression trees (BRT), iv) multivariate adaptive regression splines (MARS) and v) random forests (RF). We assess the ability of the modelling techniques to predict within the geographical range of the model’s calibration data (i.e. “geographical interpolation”) and in new, spatially independent regions (i.e. transferability or “geographical extrapolation”; Wenger and Olden 2012). We perform this assessment using a collection of 22 datasets of alien species richness analysed in previous studies.
Methods
Alien species richness data
Tab
le 1.
Characteristics of the datasets of alien species richness used for pr
edictiv e modelling. N umber D ata sour ce Tax
onomic group
G
eographical co
verage
Types of r
egions
N
umber of regions*
M
ean richness
1
Pyšek et al. 2010
Amphibians
Eur
ope
Countries, administrativ
e subdivisions and islands
26
1.7 (SD = 1.5)
2
Capinha et al. 2017
Amphibians
G
lobal
Countries, administrativ
e subdivisions and islands
337
0.8 (SD = 1.4)
3
D
awson et al. 2017
Ants
G
lobal
Countries, administrativ
e subdivisions and islands
345
9.3 (SD = 9.8)
4
Pyšek et al. 2010
Bir
ds
Eur
ope
Countries, administrativ
e subdivisions and islands
52
6.5 (SD = 5.5)
5
Blackburn et al. 2015
Bir
ds
O
ceanic islands worldwide
Islands
56
8.5 (SD = 11.1)
6
D
awson et al. 2017
Bir
ds
G
lobal
Countries, administrativ
e subdivisions and islands
484
4.7 (SD = 7)
7
Pyšek et al. 2010
Br
yophytes
Eur
ope
Countries, administrativ
e subdivisions and islands
32
2 (SD = 2.6)
8
Essl et al. 2013
Br
yophytes
G
lobal
Countries, administrativ
e subdivisions and islands
78
2.5 (SD = 4)
9
Essl et al. 2011
Conifers
Temperate and subtr
opical
regions
Countries, administrativ
e subdivisions and islands
60
5.5 (SD = 4.9)
10
V
illaseñor and
Espinosa-G ar cia 2004 Flo w ering plants M éxico Administrativ e divisions 32
158.6 (SD = 64.4)
11
Pyšek et al. 2010
Fungi
Eur
ope
Countries, administrativ
e subdivisions and islands
51
19.9 (SD = 16.6)
12
Pyšek et al. 2010
M
ammals
Eur
ope
Countries, administrativ
e subdivisions and islands
45
5.3 (SD = 2.6)
13
D
awson et al. 2017
M
ammals
G
lobal
Countries, administrativ
e subdivisions and islands
484
7.9 (SD = 4.5)
14
Blackburn et al. 2016
Plants
O
ceanic islands worldwide
Islands
49
269.4 (SD = 346.3)
15
Lambdon et al. 2008
Plants
Eur
ope
Countries, administrativ
e subdivisions and islands
39
339.4 (SD = 269.1)
16
Pyšek et al. 2010
Reptiles
Eur
ope
Countries, administrativ
e subdivisions and islands
37
1.3 (SD = 2.1)
17
Capinha et al. 2017
Reptiles
G
lobal
Countries, administrativ
e subdivisions and islands
337
2.2 (SD = 4)
18
D
awson et al. 2017
Spiders
G
lobal
Countries, administrativ
e subdivisions and islands
307
6.2 (SD = 6.4)
19
Capinha et al. 2015
Terr estrial gastr opods G lobal Countries, administrativ
e subdivisions and islands
51
13.6 (SD = 7.1)
20
Pyšek et al. 2010
Terr
estrial insects
Eur
ope
Countries, administrativ
e subdivisions and islands
53
163.3 (SD = 133.2)
21
Pyšek et al. 2010
Vascular plants
Eur
ope
Countries, administrativ
e subdivisions and islands
20
252 (SD = 185)
22
van Kleunen et al. 2015
Vascular plants
G
lobal
Countries, administrativ
e subdivisions and islands
525
257.6 (SD = 307.4)
* N
umber of r
egions r
efers to the numbers of r
egions used in this study and not the ones pr
ovided b
y the data sour
geographical units (hereafter referred to as ‘regions’), such as countries, sub-national administrative regions (e.g. federal states, provinces) or islands. Ten taxonomic groups are covered by the data. Spatial coverage (extent) differs widely, ranging from the whole world, the European continent, temperate and subtropical regions to oceanic islands.
In order to have a common geographical basis for the assignment of values of the predictor variables (below), we matched each region with the corresponding polygon of the Global Administrative Areas Database v.2.8 (GADM; http://www.gadm.org/). The GADM is the most detailed delimitation of worldwide administrative divisions available. We excluded all regions that we could not identify unambiguously, that had
no geographical match in GADM and also regions that were smaller than 1 km2 ‒ the
highest spatial resolution provided by gridded predictor variables; see below. In some cases, this resulted in reduced numbers of records compared to the original datasets (62% to 100% of the records in the original datasets kept for our analyses, average = 92% ± 10.2%). Most data sets in our collection contain a relatively low number of re-gions with 15 datasets consisting of less than 100 rere-gions and 7 of less than 50 rere-gions (Table 1).
Predictor variables
We selected nine explanatory variables representing factors that have been shown in previous studies to explain the variation in alien species richness (Kühn et al. 2003, Lambdon et al. 2008, McGeoch et al. 2010, Pyšek et al. 2010, Essl et al. 2011, Essl et al. 2013, Blackburn et al. 2016, Dawson et al. 2017, Kühn et al. 2017). These vari-ables were: geodesic area (log-transformed); insularity (island/mainland); mean annual temperature; mean annual precipitation; diversity of bioclimatic types; geographical isolation; GDP per capita; human population density and proportion of area covered by urban land use.
Geodesic area (km2) was measured using the spatial polygon of the region after
a few other sources including national and regional statistical agencies, Index Mundi (http://www.indexmundi.com/) and online reports. When data for the year 2005 was not available, we used data for the closest available year from the first decade of the
21st century. Human population density was calculated by dividing population size of
the region in 2005 by its area. The proportion of area covered by cities was calculated by dividing the area of urban land cover of the region – as measured from GlobCov-er2009 (http://due.esrin.esa.int/page_globcover.php) – by region size. For each data set, we tested for redundancy amongst the predictors using pairwise Pearson correla-tion and selected only predictors that were moderately correlated (|r|<0.7, Dormann et al. 2013). The final set of predictors considered for each dataset is shown in the Suppl. material 1: Table A1.
We performed all data processing in R (v. 3.4.1) (www.R-project.org/). The extrac-tion of values from the source gridded datasets was done using the ‘extract’ method of the RASTER (v. 2.3-40) package.
Modelling techniques used for predicting species richness
We tested five techniques for modelling alien species richness: i) GLM-P using a Pois-son distribution, ii) GLM-NB using a negative binomial distribution, iii) boosted re-gression trees using a Poisson distribution (BRT), iv) multivariate adaptive rere-gression splines (MARS) and v) random forests (RF). These methods were selected because they fall into different positions along the spectrum of statistical assumptions and mod-elling architectures, allowing a number of relevant comparisons. These include i) a comparison of GLMs having a restrictive (GLM-P) and a more relaxed distribution-al assumption (GLM-NB); ii) comparison of GLMs with machine learning models (BRT, MARS and RF) and iii) comparison of a linear regression-type machine learn-ing model (MARS) with tree ensembles-type machine learnlearn-ing models (BRT, RF). We briefly describe each of the modelling techniques used in the Suppl. material 1: Text A1. Their implementation is described below.
Generalised linear models using Poisson and negative binomial distributions
supported by the Akaike information criteria corrected for small sample sizes (AICc). We tested two options to select the models used for comparison with other meth-ods. First, we simply used the model receiving the highest support from AICc. Sec-ond, we accounted for the possibility of multiple models receiving strong support, i.e. Δ AICc < 2 and corresponded to the use of the average of their coefficients. To avoid overfitting the models by including more predictor variables than warranted by the number of observations available (Babyak 2004), the maximum number of predictor variables considered simultaneously in each multi-model comparison was set to one tenth of the number of observations being used for model calibration (Babyak 2004). The multi-model assembly and calculation of AICc were performed using the R pack-age MUMIN (v. 1.13.4).We found the accuracy of predictions from these two options to be virtually identical (Suppl. material 1: Table A2) and used the results for the best supported model by AICc for comparison with other methods. For GLM-P, over-dis-persion was calculated and detected for several of the datasets used in this study (Suppl. material 1: Table A3). For these cases, we also performed multi-model comparisons using the quasi Akaike Information criterion corrected for small sample size, QAICc, a criterion more suitable for model selection in the presence of over-dispersion. Adopt-ing QAICc, however, did not improve the models nor change the general outcome (results not shown).
Hurdle models (Potts and Elith 2006) using GLM-P and GLM-NB were also implemented for a subset of datasets with zero inflation (for details on implementa-tion see Suppl. material 1: Text A1). We found that small sample sizes impeded model convergence for some datasets and that predictions from converging models were not significantly superior to those from ‘plain’ GLM’s (Suppl. material 1: Text A1). Accord-ingly, we refer no further to the results from hurdle models in our work.
Multivariate adaptive regression splines
Multivariate adaptive regression splines (MARS; Friedman 1991) were implemented using the EARTH (v. 4.2) package of R. Interactions amongst predictor variables were not considered (i.e. only additive models), as preliminary tests revealed that interac-tions did not improve predictive performances (results not shown). Exhaustive prun-ing, a method that considers all candidate model terms, was used for selecting those to keep in the final MARS model.
Random forests
Boosted regression trees
To implement Boosted regression trees (Elith et al. 2008), we used the ‘dismo’ (v. 1.1-4) package for R with an assumed Poisson distribution for the response variable. For all models, we used a learning rate of 0.001, which implies a fairly low contribution of each tree added to the model and imposes a desirably high number of total trees in the ensemble (often > 1000) (Elith et al. 2008). Remaining parameters were kept at default values. Following the fitting of models using all predictors, we performed a stepwise variable selection procedure, in which any predictor not contributing to the decrease in model deviance was removed (Elith et al. 2008).
Assessment of predictive performance
The performance of the previous techniques in predicting alien species richness for each of the 22 datasets was assessed using two distinct approaches. The first was a leave-one-out cross-validation (Wenger and Olden 2012). In leave-one-out cross-validation, the model is fitted and used to predict one hold-out observation at a time. This is repeated until all observations are used for validation. This approach provides unbiased estimates of in-sam-ple predictive accuracies, but does not allow assessing the model performance for predic-tions outside the spatial range covered by the data set (Wenger and Olden 2012). The sec-ond approach was a k-fold regional cross-validation (Jiménez-Valverde et al. 2011). This approach, which relies on the use of geographically distinct subsets of the data, provides a reliable assessment of the accuracy of the predictions made to new, unrelated, geographi-cal domains ‒ i.e. it assesses the spatial transferability and generality of the relationships identified by the models (Wenger and Olden 2012). Here we used a 4-fold regional cross-validation in which each dataset was divided into four geographical quadrants based on the centroids of all regions. Then, regions in three quadrants were used for model fitting while one was left-out for model evaluation. The procedure is repeated four times, so that all possible three quadrant-combinations are used for model calibration.
The assessment of validation accuracy was made for two criteria: (1) agreement be-tween reported and predicted absolute values of alien species richness and (2) agreement between the rank order of reported and predicted alien species richness. For the first criterion, we calculated the ‘relative absolute error’ (RAE). An RAE of zero represents a perfect match between predicted and observed values, while 100% corresponds to the level of error that is obtained if all predictions simply represent the average of the alien species richness values used for evaluation (Witten et al. 2016). For the second criterion,
we compared the Spearman rank correlation (ρ) between predictions and left-out
obser-vations. Both criteria were calculated using the RMINER (v. 1.4) package.
target for the prediction (Elith and Graham 2009), GLM-P, GLM-NB and MARS as-sume that the trend of fitted responses continues outside the sampling space, which may lead to predictions of unrealistically high values of richness. The first evaluation con-sisted of performing the predictions from GLM-P, GLM-NB and MARS without any constraints. The second evaluation consisted in constraining these models to mimic the behaviour of BRT and RF by means of ‘clamping’ (Elith and Graham 2009). Clamping corresponds to setting the range margins of values used for prediction to the range mar-gins found in the model calibration data. That is, if (x < min) then x = min or if (x > max) then x = max; where x is the value of the predictor in the test data and min and max are the minimum and maximum values of the predictor in the calibration data, respectively.
Multiple pairwise Wilcoxon tests were used to test for significant differences in
RAE and ρ between the five modelling techniques. The differences were assessed by
comparing the performances achieved by each method in the 22 datasets of alien spe-cies richness tested. In the case of GLM-P, GLM-NB and MARS, pairwise Wilcoxon tests were also used to compare the accuracy from clamped versus the not clamped versions of the predictions.
Spatial autocorrelation
Spatial autocorrelation (SAC) in the distribution of alien species richness may lead to incorrect model parameter estimates (Dormann et al. 2007), even resulting in chang-ing the sign of the relationship (Kühn 2007). Testchang-ing for transferability is particularly important when the autocorrelation structure of the areas of calibration and prediction differ (as in the case of cross-validation applied here). We tested for SAC in the residu-als in all models during the regional cross-validation process by means of correlograms showing the correlation amongst Pearson residuals of regions over a range of uniformly distributed distance classes. The statistical significance of the correlations was based on 1000 permutations for the values of the residuals. The package NCF (v. 1.1-7) for R was use to perform the analyses. We found no or limited SAC in the residuals for the majority of models. A few significant autocorrelations occurred, but these were generally of low magnitude and did not tend to be conserved across the four-folds of regional cross-validation or across the different modelling techniques. These results led us not to consider the application of predictive models explicitly accounting for SAC.
Results
Predictive performance of alien species richness using leave-one-out cross-validation
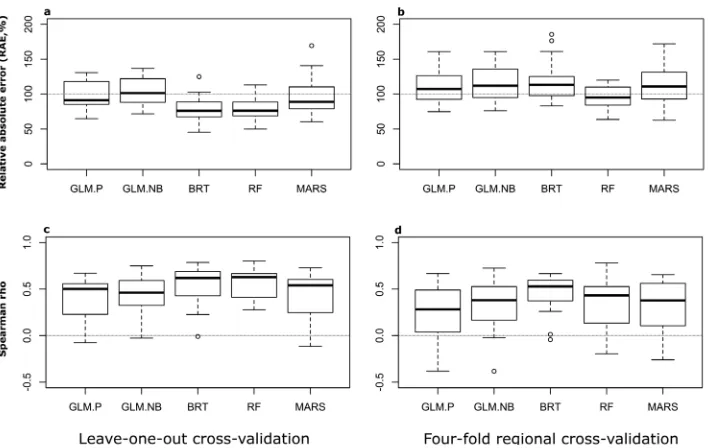
Figure 1.Detailed legend: Accuracy was measured for generalised linear models using Poisson (GLM-P) and negative binomial distributions (GLM-NB), boosted regression trees (BRT), random forests (RF) and multivariate adaptive regression splines (MARS) for predictions of the total number of alien species per
region (relative absolute error, RAE; lower is better) (a, b) and the rank order of each region (Spearman’s
rho; higher is better) (c, d). Boxplots represent variations in accuracy across 22 datasets of alien species
richness for GLM-P, GLM-NB, RF and MARS, but not for BRT. Due to model convergence issues, re-sults for BRT comprise only a subset of datasets and are thus not directly comparable with the rere-sults of
the other techniques. Panels in the right left (a, c) refer to predictions evaluated using a leave-one-out
ap-proach, which measures the accuracy of predictions within the geographical range of the model calibration
data. Panels in the right (b, d) refer to predictions evaluated using a four-fold regional cross-validation
approach, which assesses the spatial transferability of the models. A few outliers lie outside the ranges of the Y-axes, see Tables A2 and A3 for the complete list of values.
Still, these two techniques had a median RAE of about 76% and five or less datasets had a RAE higher than 90% (Figure 1a; Suppl. material 1: Table A4). The predictive performance of these two techniques was not significantly different from one another and both performed significantly better than GLM-P, GLM-NB and MARS (p < 0.05; Wilcoxon rank-sum test) (Table 2A). For GLM-P and GLM-NB, about half or more datasets had a RAE of 90% or higher.
The application of data ‘clamping’ in predictions of GLM-P, GLM-NB and MARS resulted in improvements in predictive performance for nearly all datasets (Suppl. ma-terial 1: Table A5). However, this improvement was only statistically significant for GLM-P (p < 0.05; Wilcoxon rank-sum test).
Regarding the predictions for the relative order of regions in alien species
rich-ness, these were more accurately predicted by RF (median ρ = 0.63), closely followed
from the performances achieved by GLM-P, GLM-NB and MARS (p < 0.05; Wil-coxon rank-sum test), but not for BRT (p > 0.05). BRT was also significantly better in predicting the relative order of regions in terms of alien species richness than the two GLM-type models (p < 0.05). The application of clamping to GLMs and MARS did not significantly alter their accuracy (p > 0.05; Wilcoxon rank-sum test). A reasonable
number of data sets achieved high (ρ > 0.6) degrees of correlation between the
predict-ed and observpredict-ed order of regions, particularly for the two best performing techniques
(RF and BRT), whereas weak (ρ < 0.25) correlations were less common (Figure 1C;
Suppl. material 1: Table S4).
Predictive performance of alien species richness using regional cross-validation
Results for the 4-fold regional cross-validation, which assesses the transferability of model predictions, showed a consistently worse predictive accuracy than the one evaluated by leave-one-out cross-validation. All modelling techniques showed substantially higher medians of RAE (Figure 1B; Suppl. material 1: Table A6) and, in the case of MARS, RF and BRT, the lower performance than their counterparts, evaluated by leave-one out cross-validation, was statistically significant (p < 0.05; Wilcoxon rank-sum test).
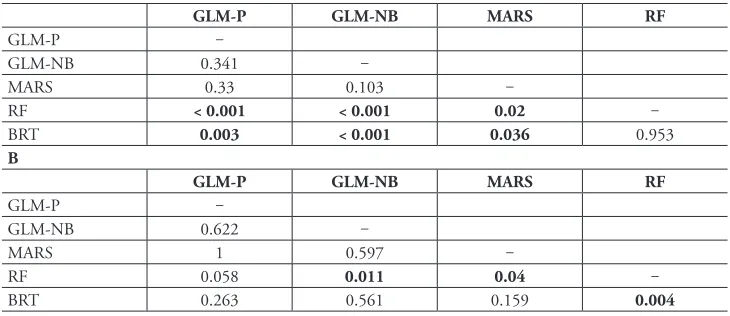
The least inaccurate technique was RF (median RAE = 95.1%; interquartile range = 25.5%) (Figure 1B; Suppl. material 1: Table S6) which showed significant (p < 0.05; Wilcoxon rank-sum test) to marginally significant (p < 0.1) differences in all pairwise comparisons with the other methods (Table 2B). Despite performing best, RF still delivers a substantial amount of error. For ten datasets, the predictions of alien species Table 2. Results of pairwise Wilcoxon tests of significant differences for the performance of the tech-niques for predicting absolute richness (as measured by relative absolute error) using leave-one-out cross-validation (A) and regional cross-cross-validation (B). Predictions of GLM-P, GLM-NB and MARS refer to
models using ‘clamped’ data (see main text). Significant differences (at α = 0.05) are shown in bold.
A
GLM-P GLM-NB MARS RF
GLM-P ‒
GLM-NB 0.341 ‒
MARS 0.33 0.103 ‒
RF < 0.001 < 0.001 0.02 ‒
BRT 0.003 < 0.001 0.036 0.953
B
GLM-P GLM-NB MARS RF
GLM-P ‒
GLM-NB 0.622 ‒
MARS 1 0.597 ‒
RF 0.058 0.011 0.04 ‒
richness were worse than the ones obtained if using simply the mean absolute value of alien species richness (i.e. RAE > 100%) and, only for eight data sets, the accuracy of RF was clearly superior (RAE ≤ 90%) to this benchmark (Suppl. material 1: Table A6). All remaining techniques performed worse, with median performance above the 100% RAE benchmark (Figure 1B; Suppl. material 1: Table A6). In addition, BRT is demanding in terms of sample size and could not be fitted for 7 of the smallest datasets (mean n = 38, S.D. = 10). The remaining techniques were able to fit models for all datasets. No significant differences in performance were found between any two tech-niques other than with RF (Table 2B).
Similarly to what was verified for leave-one-out cross validation, the application of data ‘clamping’ in predictions of absolute alien species richness by GLM-P, GLM-NB and MARS resulted in clear increases in predictive performances for nearly all datasets (Suppl. material 1: Tables A6 and A7), but this improvement was only statistically significant for GLM-P (p < 0.05; Wilcoxon rank-sum test).
For predictions of the relative order of regions in alien species richness (ρ), no
method emerges as best performing (p > 0.05; Wilcoxon rank-sum test). The applica-tion of clamping did not significantly alter the results (p > 0.05; Wilcoxon rank-sum
test). Most datasets showed moderate to low (ρ < 0.45) degrees of correlation between
the predicted and observed order of regions (Figure 1D; Suppl. material 1: Table S6).
Discussion
Our results show that values of alien species richness can be predicted with reasonable to moderate accuracy within the geographical range of the model calibration data, but only poorly in regions outside this range. This drop in predictive power was verified across modelling techniques and concerned the capacity to predict both absolute alien species richness and relative alien species richness.
Another possibility for the poor transferability of the aliens species richness models could be that the relationships (i.e. the covariance structure) between predictor and response variables and amongst response variables are not conserved in the areas that lie beyond the spatial range of the calibration data (Bahn and McGill 2013). These sorts of changes can result from real differences in the way factors influence alien spe-cies richness in the new areas (e.g. temperature may be an important limiting factor at high latitudes, but not near the tropics) or from changes in the correlation structure of the predictors (Elith et al. 2010). Importantly, these changes are more likely for pre-dictors that are proxies of the causal process, because relationships for them should be less robust to the effects of confounding factors or to changes in predictor’s correlation structures (Austin 2002). In our models, several predictors are actually proxies of the putative relevant mechanisms rather than direct measures, making them particularly susceptible to this type of problem. We stress however, that this is frequently the case in models of alien species richness, as better, proximal information is often not avail-able. One particular example refers to colonisation pressure, i.e. the number of species introduced into a region (Lockwood et al. 2009), which is a strong determinant for the number of alien species that become established (Dawson et al. 2017). In the absence of better information, colonisation pressure was represented by variables depicting variation in levels of human activity (e.g. per capita GDP; human population den-sity; proportion of urban areas). The assumption is that higher human activity should translate into higher colonisation pressure e.g. due to a higher purchase of pets and plants or to higher volumes of imported cargo potentially carrying alien species. While this relationship should hold some degree of generality (Dawson et al. 2017), it is also likely that the shape and relative importance of the relationship changes to some extent across space, given the local influence of regional-scale factors such as regulations for the importation of living animals and plants (e.g. Reino et al. 2017).
A third possible cause for the observed poor transferability of models concerns extrapolation, which is also related to the information content in the model calibra-tion data. Prediccalibra-tions made for condicalibra-tions out of the range of the calibracalibra-tion data are extremely challenging, no matter the modelling technique used (Elith and Graham 2009, Elith et al. 2010). We applied ‘clamping’ to GLMs and MARS when confronted with extrapolating conditions, mimicking the behaviour of BRT and RF. This substan-tially improved the overall accuracy of these models, providing circumstantial evidence for a substantial prevalence of extrapolation in the predictions. It is worth emphasising that, while clamping avoids ‘off the chart’ predictions under extrapolation, it does not ‘add’ extra information to the models and any extrapolating prediction, clamped or not, should generally be less accurate than a prediction made for conditions sampled by the data (i.e. interpolation). Our 4-fold regional cross-validation, which holds-out one geographical quadrant of the data at a time, should imply a substantial number of extrapolating data points, hence also likely contributing to the verified sharp drop in predictive accuracy when models are spatially transferred.
sampling data. Our results show that, under these settings, models of alien species
richness can achieve moderate (e.g. RAE ≈ 75% and ρ ≈ 0.6) predictive accuracy.
However, one of our most prominent results was that predictions from RF and BRT were significantly better, despite not being good, than those from GLM-type mod-els and MARS. This occurred even after data clamping being applied to GLMs and MARS, allowing the effect of the higher susceptibility of these models to extrapola-tion errors to be discarded.
It is not unexpected to find RF and BRT outperforming GLMs in non-transferred predictions. The model fitting process of the former techniques consists in iteratively fitting the data and testing the ability of the fitted relationships for prediction using portions of data left-out from the fitting. The leave-one-out cross-validation mimics this procedure, differing mainly in that the error levels measured are not used to retune the model. Hence, machine learning techniques are specifically optimised to predict well, based on the patterns sampled by the data. Besides, the capacity of machine learning techniques to fit complex functions could be particular relevant for models of alien species richness, because the relationships between variables in these models are often fitted along wide gradients (such as for global-scale environmental and socio-economic variation; e.g. Dawson et al. 2017), where the persistence of simple linear or monotonic relationships (as it is assumed by GLMs) should be less common. MARS, another machine learning method, was also substantially outperformed by RF and BRT. Although also able to fit non-linear functions, the complexity of MARS models is usually considerably lower than that of BRT and RF (Merow et al. 2014) which could explain its comparatively lower predictive performance.
Similarly to what was verified in the predictions of transferred models, extrapola-tion also severely harmed predicextrapola-tions made for in-sample geographical ranges. Ideally, extrapolation should be overcome by the use of additional data, sampling the extrapo-lating predictors’ space. However, when that is not possible, our results show that the use of clamping is strongly recommended. Further benefits could also be expected from the examination of the conditions leading to extrapolation, such as the identity of the predictors involved and of how far the model has to extrapolate in the predic-tors’ space. This has been assessed in SDMs previously (see, for instance, Elith et al. 2010) and allows a further refinement of the predictions by, for instance, identifying extrapolating regions of ‘low novelty’ and for which prediction could be appropriate or inversely, regions where conditions are far beyond what is sampled by the data and for which predictions should be avoided.
Conclusions
We showed that regional alien species richness cannot be predicted with reliability using the data and methods typically found in literature. Given that these data and methods already reflect best available possibilities to modellers, in the near future the coverage of information gaps on alien species richness is likely to remain entirely de-pendent on the publication and updating of alien species inventories, which reinforces recent calls for the publication of this information (Pyšek et al. 2017). A comple-mentary approach to model species richness and by some, regarded as a potential way forward, is to model and perhaps predict, patterns of alien biodiversity using measures of compositional differentiation and similarity between regions.
Two of our results are also of relevance for descriptive models of alien species rich-ness. First, we found that tree ensembles-type modelling techniques (RF and BRT) are consistently superior in predicting non-transferred values of richness than GLM and MARS. This supports the fact that flexible, non-linear, models are better able to capture information from the data than GLM, a more commonly used technique. The common justification for the use of GLM-type models for analysing alien species richness concerns their ease of interpretation. However, a number of methods have recently been developed to improve the interpretability of tree ensembles (e.g. Fokkema 2017), which may be worth considering in order to further refine our understanding about the relationships between alien species richness and spatial factors. Second, our results also warrant a call for caution in making inferences beyond the geographical (and likely also temporal) range of the data used to calibrate the models, e.g. for future projections. We recommend performing a transferability assessment of the models, as allowed, for instance, by re-gional cross-validation, in order to confirm the generality of the relationships identified.
Acknowledgements
We acknowledge the comments from one anonymous reviewer and Cang Hui who helped to improve the manuscript. CC was supported by a postdoctoral grant from FEDER Funds through the Operational Competitiveness Factors Programme “COMPETE” and by National Funds through the Foundation for Science and Tech-nology (FCT) within the framework of project “PTDC/AAG-GLO/0463/2014-PO-CI-01-0145-FEDER-016583”. FE acknowledges funding from the Austrian Science Fund (FWF, grant I2086-B16). HS was supported by a grant from the Deutsche Forschungsgemeinschaft (DFG, grant SE 1891/2-1).
References
Babyak MA (2004) What you see may not be what you get: a brief, nontechnical introduction to overfitting in regression-type models. Psychosomatic Medicine 66: 411–421. http:// psycnet.apa.org/doi/10.1097/01.psy.0000127692.23278.a9
Bahn V, McGill BJ (2013) Testing the predictive performance of distribution models. Oikos 122: 321–331. https://doi.org/10.1111/j.1600-0706.2012.00299.x
Bertelsmeier C, Luque GM, Hoffmann BD, Courchamp F (2015) Worldwide ant invasions under climate change. Biodiversity Conservation 24: 117–128. https://doi.org/10.1007/ s10531-014-0794-3
Blackburn TM, Essl F, Evans T, Hulme PE, Jeschke JM, Kühn I, Kumschick S, Marková Z, Mrugała A, Nentwig W, Pergl J, Pyšek P, Rabitsch W, Ricciardi A, Richardson DM, Sendek A, Vilà M, Wilson JRU, Winter M, Genovesi P, Bacher S (2014) A unified classification of alien species based on the magnitude of their environmental impacts. PLoS Biology 12: e1001850. https://doi.org/10.1371/journal.pbio.1001850
Blackburn TB, Delean S, Pyšek P, Cassey P (2016) On the island biogeography of aliens: a global analysis of the richness of plant and bird species on oceanic islands. Global Ecology and Biogeography 25: 859–868. https://doi.org/10.1111/geb.12339
Breiman L (2001) Random Forests. Machine Learning 45: 5–32. https://doi. org/10.1023/A:1010933404324
Brewer MJ, Butler A, Cooksley SL (2016) The relative performance of AIC, AICC and BIC in the presence of unobserved heterogeneity. Methods in Ecology and Evolution 7: 679–692. https://doi.org/10.1111/2041-210X.12541
Burnham KP, Anderson DR (2002) Model selection and multimodel inference. 2nd edition. Springer, New York, 1–488.
Calabrese JM, Certain G, Kraan C, Dormann CF (2014) Stacking species distribution models and adjusting bias by linking them to macroecological models. Global Ecology and Bioge-ography 23: 99–112. https://doi.org/10.1111/geb.12102
Capinha C, Essl F, Seebens H, Moser D, Pereira HM (2015) The dispersal of alien species redefines biogeography in the Anthropocene. Science 348: 1248–1251. https://doi. org/10.1126/science.aaa8913
Capinha C, Seebens H, Cassey P, García-Díaz P, Lenzner B, Mang T, Moser D, Pyšek P, Rödder D, Scalera R, Winter M, Dullinger S, Essl F (2017) Diversity, biogeography and the global flows of alien amphibians and reptiles. Diversity and Distributions 23: 1313–22. https:// doi.org/10.1111/ddi.12617
Catford JA, Vesk PA, Richardson DM, Pyšek P (2012) Quantifying levels of biological in-vasion: towards the objective classification of invaded and invasible ecosystems. Global Change Biology 18: 44–62. https://doi.org/10.1111/j.1365-2486.2011.02549.x
Dawson W, Moser D, Kleunen M van, Kreft H, Pergl J, Pyšek P, Weigelt P, Winter M, Lenzner B, Blackburn TM, Dyer EE, Cassey P, Scrivens SL, Economo EP, Guénard B, Capinha C, Seebens H, García-Díaz P, Nentwig W, García-Berthou E, Casal C, Mandrak NE, Fuller P, Meyer C, Essl F (2017) Global hotspots and correlates of alien species richness across taxonomic groups. Nature Ecology & Evolution 1: s41559-017-0186–017. https://doi.org/10.1038/s41559-017-0186 Dormann CF, McPherson JM, Araújo MB, Bivand R, Bolliger J, Carl G, Davies RG, Hirzel
of species distributional data: a review. Ecography 30: 609–628. https://doi.org/10.1111/ j.2007.0906-7590.05171.x
Dormann CF, Elith J, Bacher S, Buchmann C, Carl G, Carré G, Marquéz JRG, Gruber B, La-fourcade B, Leitão PJ, Münkemüller T, McClean C, Osborne PE, Reineking B, Schröder B, Skidmore AK, Zurell D, Lautenbach S (2013) Collinearity: a review of methods to deal with it and a simulation study evaluating their performance. Ecography 36: 27–46. https:// doi.org/10.1111/j.1600-0587.2012.07348.x
Dornelas M, Gotelli NJ, McGill B, Shimadzu H, Moyes F, Sievers C, Magurran AE (2014) Assemblage Time Series Reveal Biodiversity Change but Not Systematic Loss. Science 344: 296–299. https://doi.org/10.1126/science.1248484
Elith J, Graham CH (2009) Do they? How do they? WHY do they differ? On finding reasons for differing performances of species distribution models. Ecography 32: 66–77. https:// doi.org/10.1111/j.1600-0587.2008.05505.x
Elith J, Leathwick JR, Hastie T (2008) A working guide to boosted regression trees. Journal of Animal Ecology 77: 802–813. https://doi.org/10.1111/j.1365-2656.2008.01390.x Elith J, Kearney M, Phillips S (2010) The art of modelling range‐shifting species. Methods in
Ecology and Evolution 1: 330–342. https://doi.org/10.1111/j.2041-210X.2010.00036.x Elith J, Phillips SJ, Hastie T, Dudík M, Chee YE, Yates CJ (2011) A statistical explanation of
MaxEnt for ecologists. Diversity and Distributions 17: 43–57. https://doi.org/10.1111/ j.1472-4642.2010.00725.x
Essl F, Mang T, Dullinger S, Moser D, Hulme PE (2011) Macroecological drivers of alien conifer naturalizations worldwide. Ecography 34: 1076–1084. https://doi.org/10.1111/ j.1600-0587.2011.06943.x
Essl F, Steinbauer K, Dullinger S, Mang T, Moser D (2013) Telling a different story: a glob-al assessment of bryophyte invasions. Biologicglob-al Invasions 15: 1933–1946. https://doi. org/10.1007/s10530-013-0422-2
Fokkema M (2017) pre: An R Package for Fitting Prediction Rule Ensembles. arXiv preprint arXiv: 170707149. https://arxiv.org/abs/1707.07149
Friedman JH (1991) Multivariate Adaptive Regression Splines. The Annals of Statistics 19: 1–67. https://doi.org/10.1214/aos/1176347963
Gennaioli N, Porta RL, Silanes FLD, Shleifer A (2014) Growth in regions. Journal of Eco-nomic Growth 19: 259–309. https://doi.org/10.1007/s10887-014-9105-9
Heikkinen RK, Marmion M, Luoto M (2012) Does the interpolation accuracy of species dis-tribution models come at the expense of transferability? Ecography 35: 276–288. https:// doi.org/10.1111/j.1600-0587.2011.06999.x
Hui C, McGeoch MA (2014) Zeta diversity as a concept and metric that unifies inci-dence-based biodiversity patterns. The American Naturalist 184: 684–694. https://doi. org/10.1086/678125
Jarnevich CS, Stohlgren TJ, Barnett D, Kartesz J (2006) Filling in the gaps: modelling native species richness and invasions using spatially incomplete data. Diversity and Distributions 12: 511–520. https://doi.org/10.1111/j.1366-9516.2006.00278.x
Kühn I (2007) Incorporating spatial autocorrelation may invert observed patterns. Diversity and Distributions 13: 66–69. https://doi.org/10.1111/j.1472-4642.2006.00293.x
Kühn I, Brandl R, May R, Klotz S (2003) Plant distribution patterns in Germany – Will aliens match natives? Feddes Repertorium 114: 559–573. https://doi.org/10.1002/ fedr.200311015
Kühn I, Wolf J, Schneider A (2017) Is there an urban effect in alien plant invasions? Biological Invasions 19: 3505–3513. https://doi.org/10.1007/s10530-017-1591-1
Lambdon PW, Pyšek P, Basnou C, Delipetrou P, Essl F, Hejda M, Jarošík V, Pergl J, Winter M, Andriopoulos P, Arianoutsou M, Bazos I, Brundu G, Celesti-Grapow L, Chassot P, Jogan N, Josefsson M, Kark S, Klotz S, Kokkoris Y, Kühn I, Marchante H, Perglová I, Vilà M, Zikos A, Hulme PE (2008) Alien flora of Europe: species diversity, geographical pattern and state of the art of research. Preslia 80: 101–149. http://www.preslia.cz/P082Lam.pdf Latombe G, Pyšek P, Jeschke JM, Blackburn TM, Bacher S, Capinha C, Costello MJ,
Fernán-dez M, Gregory RD, Hobern D, Hui C, Jetz W, Kumschick S, McGrannachan C, Pergl J, Roy HE, Scalera R, Squires ZE, Wilson JRU, Winter M, Genovesi P, McGeoch MA (2017) A vision for global monitoring of biological invasions. Biological Conservation. https://doi.org/10.1016/j.biocon.2016.06.013
Lockwood JL, Cassey P, Blackburn TM (2009) The more you introduce the more you get: The role of colonization pressure and propagule pressure in invasion ecology. Diversity and Distributions 15: 904–910. https://doi.org/10.1111/j.1472-4642.2009.00594.x
McGeoch MA, Butchart SHM, Spear D, Marais E, Kleynhans EJ, Symes A, Chanson J, Hoffmann M (2010) Global indicators of biological invasion: species numbers, biodi-versity impact and policy responses. Dibiodi-versity and Distributions 16: 95–108. https://doi. org/10.1111/j.1472-4642.2009.00633.x
Merow C, Smith MJ, Edwards TC, Guisan A, McMahon SM, Normand S, Thuiller W, Wüest RO, Zimmermann NE, Elith J (2014) What do we gain from simplicity versus complex-ity in species distribution models? Ecography 37: 1267–1281. https://doi.org/10.1111/ ecog.00845
Metzger MJ, Bunce RGH, Jongman RHG, Sayre R, Trabucco A, Zomer R (2013) A high-resolution bioclimate map of the world: a unifying framework for global biodiversity research and monitoring. Global Ecology and Biogeography, 22: 630–638. https://doi. org/10.1111/geb.1202
Nelson A (2008) Travel Time to Major Cities: A Global Map of Accessibility. Ispra: European Commission. http://forobs.jrc.ec.europa.eu/products/gam/
Nobis MP, Jaeger JAG, Zimmermann NE (2009) Neophyte species richness at the landscape scale under urban sprawl and climate warming. Diversity and Distributions 15: 928–939. https://doi.org/10.1111/j.1472-4642.2009.00610.x
Pompe S, Hanspach J, Badeck F, Klotz S, Thuiller W, Kühn I (2008) Climate and land use change impacts on plant distributions in Germany. Biology Letters 4: 564–567. https:// doi.org/10.1098/rsbl.2008.0231
Flora und Vegetation in Deutschland Ergebnisse aus dem F+E-Vorhaben FKZ 805 81 001. Bundesamt Für Naturschutz. BfN-Skripten 304: 1–193.
Potts JM, Elith J (2006) Comparing species abundance models. Ecological Modelling 199: 153–163. https://doi.org/10.1016/j.ecolmodel.2006.05.025
Pyšek P, Richardson DM, Pergl J, Jarošík V, Sixtová Z, Weber E (2008) Geographical and taxo-nomic biases in invasion ecology. Trends in Ecology and Evolution 23: 237–244. https:// doi.org/10.1016/j.tree.2008.02.002
Pyšek P, Jarošík V, Hulme PE, Kühn I, Wild J, Arianoutsou M, Bacher S, Chiron F, Didžiulis V, Essl F, Genovesi P, Gherardi F, Hejda M, Kark S, Lambdon PW, Desprez-Loustau M-L, Nentwig W, Pergl J, Poboljšaj K, Rabitsch W, Roques A, Roy DB, Shirley S, Solarz W, Vilà M, Winter M (2010) Disentangling the role of environmental and human pressures on biological invasions across Europe. Proceedings of the National Academy of Sciences of the United States of America 107: 12157–12162. https://doi.org/10.1073/pnas.1002314107 Pyšek P, Meyerson LA, Simberloff D (2017) Introducing “Alien Floras and Faunas”, a new
series in Biological Invasions. Biological Invasions: 1–2. https://doi.org/10.1007/s10530-017-1648-1
Randin CF, Dirnböck T, Dullinger S, Zimmermann NE, Zappa M, Guisan A (2006) Are niche-based species distribution models transferable in space? Journal of Biogeography 33: 1689–1703. https://doi.org/10.1111/j.1365-2699.2006.01466.x
Reino L, Figueira R, Beja P, Araújo MB, Capinha C, Strubbe D (2017) Networks of global bird invasion altered by regional trade ban. Science Advances 3: e1700783. https://doi. org/10.1126/sciadv.1700783
Seebens H, Gastner MT, Blasius B (2013) The risk of marine bioinvasion caused by global ship-ping. Ecology Letters 16: 782–790. https://doi.org/10.1111/ele.12111
Seebens H, Blackburn TM, Dyer EE, Genovesi P, Hulme PE, Jeschke JM, Pagad S, Pyšek P, Winter M, Arianoutsou M, Bacher S, Blasius B, Brundu G, Capinha C, Celesti-Grapow L, Dawson W, Dullinger S, Fuentes N, Jäger H, Kartesz J, Kenis M, Kreft H, Kühn I, Lenzner B, Liebhold A, Mosena A, Moser D, Nishino M, Pearman D, Pergl J, Rabitsch W, Rojas-Sandoval J, Roques A, Rorke S, Rossinelli S, Roy HE, Scalera R, Schindler S, Štajerová K, Tokarska-Guzik B, van Kleunen M, Walker K, Weigelt P, Yamanaka T, Essl F (2017) No saturation in the accumulation of alien species worldwide. Nature Communications 8: 14435. https://doi.org/10.1038/ncomms14435
Vandekerkhove J, Cardoso AC, Boon PJ (2013) Is there a need for a more explicit accounting of invasive alien species under the Water Framework Directive? Management of Biological Invasions 4: 25–36. https://doi.org/10.3391/mbi.2013.4.1.04
Villaseñor JL, Espinosa-Garcia FJ (2004) The alien flowering plants of Mexico. Diversity and Distributions 10: 113–123. https://doi.org/10.1111/j.1366-9516.2004.00059.x
Wenger SJ, Olden JD (2012) Assessing transferability of ecological models: an underappreciat-ed aspect of statistical validation. Methods in Ecology and Evolution 3: 260–267. https:// doi.org/10.1111/j.2041-210X.2011.00170.x
Westphal MI, Browne M, MacKinnon K, Noble I (2007) The link between international trade and the global distribution of invasive alien species. Biological Invasions 10: 391–398. https://doi.org/10.1007/s10530-007-9138-5
Witten IH, Frank E, Hall MA, Pal CJ (2016) Data Mining: Practical Machine Learning Tools and Techniques. Morgan Kaufmann: 1–655.
Supplementary material 1
Table A1–A5
Authors: César Capinha, Franz Essl, Hanno Seebens, Henrique Miguel Pereira, Ingolf Kühn
Data type: ecology data
Copyright notice: This dataset is made available under the Open Database License (http://opendatacommons.org/licenses/odbl/1.0/). The Open Database License (ODbL) is a license agreement intended to allow users to freely share, modify, and use this Dataset while maintaining this same freedom for others, provided that the original source and author(s) are credited.