T E C H N I C A L A D V A N C E
Open Access
Developing a weighting strategy to include mobile
phone numbers into an ongoing population health
survey using an overlapping dual-frame design
with limited benchmark information
Margo L Barr
1,2*, Raymond A Ferguson
1, Phil J Hughes
2and David G Steel
2Abstract
Background:In 2012 mobile phone numbers were included into the ongoing New South Wales Population Health
Survey (NSWPHS) using an overlapping dual-frame design. Previously in the NSWPHS the sample was selected using random digit dialing (RDD) of landline phone numbers. The survey was undertaken using computer assisted telephone interviewing (CATI). The weighting strategy needed to be significantly expanded to manage the differing probabilities of selection by frame, including that of children of mobile-only phone users, and to adjust for the increased chance of selection of dual-phone users. This paper describes the development of the final weighting strategy to properly combine the data from two overlapping sample frames accounting for the fact that population benchmarks for the different sampling frames were not available at the state or regional level.
Methods:Estimates of the number of phone numbers for the landline and mobile phone frames used to calculate the differing probabilities of selection by frame, for New South Wales (NSW) and by stratum, were obtained by apportioning Australian estimates as none were available for NSW. The weighting strategy was then developed by calculating person selection probabilities, selection weights, applying a constant composite factor to the dual-phone users sample weights, and benchmarking to the latest NSW population by age group, sex and stratum.
Results:Data from the NSWPHS for the first quarter of 2012 was used to test the weighting strategy. This consisted of data on 3395 respondents with 2171 (64%) from the landline frame and 1224 (36%) from the mobile frame. However, in order to calculate the weights, data needed to be available for all core weighting variables and so 3378 respondents, 2933 adults and 445 children, had sufficient data to be included. Average person weights were 3.3 times higher for the mobile-only respondents, 1.3 times higher for the landline-only respondents and 1.7 times higher for dual-phone users in the mobile frame compared to the dual-phone users in the landline frame. The overall weight effect for the first quarter of 2012 was 1.93 and the coefficient of variation of the weights was 0.96. The weight effects for 2012 were similar to, and in many cases less than, the effects found in the corresponding quarter of the 2011 NSWPHS when only a landline based sample was used.
Conclusions:The inclusion of mobile phone numbers, through an overlapping dual-frame design, improved the coverage of the survey and an appropriate weighing procedure is feasible, although it added substantially to the complexity of the weighting strategy. Access to accurate Australian, State and Territory estimates of the number of landline and mobile phone numbers and type of phone use by at least age group and sex would greatly assist in the weighting of dual-frame surveys in Australia.
* Correspondence:[email protected]
1Centre for Epidemiology and Evidence, NSW Ministry of Health, 73 Miller Street, North Sydney, Australia
2National Institute for Applied Statistics Research Australia, University of Wollongong, Wollongong, Australia
Background
Since 2002 information about the health of the New South Wales (NSW) population has been obtained using the NSW Population Health Survey (NSWPHS) [1]. This survey is a continuous sample survey of approximately 15,000 persons each year. The survey is stratified by health administration area and equal numbers are selected from each of the strata, using random digit dialing (RDD) of landline phone numbers and computer assisted telephone interviewing (CATI) with one person from the selected household being randomly selected.
Because of the potential for non-coverage bias from the growing number of mobile-only phone users in the population, estimated to be 19% in Australia in 2011 [2], mobile phone numbers were included in 2012 using an overlapping dual-frame design. Coverage bias is the product of the proportion of the population not covered and the difference in the mean of the variable of interest between the covered group and the non-covered group [3]. Evidence from the National Health Interview Survey (NHIS) in the US has shown the mobile-only phone users substantial different for the health indicators: five or more drinks in one day at least once in the past year (17.5% v 30.5% - 74% higher), current smokers (14.5% v 24.3% - 68% higher), and ever diagnosed with diabetes (10.8% v 6.2% - 43% lower) [4].
The landline phone sample procedures were the same as in previous years. The mobile phone sample procedures were as follows; NSW residents were selected using RDD of mobile phone numbers using CATI and the mobile phone owner was selected. If the respondent had one or more children one child was also selected at random in order to ensure that children of people who did not have a landline were also included. Further details about the meth-odology, call outcomes and representation of the sample in the first quarter of 2012 are provided in Barr et al. [5], and the questions in the questionnaire are available from the survey website [1]. In the overlapping dual-frame design there are three types of phone use; mobile-only, landline-only and dual-phone users-people with a mobile phone and living in a household with a landline phone—who could now be selected though either the landline or mobile phone number sampling frames.
In the previous landline based samples for the NSWPHS, equal sample sizes were used in each stratum, even though the populations differed substantially and therefore the probability of selection varied by stratum. Moreover, as one person was randomly selected from each selected household, the probability of selection also varied by household size. Weights were calculated for use in survey estimation to account for the differences in probabilities of selection and then benchmarked to the latest NSW population by age group, sex and stratum as shown in Steel [6] and summarised in Appendix A. The use of equal
probabilities to select landline phones in each stratum meant that the factor Th
th, which is the ratio of phone numbersThin stratumhto the number of phone numbers
in the sample th, cancelled in the previous calculation of
the weights, and so the actual number of landline phone numbers in each of the strata did not need to be known. However, with the inclusion of the mobile phone frame this is not the case and the number of landlines and mobile phone numbers in the population for each stratum needed to be estimated. In 2011 the Australian Communication and Media Authority (ACMA) estimated that there were 29.28 million mobile phone numbers and 10.54 million landline phone numbers in Australia [2]. Estimates, how-ever, are not routinely provided by State, let alone by health administration area.
As the previous NSWPHS samples came from a single frame the weighting did not need to account for the differ-ing chances of selection by type of phone use. However, with the inclusion of the mobile phone numbers, using an overlapping dual-frame design, dual-phone users now have an increased chance of selection because they could be selected from either frame. There is currently a growing body of knowledge on issues and methods to deal with overlapping frames as summarised in the American Association for Public Opinion Research (AAPOR): Cell Phone Task Force Report [7], and in particular the use of composite weights to adjust for the increased chance of selection of dual-phone users. However the most recent detailed description of dual frame weighting available in Australia from the Dual-frame Omnibus Survey conducted in 2012 did not need to deal with disproportionate stratification of the landline frame, data needing to be collected about children as well as adults, and how to apply an overlap adjustment [8].
Hartley 1962 and 1974 [9,10] first described the calcula-tion of these composite weights in overlapping frames. We use the notation ofAfor landline frame,Bfor the mobile frame,Yfor the population total of interest,y for the esti-mator, a for landline only component, b for mobile only component and ab for dual phone users component. In this case the composite estimator is defined as
ycomp=ya+yb+yλ where the estimate for the overlap population is yλ¼yAabþð1−λÞyBab with yAab and yBab being the estimators for persons with both mobile and landlines from frame A and B respectively and the composite factor being between 0 and 1 (0 <λ <1). Most overlapping dual frame surveys conducted to date have used a constant com-posite factorλand the most common value is 0.5 [11-13]. So with overlapping dual-frames design surveys being relatively new in Australia [5,8,14,15] the use of λ= 0.5 as the compositing factor was considered appropriate.
well as population benchmarks [7]. In the USA type of phone use benchmarks, at the national level, are collected using the NHIS [16], where questions on residential phone use have been included since 1963 and mobile phone use since 2003.
Currently there is no equivalent source of information on type of phone use in Australia, although landline phone use from the Australian Health Survey (AHS) conducted by the Australian Bureau of Statistics (ABS), are expected to be available in 2014 [17]. However, landline and mobile phone use questions have been included in the Roy Morgan Single Source Survey (RMSSS) since 2005 [18] for ACMA communication reporting. It was estimated in the 2010–11 report that as at June 2011, 74% of adults in Australia lived in a household with a landline and a mobile phone, 5% lived in a household with a landline but no mobile phone, and 19% lived in a household with only a mobile phone; with the highest mobile-only phone rates being in young adults (37% in 18 to 24 year olds) [2].
Because weights are used to eliminate bias that would arise from ignoring the differences in selection probabilities and also to improve estimates by adjusting to known population benchmarks, when a design change occurs it is also important to assess how the design effect changes due to weighting, using weighting effects. The design effect is the factor by which the sampling variances are larger (or smaller) than those associated with a simple random sample and no weighting [3].
This paper describes and details the final weighting strategy adopted to properly combine the data from the two overlapping sample frames in the NSWPHS and the benchmark populations used, based on the limited infor-mation available in Australia. We then compare the weight effects for the overlapping dual-frame sampling design to the previous landline frame sampling design.
Methods
Within a stratum the landline sample was selected using equal probability of selection of landline phone numbers and then random selection of one person from the selected household. In the mobile phone sample an equal probability sample of mobile phone numbers in Australia was selected and screened for adult residents in NSW. If the respondent has one or more children one child was selected at random.
Final weighting strategy
For the sampling design used person selection probabilities for the landline frame and mobile frame were derived as follows:
personijhfrom the landline frameπAijh¼ tAh
TA h
TA jh
Njh
adultifrom the mobile frameπBi ¼TtBBT B i
Ni
childcfrom parentpfrom the mobile frame
πB cj¼πBp
Ncp
Ncj
Where: i denotes an eligible person; c denotes a child of an eligible person; p denotes a parent; h
denotes the stratum; j denotes a household; N denotes population size; T denotes number of phone numbers in the population;tdenotes number of phone numbers in the sample; A denotes landline frame; B denotes mobile frame. For the design used Ni= 1 and Ncp is
the number of parents that a child selected through a parent in the mobile phone frame has and Ncj is the
number of children in the household of the parent. The weights were then the inverse w=π−1 in each situation.
The sample weights of the dual phone-users were then adjusted using the composite factor λ set at 0.5. So for those dual phone-users selected from:
the landline frame the composite weights were
wλijh¼λwAijh
the mobile frame the composite weights were
wλi ¼ð1−λÞwBi
Benchmarking to the reference population was then performed, as per previous years, by adjusting the weights obtained from the combined landline and mobile phone sample, by age and sex to the ABS mid-year population estimates for each stratum, Ndh
[19]. This was achieved by summing the weights for the age and sex celld in stratumh, to produce a survey estimate of the population in that cell, N^dh and then multiplying the weights byNdh
^ Ndh.
Estimation of number of phone numbers in NSW by frame
The weights described above require the number of landline telephones in stratum h, TAh, and the number of mobile phone numbers in NSW, TBNSW. As there was no specific NSW residential landline phone data
These procedures produce estimates as follows:
TAh ¼
NhP^Ah
NAustPAAust
TAAust and
TB NSW ¼
NNSWP^BNSW
NAustPBAust
TB Aust
Where P^A
h denotes the estimated proportion of people living in a household with a landline phone in stratumh
andP^B
NSW is the estimated proportion of people in NSW with a mobile phone.
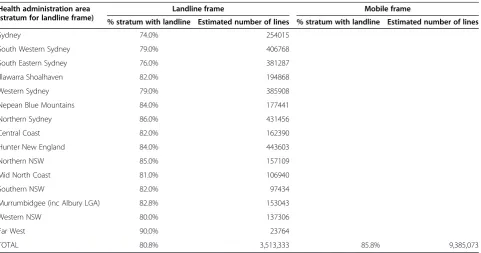
Table 1 shows the estimated number of phone numbers by frame for NSW. We estimated that there were 3.5 million residential landline phone numbers and 9.8 million mobile phone numbers in NSW and landline numbers in the strata ranged from 23,764 in Far West health administration area to 443,603 in Hunter New England health administration area.
Results
Data from the NSWPHS for the first quarter of 2012 was used to test the weighting strategy. This consisted of data on 3395 respondents with 2171 (64%) from the landline frame, with 17.6% being landline-only, and 1224 (36%) from the mobile frame, with 25.8% being mobile-only.
Core weighting variables
Data needed to be available for all core weighting variables including age, sex, stratum, number of landline phones, number of mobile phones they personally have, and
eligible persons in the household. If the respondent re-fused to provide their age or sex the interview was termi-nated. For the landline frame imputation was used for number of persons in household (1 if missing and 10 if greater than 10), number of landlines phones in household (1 if 0 or missing and 5 if greater than 5), number of per-sonal mobile phones (substitute with 0 if missing and to 5 if greater than 5). For the mobile frame imputation was used for number of children in household (1 if missing and 6 if greater than 6), number of landlines in household (substitute with 0 if missing and to 5 if greater than 5) and number of personal mobile phones (substitute with 1 if 0 or missing and to 5 if greater than 5). If values could not be imputed for missing and/or erroneous core weighting variables then the record was removed from the dataset.
Data needed to be imputed, using these rules for 29 respondents for number of landline phones in the household (10 from landline frame and 19 from the mobile frame) and 26 respondents for number of personal mobile phones (15 from the landline frame and 11 from the mobile frame). The majority of respondents (97%) recruited through the landline frame were, using postcode/suburb and/or local government area provided by the respondent during the interview, in the same stratum as initially allocated, with the majority of the mismatches being within the metropolitan health administration areas (55/72; 76%) where phone numbers are more transportable. All of the respondents recruited through the mobile frame, except for 17, could be allo-cated to a stratum using postcode/suburb and/or local
Table 1 Number of phone numbers by frame for NSW
Health administration area (stratum for landline frame)
Landline frame Mobile frame
% stratum with landline Estimated number of lines % stratum with landline Estimated number of lines
Sydney 74.0% 254015
South Western Sydney 79.0% 406768
South Eastern Sydney 76.0% 381287
Illawarra Shoalhaven 82.0% 194868
Western Sydney 79.0% 385908
Nepean Blue Mountains 84.0% 177441
Northern Sydney 86.0% 431456
Central Coast 82.0% 162390
Hunter New England 84.0% 443603
Northern NSW 85.0% 157109
Mid North Coast 81.0% 106940
Southern NSW 82.0% 97434
Murrumbidgee (inc Albury LGA) 82.8% 153043
Western NSW 80.0% 137306
Far West 90.0% 23764
government area provided by the respondent during the interview. This resulted in 3378 respondents, 2933 adults and 445 children, for which weights could be calculated.
Calculation of the weights
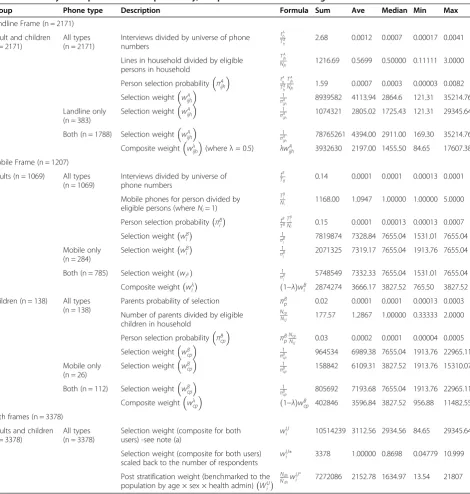
Table 2 shows the summary statistics by frame for the sample divided by number of phone lines in the population, phone lines in the household divided by eligible persons in household, person selection probabilities, person weights,
and the composite weights for dual phone-users. Average person weights were 3.3 times higher for the mobile-only respondents, 1.3 times higher for the landline-only respondents and 1.7 times higher for dual-phone users in the mobile frame compared to the dual-phone users in the landline frame.
Table 2 also shows the summary statistics for the person weights, composite for dual-phone users, scaled back to the number of respondents in the sample and for
Table 2 Summary of the person selection probability, composite and benchmark weight statistics for each of the frames
Group Phone type Description Formula Sum Ave Median Min Max
Landline Frame (n = 2171)
Adult and children (n = 2171)
All types (n = 2171)
Interviews divided by universe of phone numbers
tA h TA h
2.68 0.0012 0.0007 0.00017 0.0041
Lines in household divided by eligible persons in household
TA jh
Njh 1216.69 0.5699 0.50000 0.11111 3.0000
Person selection probability πA ijh tA h TA h TA jh
Njh 1.59 0.0007 0.0003 0.00003 0.0082
Selection weight wA ijh
1 πA ijh
8939582 4113.94 2864.6 121.31 35214.76
Landline only (n = 383)
Selection weight wA ijh
1 πA ijh
1074321 2805.02 1725.43 121.31 29345.64
Both (n = 1788) Selection weight wA ijh
1 πA ijh
78765261 4394.00 2911.00 169.30 35214.76
Composite weightwλijh(whereλ= 0.5) λwA
ijh 3932630 2197.00 1455.50 84.65 17607.38
Mobile Frame (n = 1207)
Adults (n = 1069) All types (n = 1069)
Interviews divided by universe of phone numbers
tB
TB 0.14 0.0001 0.0001 0.00013 0.0001
Mobile phones for person divided by eligible persons (whereNi= 1)
TB i
Ni 1168.00 1.0947 1.00000 1.00000 5.0000
Person selection probability πB
i t B TB TB
i
Ni 0.15 0.0001 0.00013 0.00013 0.0007 Selection weight wB
i π1B i
7819874 7328.84 7655.04 1531.01 7655.04
Mobile only (n = 284)
Selection weight wB
i π1B i
2071325 7319.17 7655.04 1913.76 7655.04
Both (n = 785) Selection weightð ÞwiB π1B
i 5748549 7332.33 7655.04 1531.01 7655.04 Composite weight wλi ð1−λÞwB
i 2874274 3666.17 3827.52 765.50 3827.52
Children (n = 138) All types (n = 138)
Parents probability of selection πB
p 0.02 0.0001 0.0001 0.00013 0.0003
Number of parents divided by eligible children in household
Ncp
Ncj 177.57 1.2867 1.00000 0.33333 2.0000
Person selection probability πB
cp πBp Ncp
Ncj 0.03 0.0002 0.0001 0.00004 0.0005 Selection weight wB
cp
1 πB
cp 964534 6989.38 7655.04 1913.76 22965.11 Mobile only
(n = 26)
Selection weight wB cp
1 πB
cp 158842 6109.31 3827.52 1913.76 15310.07
Both (n = 112) Selection weight wB cp
1 πB
cp 805692 7193.68 7655.04 1913.76 22965.11 Composite weight wλcp
1−λ
ð ÞwB
cp 402846 3596.84 3827.52 956.88 11482.55
Both frames (n = 3378)
Adults and children (n = 3378)
All types (n = 3378)
Selection weight (composite for both users) -see note (a)
wU
i 10514239 3112.56 2934.56 84.65 29345.64
Selection weight (composite for both users) scaled back to the number of respondents
wUi 3378 1.00000 0.8698 0.04779 10.999
Post stratification weight (benchmarked to the population by age × sex × health admin) WU i Ndh
^
Ndhw U
i 7272086 2152.78 1634.97 13.54 21807
(a) The weightwU
i is the selection weight relevant to the segment of the overall sample from which the respondent was selected. For those respondents
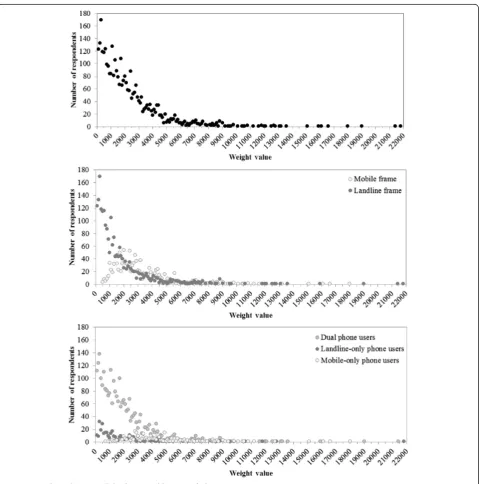
the weights for the dual-frame when benchmarked to the NSW population by age group, sex and stratum. The mean final weight was 2,152, ranging from 14 for a 76 year old female dual-phone user in Far West health administra-tion area recruited through the landline frame to 21,807 for a 76 year old male landline-only phone user in South East Sydney health administration area recruited through the landline frame. The distributions of the final weights are shown in Figure 1. Figure 1 also shows the distributions of the final weights by frame and type of phone use for comparison. Most of the
variability in the weights is due to the stratification by health administration area with equal number of respondents being selected for each health administra-tion area which is disproporadministra-tionate to the popula-tions. Because there is no geography on mobile phone numbers no stratification can occur and very few of the mobile phone frame sample comes from rural areas. Once benchmarked to the populations the urban areas get quite high weights and rural areas quite low weights. For example in Far West health administration area 82% of the weights are less than
500, whereas in South East Sydney health administration area only 2% of the weights are less than 500 and 43% are 4000 or greater.
The weight effects were calculated usingweff ¼n
X
w2i
ðXwiÞ2
where: n denotes sample size and w denotes weights [20-22]. The weight effect is the design effect due to weight-ing and is equal to 1þC2W, whereCWis the coefficient of
variation of the weights (i.e. the standard deviation of the weights divide by the mean of the weights) and is a standar-dised measure of the variation of the weights.
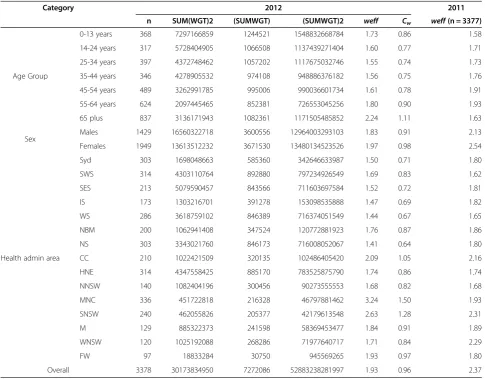
Table 3 shows the weight effects and coefficient of variation of the weights for each of the weighting param-eters for the first quarters of 2012. As shown in Table 3 the overall weight effect for the first quarter of 2012 was 1.93 and the coefficient of variation of the weights was 0.96. Weight effects varied by: age group, from 1.55 in 25–34 years to 2.24 in 65 plus years; sex, from 1.83 in males to 1.97 in females; and stratum, from 1.41 in
North Sydney health administration area, to 3.24 in Mid North Coast health administration area. The highest coefficient of variation of the weights was 1.5 for Mid North Coast health administration area. In both the previous landline only survey and the dual frame approach weights vary because of use of difference selection probabilities between strata, the sampling of one person per household and the calibration to age-sex benchmarks. Also as shown in Table 3 the weight effects for 2012 were similar to, and in many cases less than, the effects found in the corresponding quarter of the 2011 NSWPHS when only a landline based sample was used.
Discussion
The development of the weighting strategy, weighted for the person selection probabilities by frame, composite weights applied to dual-phone users, and benchmarked to the NSW population, was more complex than it had been for the previous landline frame. It was however encouraging that the weight effects were similar to those
Table 3 Weight effects by weighting parameters for quarter 1 of the 2012 and 2011 NSWPHS
Category 2012 2011
n SUM(WGT)2 (SUMWGT) (SUMWGT)2 weff Cw weff(n = 3377)
Age Group
0-13 years 368 7297166859 1244521 1548832668784 1.73 0.86 1.58
14-24 years 317 5728404905 1066508 1137439271404 1.60 0.77 1.71
25-34 years 397 4372748462 1057202 1117675032746 1.55 0.74 1.73
35-44 years 346 4278905532 974108 948886376182 1.56 0.75 1.76
45-54 years 489 3262991785 995006 990036601734 1.61 0.78 1.91
55-64 years 624 2097445465 852381 726553045256 1.80 0.90 1.93
65 plus 837 3136171943 1082361 1171505485852 2.24 1.11 1.63
Sex Males 1429 16560322718 3600556 12964003293103 1.83 0.91 2.13
Females 1949 13613512232 3671530 13480134523526 1.97 0.98 2.54
Health admin area
Syd 303 1698048663 585360 342646633987 1.50 0.71 1.80
SWS 314 4303110764 892880 797234926549 1.69 0.83 1.62
SES 213 5079590457 843566 711603697584 1.52 0.72 1.81
IS 173 1303216701 391278 153098535888 1.47 0.69 1.82
WS 286 3618759102 846389 716374051549 1.44 0.67 1.65
NBM 200 1062941408 347524 120772881923 1.76 0.87 1.86
NS 303 3343021760 846173 716008052067 1.41 0.64 1.80
CC 210 1022421509 320135 102486405420 2.09 1.05 2.16
HNE 314 4347558425 885170 783525875790 1.74 0.86 1.74
NNSW 140 1082404196 300456 90273555553 1.68 0.82 1.68
MNC 336 451722818 216328 46797881462 3.24 1.50 1.93
SNSW 240 462055826 205377 42179613548 2.63 1.28 2.31
M 129 885322373 241598 58369453477 1.84 0.91 1.89
WNSW 120 1025192088 268286 71977640717 1.71 0.84 2.29
FW 97 18833284 30750 945569265 1.93 0.97 1.80
Overall 3378 30173834950 7272086 52883238281997 1.93 0.96 2.37
found in the previous year, when only a landline based sample was used.
The need to estimate the number of phone numbers for NSW and by stratum from the Australia figures, used to calculate the differing probabilities of selection, highlighted the desirability to be able to access accurate information at least at the State and Territory level. This is reiterated in the AAOPR report [7] which has the following comment: “A particularly troublesome issue here is that there is a dearth of highly accurate population parameters to use in weighting cell phone samples of regional, state and local areas”.
Although the first estimates of landline phone use from the AHS conducted by the ABS are expected to be available in 2014 [13], there are currently no plans to collect mobile phone use in this national survey and so the landline phone use data will be of limited use as the majority of phone users in Australia are dual-phone users [2,5,8,14,15].
Access to more accurate type of phone use benchmarks would have also allowed weighting by type of phone use. We considered using the type of phone use totals collected by RMSSS [18] to generate benchmark populations by age group, sex, stratum and type of phone use. However, after conducting a sensitivity analysis we concluded that potential errors in the type of phone use estimates provided by age group, sex and stratum, which were well below the design level of the survey, were likely to impact on the NSWPHS health indicator estimates.
The compositing factor λ used for the composite weights was set at 0.5. However the use of 0.5 as the composite factor assumes that all sampled units respond. Skinner (1991) and Skinner and Rao (1996) have explored ways to reduce non-response bias by raking the estimates to type of phone use totals from an independent source [23,24]. However, when Brick (2006) applied these to the Current Population Survey (CPS) he found that none of the suggested estimation schemes substantially reduced the non-response bias of the estimate [25]. It is possible to determine a value of this factor that minimises the sampling variance of the estimator, but this value will be variable specific. The AAOPR Cell Phone Task Force Report [7], acknowledges that variance estimation for dual frame sample designs is somewhat more complex than for single frame designs. This issue is considered by Lohr and Rao (2000) and summarised in Lohr (2009) [26,27].
Moreover, it is likely that for various reasons, the estimates obtained for the overlapping component of the population, obtained from the two sampling frames do not have the same expectation, and usingλ= 0.5 ensures that the two frames are given equal prominence in the estima-tion. Although further research needs to be undertaken to explore other estimation schemes using Australian data.
Conclusions
The inclusion of the mobile phone numbers through an overlapping dual-frame design, improved the coverage of the survey and an appropriate weighing procedure is feasible, although it added substantially to the complexity of the weighting strategy. Access to accurate Australian, State and Territory estimates of the number of landline and mobile phone numbers and type of phone use by at least age group and sex would greatly assist in the weighting of dual-frame surveys in Australia.
Appendix A
Previous landline weighting strategy
Calculation of the raw person weight that accounts for the different selection probabilities.
The probability of selection of a household is proportional to the number of phone landline and is given by Tjh
Thth. Given a household is selected the probability a person is selected is 1
Njh. The probability of selection of the i th person in the j th household is the product of these two probabilities and so the corresponding weight is:
wijh¼π−1ijh¼
Th
th
Njh
Tjh
Adjust the weights to agree with externally derived population benchmarks,Ndh.
With N^dh¼ X
ijh∈sdh
wijh being the survey based estimate
ofNdh. The resulting post-stratified weight forijh∈dis then
Wijh¼N^dh
Ndh
wijh
This allowed the factor Th
th to cancel in the calculation ofWijh, so that ifzjh¼NTjhjh, thenWijh¼ XNah
ijh∈sdh
zjh zjh.
The weights are then summed to produce estimates of totals for any category and will agree with the external age-sex benchmarks. That is X
ijh∈sdh
Wijh¼Ndh; X
ijh∈sh
Wijh¼Nh
andX
ijh∈s
Wijh¼N
where
idenotes an eligible person
hdenotes a stratajdenotes eligible the household
ddenotes an age-sex cell
Ndenotes population size
ndenotes sample size
Tdenotes number of phone lines in the population
tdenotes number of phone lines in the sample
Abbreviations
AAPOR:American Association for Public Opinion Researchers; ABS: Australian Bureau of Statistics; ACMA: Australian Communication and Media Authority; AHS: Australian Health Survey; CATI: Computer Assisted Telephone Interviewing; NHIS: National Health Interview Survey; NSW: New South Wales; NSWPHS: NSW Population Health Survey; RDD: Random Digit Dialing; RMSSS: Roy Morgan Single Source Survey.
Competing interests
The authors declare that they have no competing interests.
Authors’contributions
MLB developed the overall concepts and planned the study; analysis the data, wrote the methods and results, wrote the introduction and discussion and finalised the manuscript. RAF managed the data, checked the analysis programs and commented on drafts of the manuscript. PH provided development and operational advice, checked the underlying logic of the analysis and commented on drafts of the manuscript and DGS provided development and analysis advice, checked the underlying logic of the weighting and commented on drafts of the manuscript. All authors read and approved the final manuscript.
Authors’information
MLB is a PhD student with the National Institute for Applied Statistics Research, University of Wollongong, Wollongong Australia.
Acknowledgments
We acknowledge the interviewing staff and supervisors at the Centre for Epidemiology and Evidence, NSW Ministry of Health for collecting the data and providing their comments. We also acknowledge the respondents for participating in the survey.
Received: 13 January 2014 Accepted: 29 August 2014 Published: 4 September 2014
References
1. NSW Ministry of Health:NSW Population Health Surveys.http://www. health.nsw.gov.au/surveys/Pages/default.aspx.
2. Australian Communications and Media Authority (ACMA:Communications report 2010–11.ACMA; 2011.
3. Kish L:Survey Sampling.New York: John Wiley and Sons; 1965. 4. Blumberg SJ, Luke JV:Wireless substitution: Estimates from the National
Health Interview Survey. January - June 2012.National Centre for Health Statistics; 2012. http://www.cdc.gov/nchs/data/nhis/earlyrelease/ wireless201212.PDF.
5. Barr ML, van Ritten JJ, Steel DG, Thackway SV:Inclusion of mobile phone numbers into an ongoing population health survey in New South Wales, Australia: design, methods, call outcomes, costs and sample
representativeness.BMC Med Res Methodol2012,12:177.
6. Steel D:New South Wales Population Health Survey: Review of the Weighting Procedure. InCommissioned Report to the Centre of Epidemiology and Research.Sydney: NSW Department of Health of Australia; 2004. 7. The American Association for Public Opinion Research (AAPOR):Cell Phone
Task Force Report: New considerations for survey researchers when planning and conducting RDD phone surveys in the US with respondents reached via cell phone numbers.Deerfield, IL: AAPOR; 2010.
8. Pennay D, Vickers N:Dual-frame Omnibus Survey. Technical and methodological summary report. The Social Research Centre.2012, http://www.srcentre.com.au/docs/event-workshop-july-2012/dual-frame-omnibus-technical-report-(pennay).pdf?sfvrsn=2.
9. Hartley HO:Multiple Frame Surveys. Proceedings of the Social Statistics Section.
USA: American Statistical Association; 1962:203–6.
10. Hartley HO:Multiple Frame Methodology and Selected Application.
Sankhyā1974,36:99–118. Ser. C, Part 3.
11. Brick JM, Cervantes IF, Lee S, Norman G:Non-sampling errors in dual frame phone surveys.Survey Methodology2011,37(1):1–12. 12. Lohr SL:Dual frame surveys: Recent developments and challenges
Proceedings of the 45thMeeting of the Italian Statistical Society 2010. (Sharon Lohr, Dual Frame Surveys: Recent Developments and Challenges, David Haziza, Resampling methods for variance estimation
in the presence of missing survey data, Emilia Rocco, Using auxiliary information and non parametric methods in weighting adjustments).
13. Wolter KM, Smith P, Blumberg SJ:Statistical foundations of cell-phone surveys.Survey Methodology2010,36(2):203–215.
14. Pennay D:Profiling the‘mobile phone only’population: Results from a dual- frame telephone survey using a landline and mobile phone sample frame, ASCPRI Social Science Methodology conference proceedings.
ASCPRI2010,2010:2010.
15. Livingston M, Dietze P, Ferris J, Pennay D, Hayes L, Lenton S:Surveying alcohol and other drug use through telephone sampling: a comparison of landline and mobile phone samples.BMC Med Res Methodol2013,13:41. 16. National Health Interview Survey.http://www.cdc.gov/nchs/nhis.htm. 17. Australian Bureau of Statistics:Australian Health Survey 2011–2013 (AHS).
http://www.abs.gov.au/australianhealthsurvey.
18. Roy Morgan Single Source Survey.http://www.roymorgan.com/products/ single-source/.
19. Australian Bureau of Statistics:Census quickstats.New South Wales: ABS; 2011. http://www.censusdata.abs.gov.au/census_services/getproduct/ census/2011/quickstat/1.
20. Potter FJ:A study of procedures to identify and trim extreme sampling weights.InProceedings of the section on survey research methods 1990.
Alexandria, VA: American Statistical Association; 1990:225–230. 21. Kish L:Weighting for unequal Pi.J Off Stat1992,8:183–200. 22. Kish L:Methods for design effects.J Off Stat1995,11:55–77.
23. Skinner CJ:On the efficiency of raking ratio estimation for multiple frame surveys.J Am Stat Assoc1991,86:779–84.
24. Skinner CJ, Rao NK:Estimation in dual frame surveys with complex designs.J Am Stat Assoc1996,91:349–56.
25. Brick JM, Dipko S, Presser S, Tucker C, Yuan Y:Nonresponse Bias in a Dual Frame Sample of Cell and Landline Numbers.Public Opin Q2006,
70(5):780–793.
26. Lohr S, Rao JNK:Estimation in multiple-frame surveys.J Am Stat Assoc
2000,101:1019–1030.
27. Lohr S:Multiple-frame Surveys. InHandbook of Statistics, Sample Surveys: Design Methods and Applications, vol 29A.Edited by Pfeffermann D, Rao CR. The Netherlands: Elsevier; 2009:71–88.
doi:10.1186/1471-2288-14-102
Cite this article as:Barret al.:Developing a weighting strategy to include
mobile phone numbers into an ongoing population health survey using an overlapping dual-frame design with limited benchmark information.BMC Medical Research Methodology201414:102.
Submit your next manuscript to BioMed Central and take full advantage of:
• Convenient online submission
• Thorough peer review
• No space constraints or color figure charges
• Immediate publication on acceptance
• Inclusion in PubMed, CAS, Scopus and Google Scholar
• Research which is freely available for redistribution