http://www.sciencepublishinggroup.com/j/wjap
doi: 10.11648/j.wjap.20170201.14
Mathematical Model for Equivalent Fresnel Zone Line of
Sight Percentage Clearance for Terrestrial Point-to-Point
Line-of-Sight Communication Link
Ikechukwu H. Ezeh
1, Nwiido Friday
2, Amlabu Runcie
21
Department of Electrical Engineering, Imo State University (IMSU), Owerri, Nigeria
2
Department of Electrical/Electronic and Computer Engineering, University of Uyo, Uyo, Nigeria
Email address:
[email protected] (I. H. Ezeh)
To cite this article:
Ikechukwu H. Ezeh, Nwiido Friday, Amlabu Runcie. Mathematical Model for Equivalent Fresnel Zone Line of Sight Percentage Clearance for Terrestrial Point-to-Point Line-of-Sight Communication Link. World Journal of Applied Physics. Vol. 2, No. 1, 2017, pp. 27-31.
doi: 10.11648/j.wjap.20170201.14
Received: October 31, 2016; Accepted: January 12, 2017; Published: April 5, 2017
Abstract:
In this paper mathematical model for equivalent Fresnel zone line of sight percentage clearance for terrestrial point-to-point line-of-sight communication link is presented. Sample 3 GHz microwave link with 38887.6 m path length is used to demonstrate the application of the model. In the sample link, five Fresnel zones are considered, namely zone 1, 2 4, 8, and 16. The results show that at middle of the link, the corresponding radius of each of the five Fresnel zones are r1 = 31.18 m, r2=44.1m, r4=62.36m, r8=88.19 m, r16 =124.72 m. When the LOS percentage clearance specified with respect to Fresnel zone 1 is-100% the corresponding LOS percentage clearance with respect to the other Fresnel zones are as follows: Fresnel zone 2 is -70.71%, Fresnel zone 4 is -50%, Fresnel zone 8 is -35.36% and Fresnel zone 16 is -25%. The results confirm that the equivalent line ofsight percentage clearance is given as Pc(x, n2) = Pc(x, n1) where n1 and n2 are two different Fresnel zones and
Pc(x, n1) and Pc(x, n2) are the line of sight percentage clearance at Fresnel zone n1 and n2 respectively.
Keywords:
Line-of-Sight Communication, Fresnel Zone, Microwave Link, Percentage Clearance, Point-to-Point Link1. Introduction
Ensuring clear Line Of Sight (LOS) is essential for effective communication in microwave links [1-3]. This is because, microwave signals are known to travel in a straight line. In reality, microwave signals path form an ellipsoidal shape that is described by Fresnel geometry [4-7]. In the Fresnel geometry for LOS links, the signal path are categorised into different Fresnel zones. In that case, microwave communication link designers usually specify the LOS clearance with respect to the Fresnel zones. However, the most important is the first Fresnel zone, where it is believed that over 90% of the signal strength are concentrated [8-10]. While most designers specify their LOS clearance in terms of Fresnel zone 1, others that require high fidelity link specify the LOS clearance in terms of the higher Fresnel zones.
In this paper mathematical model is derived which can be used to convert the LOS percentage from one Fresnel zone to
another. In that case, for a given LOS clearance height, the model can be used to determine the equivalent LOS percentage clearances in any given Fresnel zone n. The model in this paper is derived considering the given LOS clearance height, the corresponding diffraction parameter and the radius of the Fresnel zone stated in the specification.
2. Theoretical Background
For LOS links, the radius of the nth Fresnel zone (r( )) is given as [11-13];
( )= ʎ ( )( ) ( )( ) (1)
!(") is the distance of location x from the transmitter #(") is the distance of location x from the receiver, where x = 1, 2, 3,…, N.
n is the nth Fresnel zone
λ is the wavelength of the radio wave in metres where;
ʎ =&% (2)
where, c is the speed of a radio wave (c = 3x10)*/,); f is frequency of the radio wave in Hz.
The Fresnel-Kirchoff diffraction parameter (-(")) at any given location x between the transmitter and the receiver is given as [14-19];
-(") = ℎ(")/ ʎ ( )( ) ( )( ) 0 (3)
Where
ℎ(") is effective obstruction clearance height which is the
height (in meters) from the tip of the obstruction at location x to a point on the line of sight at location x, where x is between the transmitter and the receiver.
λ is the wavelength of the radio wave in metres
2.1. Diffraction Parameter (1(2)) for any Percentage Clearance Of Fresnel Zone
Let 3%(", ) be the percentage clearance required for Fresnel zone n. in practice, at least 60% of (4) (that is, 0.6 of
(4)) clearance is required for the first Fresnel zone. 3%(", ) clearance for ( ) means;
h(6,78)= 9:(;,<)== r(>) = ?9:(;,<)== @ / > ʎ AA B(;) AC(;)
B(;) AC(;) 0 (4)
Hence, for 3%(", )= 60%, ℎ(",F=)= 0.6 ( ) . In terms of
3%(", ), the Fresnel-Kirchoff diffraction parameter at any given
location x between the transmitter and the receiver can be represented as (-(",HI)) and it is given as;
-(",J%) = ℎ(",J%)/ ʎ ( )( ) ( )( )0 (5)
-(",J%) = ?IK( ,L)== @ M ʎ ( )( ) ( )( ) N M ʎ ( )( ) ( )( )N (6)
-(",J%) = ?IK( ,L)== @ √n √2 M ʎ ( )( ) ( )( ) ʎ ( )( ) ( )( )N (7)
-(",J%) = P√ I==K( ,L) Q (8)
3%(", )= R( ,ST)√ > == (9)
For Fresnel zone 1, n=1, then
-(",J%) = P√ I==K( ,L)Q (10)
2.2. Equivalent Fresnel Zone LOS Percentage Clearance Specifications
When the LOS percentage clearance is specified, it is given with respect to a specific Fresnel zone, n. If the first LOS percentage clearance given in respect of Fresnel zone n1, then;
-(",J%( )) = PU ( ) I==K( ,LV)Q (11)
If the LOS percentage clearance given in respect of another Fresnel zone n1, then;
-(",J%( )) = PU ( ) I==K( ,LW)Q (12)
When -(",J%( ))= -(",J%( ))then;
PU ( ) IK( ,LV)
== Q = P
U ( ) IK( ,LW)
== Q (13)
U2(X1) 3%(", ) = U2(X2) 3%(", ) (14)
3%(", ) = YU2(X1) 3%(", )
U2(n2) Z
3%(", ) = 3%(", ) ?>>@ (15)
For instance, 60% LOS clearance with respect to Fresnel zone 1 (that is, n = 1) is denoted as 3%(", ). If the percentage clearance is needed with respect to Fresnel zone 4, that is
3%(",[), then n1=1, n2 = 4, Cp(6, ) = 60%, then Cp(6,[) is given in terms of Cp(6, ) , n1 and n2 as follows;
3%(",[) = 3%(", ) ?[@ = ?F=%@ = 30% (16)
Conversely,
3%(", ) = 3%(",[) ?[@ = (30%)√4 = 60% (17)
So, 60% LOS clearance with respect to Fresnel zone 1 is equivalent to specifying 30% LOS clearance with respect to Fresnel zone 4.
3. Results and Discussions
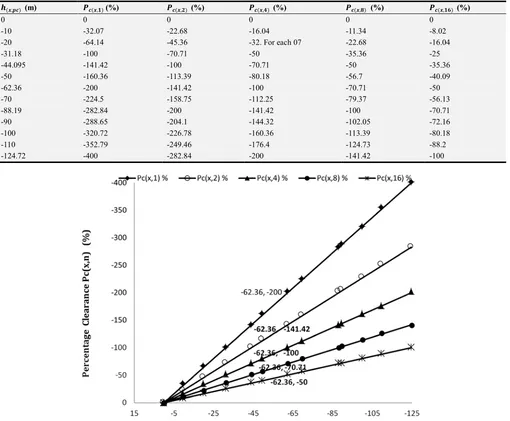
Table 1 and figure 1 show the LOS clearance height, ℎ(",J% (m) versus percentage clearance 3% ", (%) for the five different Fresnel zones. For each LOS clearance height, the table and graph show the equivalent percentage clearance that will give the same clearance height in each of the five Fresnel zones. For instance, in Table 1 and Figure 1, LOS clearance height of -62.36 m below the line of sight, is equivalent to
-200% clearance with respect to the first Fresnel zone at the middle of the link. At the same time, the same -62.36 m below the line of sight, can be specified as -141.42% clearance with respect to the second Fresnel zone, -100% clearance with respect to the fourth Fresnel zone, -70.71% clearance with respect to the eight Fresnel zone and -50% clearance with respect to the sixteenth Fresnel zone.
Table 1. LOS Clearance Height, .",J% (m) Versus Percentage Clearance 3% ", (%) For Five Different Fresnel Zone, where the radius of the Fresnel zones are; r1 = 31.18 m, r2=44.1m, r4=62.36m, r8=88.19 m, r16 =124.72 m.
_2,`a (m) ba 2,4 (%) ba 2,c (%) ba 2,d (%) ba 2,e (%) ba 2,4f (%)
0 0 0 0 0 0
-10 -32.07 -22.68 -16.04 -11.34 -8.02
-20 -64.14 -45.36 -32. For each 07 -22.68 -16.04
-31.18 -100 -70.71 -50 -35.36 -25
-44.095 -141.42 -100 -70.71 -50 -35.36
-50 -160.36 -113.39 -80.18 -56.7 -40.09
-62.36 -200 -141.42 -100 -70.71 -50
-70 -224.5 -158.75 -112.25 -79.37 -56.13
-88.19 -282.84 -200 -141.42 -100 -70.71
-90 -288.65 -204.1 -144.32 -102.05 -72.16
-100 -320.72 -226.78 -160.36 -113.39 -80.18
-110 -352.79 -249.46 -176.4 -124.73 -88.2
-124.72 -400 -282.84 -200 -141.42 -100
Figure 1. The plot of Clearance Height versus Percentage Clearance for Five Different Fresnel Zone.
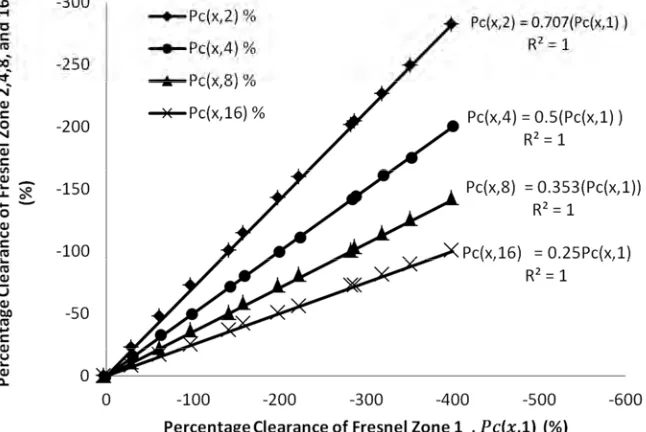
In figure 2, the graph of the percentage clearance of Fresnel zone 1, 3g(h,1) (%) versus the percentage clearance of Fresnel zone 2, 4, 8, and 16 are plotted and trendline equations are fitted to relate each of the percentage clearance of Fresnel zone 2,4,8, and 16 to the percentage clearance of Fresnel zone 1, 3g(h,1) (%). The trendline equations are as follows;
For percentage clearance of Fresnel zone 2 versus percentage clearance of Fresnel zone 1
Pc(x,2) = Pc x, 1 ? .[ [@= Pc x, 1 (18)
For percentage clearance of Fresnel zone 4 versus percentage clearance of Fresnel zone 1
Pc(x,4) = 0.5(Pc(x,1)) = Pc x, 1 ? @ Pc x, 1 [ (19)
For percentage clearance of Fresnel zone 8 versus percentage clearance of Fresnel zone 1
Pc(x,8) = 0.353(Pc(x,1)) = Pc x, 1 ?
For percentage clearance of Fresnel zone 16 versus
percentage clearance of Fresnel zone 1 Pc(x,16) = 0.25(Pc(x,1)) = Pc x, 1 ?[@ Pc x, 1 F (21)
Figure 2. The Graph Plot Of Percentage Clearance of Fresnel Zone 1, 3g(h,1) (%) versus the Percentage Clearance of Fresnel Zone 2, 4, 8, and 16.
The trendline equations show that the general relationship between any two equivalent percentage clearances of Fresnel zones n1 and n2 is;
Pc(x,n2) = Pc x, n1 (22)
This results validate the earlier formula derived in this paper for determine the equivalent percentage clearance that will give the same LOS clearance height and hence, the same diffraction parameter value.
4. Conclusion
Mathematical model for computing the equivalent Fresnel zone line of sight percentage clearance for terrestrial point-to-point line-of-sight communication link is presented. Sample microwave link is used to demonstrate the application of the model. The results confirm that the equivalent line of sight percentage clearance is given as Pc(x,n2) =
Pc x, n1 where n1 and n2 are two different Fresnel zones and Pc x, n1 and Pc x, n2) are the line of sight percentage clearance at Fresnel zone n1 and n2 respectively.
References
[1] Al Mahmud, M. R. (2009). Analysis and planning microwave link to established efficient wireless communications (Doctoral dissertation, Blekinge Institute of Technology).
[2] McKown, J. W., & Hamilton, R. L. (1991). Ray tracing as a design tool for radio networks. IEEE Network, 5 (6), 27-30. [3] Adler, R. B., Chu, L. J., & Fano, R. M. (1960). Electromagnetic
energy transmission and radiation.
[4] Feuerstein, M. J., Blackard, K. L., Rappaport, T. S., Seidel, S. Y., & Xia, H. H. (1994). Path loss, delay spread, and outage models as functions of antenna height for microcellular system design. IEEE Transactions on Vehicular Technology, 43 (3), 487-498.
[5] Angulo, I., De La Vega, D., Cascón, I., Cañizo, J., Wu, Y., Guerra, D., & Angueira, P. (2014). Impact analysis of wind farms on telecommunication services. Renewable and Sustainable Energy Reviews, 32, 84-99.
[6] Wibling, O. (1998). Terrain Analysis with Radio Link Calculations for a Map Presentation Program. Terrain, 98, 12-08.
[7] Adediji, A. T., Mandeep, J. S., & Ismail, M. (2014). MeteorologGical Characterization of Effective Earth Radius Factor (k-Factor) for Wireless Radio Link Over Akure, Nigeria. Mapan, 29 (2), 131-141.
[8] Serdega, V., & Ivanovs, G. (2015). Refraction seasonal variation and that influence on to GHz range microwaves availability. Elektronika ir Elektrotechnika, 78 (6), 39-42. [9] Mufti, N., Ullah, H., Rehman, S., & Din, I. (2015, January).
Analysis of tropospheric radio refractive conditions in Karachi, Pakistan. In 2015 12th International Bhurban Conference on Applied Sciences and Technology (IBCAST) (pp. 617-619). IEEE.
[10] Nyete, A. M., & Afullo, T. J. O. (2013). Seasonal distribution modeling and mapping of the effective earth radius factor for microwave link design in South Africa. Progress In Electromagnetics Research B, 51, 1-32.
[12] Dalbakk, L. E. (2014). Antenna System for Tracking of Unmanned Aerial Vehicle.
[13] Mazar, H. (1991, March). LOS radio links, clearance above tall buildings. InElectrical and Electronics Engineers in Israel, 1991. Proceedings., 17th Convention of (pp. 145-148). IEEE. [14] Dalbakk, L. E. (2014). Antenna System for Tracking of
Unmanned Aerial Vehicle.
[15] Arzubi, A. A., Castro Lechtaler, A., Foti, A., Fusario, R., García Garino, C., & García Guibout, J. (2010). Design of a Trans-Horizon radio link for ultra high and super high frequencies. In XVI Congreso Argentino de Ciencias de la Computación.
[16] Haykin, S. S., Moher, M., & Koilpillai, D. (2011). Modern wireless communications. Pearson Education India.
[17] Kraus, H. G. (1989). Huygens–Fresnel–Kirchhoff wave-front diffraction formulation: spherical waves. JOSA A, 6 (8), 1196-1205.
[18] Beyer, J. (2004). An approximate approach to predict multiple screen diffraction in the case of grazing incidence. Radio science, 39 (4)