www.mojet.net
The Effects of Computer Algebra
System on Undergraduate Students’
Spatial Visualization Skills in a Calculus
Course
Fatih KARAKUŞ [1], Bünyamin AYDIN [2]
[1] Afyon Kocatepe Üniversitesi, Eğitim Fakültesi, İlköğretim Bölümü, Afyonkarahisar, Türkiye
[2] Necmettin Erbakan Üniversitesi, Ahmet Keleşoğlu Eğitim Fakültesi, OFMAE Bölümü, Konya, Türkiye
ABSTRACT
This study aimed at determining the effects of using a computer algebra system (CAS) on undergraduate students’ spatial visualization skills in a calculus course. This study used an experimental design. The “one group pretest-posttest design” was the research model. The participants were 41 sophomore students (26 female and 15 male) studying at an undergraduate program in the department of mathematics in the west Anatolia region of Turkey. In order to determine students’ spatial ability, The Purdue Spatial Visualization Test: Visualization of Rotation (PSVT-R) was used as the pre-test and post-test. This test consists of 30 multiple choice items and it assesses the skills of mental rotation of objects. The results of the study showed that using CAS in a calculus course had a positive effect on developing students’ spatial visualization abilities. The results also showed that spatial visualization skills can be a predictor for success in a calculus course. The results have some important implications for education. First is that spatial visualization skills can be improved through training with relevant content. Second is that proper instruction by using some computer software such as MAPLE is effective for improving spatial visualization skills
Keywords: Spatial ability, undergraduate students’ spatial abilities, calculus course
INTRODUCTION
Spatial ability is assumed as one of the most important components of mental ability (Linn & Petersen, 1985). It refers to an individual’s mental ability to visualize, transform and manipulate nonverbal information such as figures, 2-D and 3-D objects based on visual stimuli (e.g., Linn & Petersen, 1985; McGee, 1979, Olkun, 2003). Various researchers (e.g. Carroll, 1993; Linn & Petersen, 1985; McGee, 1979) have identified distinct components of spatial ability. Although there is no definite consensus regarding the number of distinct spatial abilities, there are several categories. One of the most widely used categories belongs to McGee (1979) who classified spatial ability into two sub-categories of spatial orientation and spatial visualization.
McGee (1979, p. 6) stated spatial orientation as “the comprehension of the arrangement of elements within a visual stimulus pattern and the aptitude to remain unconfused by the changing orientation in which spatial configuration may be presented” and defined spatial visualization as “the ability to mentally rotate, twist or invert pictorially presented visual stimuli”. Therefore, spatial orientation refers to the ability to retain spatial orientation with respect to one’s location while spatial visualization refers to the ability to imagine rotations and manipulations of objects (Kaufman, 2007). However, Linn and Petersen (1985) referred to a different classification to examine gender differences in spatial ability in a
www.mojet.net analysis. They distinguished three categories of spatial ability as spatial perception, mental rotation and spatial visualization. Maier (1998) referred to five categories of spatial ability as mental rotation, spatial perception, spatial orientation, spatial relations and spatial visualization. McGee (1979) regarded mental rotation as a sub-component of spatial visualization while Linn and Petersen (1985) and Maier (1998) considered it to be a separate component of spatial ability. Olkun (2003) also stated that spatial ability has two basic components in the form of spatial relations and spatial visualizations. Spatial relations involve the skills to understand 2-D and 3-D rotations of the shapes. Mental rotation is sometimes referred as spatial relations (Hegarty & Waller, 2004). Mental rotation involves a cognitive process to mentally rotate two or three dimensional objects rapidly and accurately (Linn & Petersen, 1985). This ability is a less complex ability than spatial visualization (Kaufmann, Steinbügl, Dünser & Glück, 2005, Olkun, 2003). Mental rotation and spatial visualization are the two most commonly agreed upon categories in the literature.
Spatial ability is closely related to teaching many subjects in mathematics and geometry (Hoffer, 1981; Karakuş & Peker, 2015; Kösa, 2016a, 2016b; Kurtuluş, 2013). In these studies, a positive relationship between success in mathematics and spatial ability is often emphasized (e.g.Gunderson, Ramirez, Beilock & Levine, 2012; Kayhan, 2005; Kösa, 2016a; Turgut & Yılmaz, 2012). Moreover, spatial abilities are also related to mathematical problem solving (e.g., Grattoni, 2007; Kösa, 2016a, 2016b; Markey, 2009; McLeay, 2006; Olkun, 2003). From this perspective, the NCTM (2000) emphasized the importance of spatial abilities in mathematics education and noted that spatial ability was important and included 2D and 3D objects’ mental representation and manipulation with the perception of different perspectives of the objects.
Although some studies ask whether spatial abilities can be improved with teaching (e.g. Hoong & Khoh, 2003) most studies showed significant change in students’ spatial abilities using different instruction methods and materials (Akasah & Alias, 2010; Arıcı & Aslan-Tutak, 2015; Baki, Kösa & Güven, 2011; Çakmak, 2009; Güven & Kösa, 2008; Huang, 2013; Kurtuluş, 2013; Miller & Halpern, 2013; Sevimli & Delice, 2010; Sorby, Casey, Veurink & Dulaney, 2013; Yıldız 2009; Yolcu & Kurtuluş, 2010). However, some studies (e.g., Boakes, 2009; Ferrini-Mundy, 1987) found no significant effect of instruction on spatial ability. Researches examining spatial ability changes often focus on geometry and engineering, whereas only a few studies (e.g. Delice & Ergene, 2015; Ferrini-Mundy, 1987; Huang, 2013; Sevimli & Delice, 2010; Travis & Lennon, 1997) investigated the changes in students’ spatial ability in calculus courses. Ferrini-Mundy (1987) investigated the effects of spatial training on calculus achievement, spatial visualization ability and the use of visualization in solving problems about solids. He found that there were no treatment effects on calculus achievement or spatial visualization ability. In contrast, Travis and Lennon (1997) designed an environment including 3-D representation using Maple software in a Calculus II course and found that this environment enhanced students’ spatial skills and academic success. Similarly, Sevimli and Delice (2010) investigated students’ preferences for representation as they tried to evaluate definite integral given in different representations and found that they had low spatial visualization ability. Additionally, they determined that the pre-service teachers who had low spatial visualization ability used algebraic representations. Sevimli and Delice (2010) and Huang (2013) investigated both students’ problems related to visualization and determined what type of visual images they use while solving problems in definite integral. The results showed that students who had high visualization ability used geometric representations along with algebraic representation in solving define integral problems. However, students who had low visualization ability used memory images more. Furthermore, students who had high visualization ability were more successful than others when solving define integral problems. Delice and Ergene (2015) focused on examination of drawing of university students during the solving process of integral volume problems. They found a relationship between spatial visualization skills and problem solving.
Most of the concepts and many problems of calculus can be represented differently such as through graphic or diagramsor figures. Although many different representations are used in teaching concepts in calculus, few of the examples or problems are designed to develop the students’ ability to represent or solve problems graphically. The teaching of calculus focused on more algebraic representations, and the importance of visualization was neglected. In this case, students have difficulties when solving graphical and non-routine problems and building conceptual learning (Silverberg, 1999). Zimmermann (1991) discussed the role of visualization in calculus: “the role of visual thinking is so fundamental to the
www.mojet.net understanding of calculus that it is difficult to imagine a successful calculus course which does not emphasize the visual elements of the subject” (p. 136). Moreover, it is almost impossible to understand a majority of problems (especially, find the areas of regions that lie under the graphs of functions and the volume of a solid or calculate triple integrals) in calculus without adequate visual representation. To understand calculus a student should be able to represent and interpret the graphical representation of data (Zimmermann, 1991).
The growth of computer technology presents a new and important element in any discussion of visualization in mathematics. In particular, integrating computers into the calculus courses helps to design an environment where graphical, numerical and analytic representation can be combined (Salleh & Zakaria, 2013). For that purpose, the computer algebra systems (CAS) such as Derive, Mathematica or Maple can be used as a tool for developing calculus success. CAS is a software program enabling students to solve equations and to perform different algebraic operations such as calculating limit, derivative and integral (Thompson, Byerley & Hatfield, 2013). CAS assisted learning environments have a significant effect on the students’ mathematics success especially on calculus concepts (Kabaca, Aksoy, Aktümen, & Mirasyedioğlu, 2009). Moreover, CAS is a visualization tool that helps students form different representations and find the relationships among them (Mallet, 2007; Pierce & Stacey, 2004). In studies dealing with the effects of using CAS in teaching calculus subjects, the focus is mostly on how to use CAS in the classes (e.g., Mathews, 1990; Wiwatanapataphee, Noinang, Wu & Nuntadilak, 2010), the development of students’ operational and conceptual knowledge (e.g. Aksoy & Bulut, 2004; Godarzi, Aminifar & Bakhshalizadeh, 2009; Meagher, 2005) and change in students’ attitude and interest towards mathematics (Noinang, Wiwatanapataphee & Wu, 2008). A few studies (e.g. Travis & Lennon, 1997) examined the effects of using CAS on the students’ spatial ability.
The purpose of the study
Researches examining the changes in spatial ability often focus on geometry and engineering; only a few researches have examined the changes in students’ spatial ability in calculus courses. Moreover, some researches have implemented training programs using computer software such as Cabri 3D or GeoGebra to improve spatial visualization skills and found that such programs were successful in developing spatial visualization skills (Baki et al., 2011; Karakuş & Peker, 2015; Kösa, 2016a, 2016b). A few studies have examined the relationship between spatial ability and mathematics achievement. Although many studies on spatial visualization and geometry exist, calculus course and spatial visualization skills together was less studied. Moreover, there is no evidence of any research intended for showing whether spatial visualization skills can predict success in calculus.
The purpose of the present study was to determine the influence of using a CAS on undergraduate students’ spatial visualization ability in a calculus course. One group of participants received instruction using MAPLE computer software in the calculus course. The following research questions were addressed:
• Does using a CAS help undergraduate students to improve their spatial visualization skills?
• Can spatial visualization skills be a predictor of undergraduate students’ grades in a computer aided calculus course?
METHOD
A “one group pretest- posttest” design was used in this study. In this design, a single group is measured or observed not only after being exposed to a treatment of some sort, but also before (Fraenkel, Wallen & Hyun, 2011). This design should be used when the number of participants may be limited and it may not be possible to involve more than one group (Creswell, 2012). It is suitable for examining change in an entire system where it would be difficult to find a control group. Although many uncontrolled threats may affect the internal validity of a one group pretest-posttest design, some certain conditions such as reliable instrument and short pretest-posttest time intervals may minimize these threats (McMillan &
www.mojet.net Schumacher, 2014). Moreover, this study was also a correlational research. It also assessed the relationships between academic success and spatial visualization skills. Correlational designs provide an opportunity to predict scores and explain the relationship among variables (Creswell, 2012).
The research was not to investigate the advantages or disadvantages of the CAS-based environment rather than traditional environment. Instead, we investigated the influences of doing CAS-based activities on undergraduate students’ spatial visualization skills in a calculus course, enabling them to evaluate the effectiveness of a CAS in a calculus course.
Participants
The participants were 41 sophomore students (26 females and 15 males) studying at an undergraduate program in the department of mathematics at a university in the west Anatolia region of Turkey. These students took the calculus IV course during the 2013-2014 spring academic semester. The pre-test and the post-test (as the same test) were administered to all of the students.
Instrument
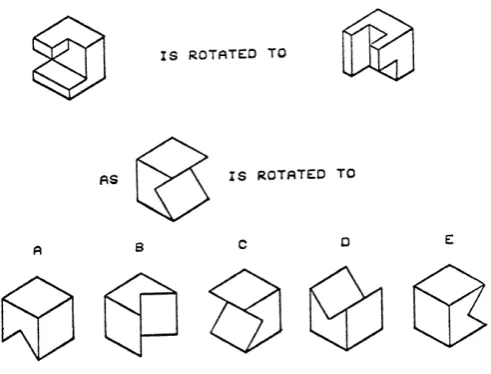
The Purdue Spatial Visualization Test (PSVT) was developed by Guay (1977) with three subtests as follows: developments, rotations, and views which contain a total of 36 items. Each subtest of PSVT also has an independent extended version of 30 items entitled Purdue Spatial Visualization Test: Visualization of Developments (PSVT-D); Visualization of Rotation (PSVT-R) and Visualization of Views (PSVT-V). Among these three extended versions of the PSVT, the PSVT-R is a 20- minute test used for students to measure spatial visualization ability in 3-D mental rotation (Guay, 1980). In each item of PSVT-R, there is an object in two different positions. The object on the left shows the starting position, and the same object on the right has been rotated on the X, Y, and Z axes. Students are first asked to find the pattern of rotation, and then to select the representation of the object whose position represents the next rotation in the pattern. A sample item from PSVT-R is given in Figure 1
Figure 1. A sample item from the PSVT-R.
The PSVT-R has been used mainly in research in different educational settings, such as science, technology, engineering and mathematics. The PSVT-R has been shown to be a valid and reliable instrument. Guay and McDaniel (1978) used PSVT-R test with 101 undergraduate students and reported
www.mojet.net that Kuder-Richardson reliability coefficient as .86. Battista, Wheatley, and Talsma (1982) used the test on 82 pre-service elementary teachers enrolled in a geometry course and found the Kuder-Richardson reliability coefficient was .80. Similarly, Sorby and Baartmans (1996) used the PSVT-R on 492 freshmen engineering students and found that the Kuder-Richardson reliability coefficient was .82.
Procedure
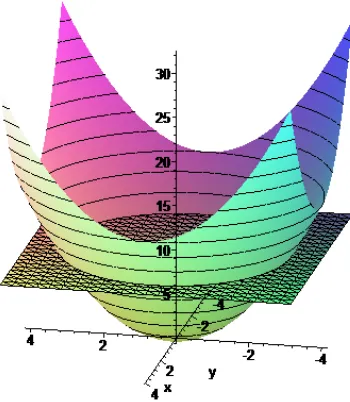
The calculus IV course is one of the basic lessons in the department of mathematics, and students take this course for six hours a week. The content of the calculus IV course includes double integrals and application of double integrals, triple integrals, triple integrals in cylindrical and spherical coordinates, change of variables in multiple integrals, vector fields, and line integrals. In this research, only the computer-based activities using MAPLE were prepared about the topics that were triple integrals, triple integrals in cylindrical and spherical coordinates, and change of variables in triple integrals. At the beginning of the study, the undergraduate mathematics students were administered the PSVT-R test as a pre-test. Before the treatment, the students were trained on how to use the MAPPLE software. They learned the basic commands and functions of the menu, such as how to draw the cone, parabola, sphere, plane or intersection of planes. An example of the activities is shown in Figure 2. In this activity, students drew the paraboloid 𝑧=𝑥2+𝑦2 and plane z=10.
Figure 2. Screenshot of the paraboloid and plane.
The content of the course is presented in Table 1.
Table 1. The Content of the course based on computer aided activities
Week Course content
1st week Learning about MAPLE. Forming basic objects (cone, parabola, sphere, plane, intersection of planes, etc.) 2nd week Definition of triple integrals and drawing solid region
3rd week Triple integrals, triple integrals in cylindrical and spherical coordinates 4th week Change of variables in triple integrals
5th week Free exercises
During the treatment, the students received instruction in the computer laboratory. They individually studied triple integrals using MAPLE, along with course worksheets. Since it was difficult to draw figures in triple integrals and define their projections on a plane, the focus of the worksheets were mostly on drawing
www.mojet.net figures and determining their projections on a plane. One of the worksheets that students took can be seen in the Appendix. They received guidance from the instructor, who was an expert at using MAPLE in teaching calculus concepts. At the end of the five weeks, the students were administered the same test as the e-post-test.
Data analysis
Before the data analysis, it was examined whether the data are normally distributed. The normality of data before and after intervention is shown in Table 2.
Table 2. Pre and Post Tests of Normality
Test scores KolmogorovStatistic -Smirnovdf Sig. ShapiroStatistic -Wilk df Sig.
Pre-test .094 41 .200 .988 41 .940
Post-test .123 41 .119 .962 41 .189
Table 2 showed that the data were in accordance with normal distribution.
On the PSVT-R, one point was given for every correct answer, and no points were given for every incorrect or blank answer. We used the paired sample t-test statistical procedure with ∝ = .05 on the undergraduate students’ PSVT-R scores to determine the mean differences between their pre-test and post-test scores.
To form a general impression of students’ spatial visualization ability, descriptive statistics were used before and after the treatment. Additionally, the students may take the lowest score “0” and highest score “30” from the PSVT-R test. The score range was divided into three equal intervals: low, average, and high. Table 3 shows these intervals and score ranges.
Table 3. The levels for PSVT-R scores
Levels Score
Low (1) 0 – 9
Moderate (2) 10 – 19
High (3) 20 – 30
With the help of Table 3, it was aimed to define the changes in levels of students pre-test and post-test scores. Thus, we had a general view about the effectiveness of the implementations. In order to determine relationship between the students’ spatial visualization skills and success in the computer aided calculus course, the Pearson correlation coefficient was calculated. Different authors suggest different interpretations for understanding the value of the correlation coefficient; however Cohen (1988) suggests the following guidelines: if r = .10 to .29 then the relationship is small; if r = .30 to .49, the relationship is medium and if r = .50 to 1.0 the relationship is large (pp. 79-81). In this study, Cohen’s guidelines were used to interpret the relationship.
RESULTS
In this section, the undergraduate students’ PSVT-R results are presented to illustrate the changes in their spatial visualization skills before and after the intervention. Table 4 presents the values of the mean and standard deviation of the scores of groups that were obtained from the PSVT-R.
Table 4. Mean and standard deviation of the students’ PSVT-R scores before and after the
intervention
Before intervention After intervention
N Mean Std. Deviation Mean Std. Deviation
www.mojet.net
41 13.78 5.38 16.51 5.36
Table 4 demonstrates that the undergraduate students’ mean post-test scores were higher than their pre-test scores. In order to determine whether the differences in the averages of pre- and post-test scores were statistically significant, a paired sample t-test was applied to the data obtained from the entire test at a significance level of .05. Table 5 summarizes the results of the paired sample t-test analysis for the pre- and post-test.
Table 5. Paired sample t-test results of pre- and post- test scores within groups
N df t p
41 40 -3.600 .001
According to the results shown in Table 5, there was a significant differences between pre-test and post-test scores of undergraduate students. Based on the statistical results, it can be said that the computer-based activities in the calculus course had a positive effect on the students’ acquisition of spatial abilities.
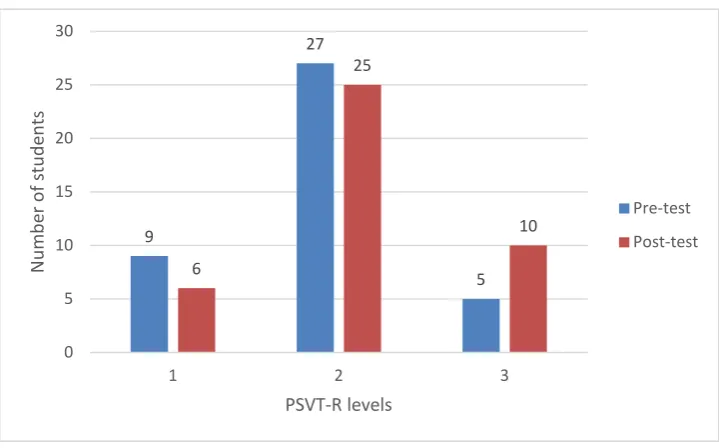
To take a general picture of the changes of students’ spatial visualization ability according to the pre-test and post-pre-test scores, the levels of students’ PSVT-R scores was used. Figure 3 summarizes the changes of students’ PSVT-R levels in terms of pre-test and past-test scores.
Figure 3. Changes of students PSVT-R levels in terms of pre- and past-test scores.
According to the changes of students’ PSVT-R levels shown in Figure 3, the number of students in the first and second levels decreased, but the number of students in the third level increased.
The second problem of this study concerned whether spatial visualization skills could be a predictor of students’ grades in a computer-aided calculus course. The relationship between students’ spatial visualization skills and their performance in the computer-aided calculus course is demonstrated in Table 6.
Table 6. The relationship between the students’ spatial visualization skills and performance in a computer-aided calculus course.
Spatial visualization skills
Computer-aided calculus course
performance
Spatial visualization skills r p 1 - .334.033 *
9
27
5 6
25
10
0 5 10 15 20 25 30
1 2 3
Num
be
r o
f s
tude
nt
s
PSVT-R levels
Pre-test Post-test
www.mojet.net
N 41 41
Computer-aided calculus course performance
r .334* 1
p .033
N 41 41
According to Table 6, the correlation coefficient between spatial visualization skills and performance in the calculus course was r = .334, with a significant level of .05. This case shows that there was a positive relationship between students’ spatial visualization skills and their performance in the calculus course. According to the guidelines proposed by Cohen (1988) for interpreting correlation coefficient, given correlation coefficient value denotes medium effect. In this case, it can be concluded that there was a medium relation between spatial visualization skills and calculus course success.
DISCUSSION AND CONCLUSIONS
This study investigated whether a CAS-based calculus course had an effect on developing undergraduate students’ spatial visualization skills. The paired sample t-test result shows that the PSVT-R scores were significantly higher at the end of the course than at the beginning. This result indicates that the CAS-based courses had a positive effect in terms of improving spatial visualization skills. Travis and Lennon (1997) similarly, designed an environment including 3-D representation using Maple software in a Calculus II course and this environment enhanced students’ spatial skills and academic success. In a traditional calculus course, the teaching of calculus focused on more algebraic representations, and the importance of visualization was neglected. In addition, in a traditional calculus course, static drawing of a solid region on two-dimensional paper may be incomplete, thus causing erroneous perceptions. Several studies have shown that students have difficulties in interpreting static diagrams representing three-dimensional geometric objects as a result of these limitations (Delice & Ergene, 2015; Kösa, 2016a). The CAS has brought about a significant change in the way that teaching of calculus concepts Most CAS use programming languages and allow users to write programs for tasks. CAS also has a numerical system for visualization of 2D and 3D plots. In the treatment, students performed implementations such as rotating curves in space and observing the geometric objects from different viewpoints using MAPLE. The differences in their scores may be attributed to these implementations. A number of previous studies have demonstrated that instruction using computer-based visualizations can help students in developing spatial visualization skills (Baki et al., 2011; Güven & Kösa, 2008; Huang, 2013; Karakuş & Peker, 2015; Kösa, 2016a, 2016b). However, the instruction used in the present study was not directly designed to improve students’ spatial visualization skills.
Results show that CAS had a positive impact in changing students’ spatial visualization levels. It was determined that there were some changes in the students’ PSVT-R levels in terms of pre- and post-test scores. Students in the low PSVT-R level passed through moderate level and also students in moderate level passed through high level during the course. A key factor in the change of students’ spatial visualization skills could be the feature of MAPLE that enables the drawing and animation of a curve in 3D graphic on a two dimensional screen. In the implementation, students drew curves in triple integrals and defined their projection on the plane by using rotating or imagining views from different perspective that could improve spatial skills. This means that spatial visualization skills can be developed using a computer algebra software in the context of a calculus course. Moreover, Güven and Kösa (2008) explained that student mathematics teachers’ spatial visualization skills were low in Turkey. However, Sevimli and Delice (2010) found that spatial skills of pre-service teachers who studied with define integral were at the moderate level. In this research, it was found that undergraduate students had mostly moderate level spatial ability both before and after the course similar to the finding of Sevimli and Delice (2010).
Another purpose of this study was to determine whether spatial visualization skills could be a predictor of calculus course grades. In order to determine the relationship between students’ spatial visualization skills and their performance in the calculus course, the Pearson correlation coefficient was
www.mojet.net calculated. The correlation coefficient between spatial visualization skills and performance in calculus was r = .334 with a significance level of .05. This shows that spatial visualization skills can be a predictor for success in a calculus course. On the other hand, there is no evidence that spatial visualization skills alone can be a predictor for success in a calculus course.
Some studies (e.g., Carlson, Jacobs, Coe, Larsen, & Hsu, 2002; Eisenberg & McGinty, 1977; Thompson, 1994; Turner, 1982) have found spatial ability to be a predictor of performance in calculus. For example, Eisenberg and McGinty (1977) explained that spatial visualization test scores were higher among students in calculus course than other courses. Moreover, Turner (1982) found that calculus students with high spatial ability tend to perform better than those with low spatial ability. Similarly, Huang (2013) investigated both students’ problems related to visualization and determined what type of visual images they use while solving problems in define integral subject. The results showed that students who had high visualization ability used imagination images along with algebraic representation in solving define integral problems. However, students who had low visualization ability used memory images more. Furthermore, students who had high visualization ability were more successful than others when solving define integral problems. Balomenos, Ferrini-Mundy, and Dick (1987) stressed that in order to solve calculus problems, students should have adequate understanding of visual representations and ability to make connections between analytic and graphical representation. Therefore, well-developed spatial skills are crucial in a calculus course. However, other factors such as teaching methods, preliminary knowledge, attitudes and beliefs toward mathematics, etc. are important factors in mathematics achievement as well as spatial visualization skills. The present study indicated that spatial visualization skills explained the success in calculus in moderate level.
The present study investigated effects of using CAS on students’ spatial visualization skills in teaching triple integrals in a calculus course and whether spatial visualization skills can be a predictor of calculus course success or not. The results of the study showed that using CAS in a calculus course had a positive effect on developing students’ spatial visualization abilities. Additionally, the result of the study showed that spatial visualization skills can be a predictor for success in a calculus course. In future, additional studies may be carried out with respect to other factors that may influence spatial visualization skills and success in a calculus course.
RECOMMENDATIONS AND EDUCATIONAL IMPLICATIONS
In this study, we investigated whether a CAS-based calculus course could promote undergraduate students’ spatial visualization skills. The results showed that the course had a positive effect on developing the students’ spatial visualization skills. The results have some important implications for education. First is that spatial visualization skills can be improved through training using relevant content. Second is that proper instruction by using some computer software allowing users to construct lines, curves or solids in 3D on the screen are effective tools for improving spatial visualization skills. The third is that a positive relationship exists between spatial visualization skills and calculus success. For that reason if a student has a high spatial visualization skill, the calculus success could be high. Future studies may investigate whether CAS-based calculus courses or traditional calculus courses are more effective for improving spatial visualization skills. Moreover the results showed that at the beginning of the calculus course, students’ spatial skills were low. It is surprising that although the students study with three dimensional objects from early stages of elementary school to university, their spatial ability skills are still low. The reason may be examined in future research. Another result of this study indicated that spatial visualization skills can be a predictor for achievement in calculus courses. Future researchers may examine whether gender plays a role in spatial visualization skills as a predictor for success in calculus courses.
REFERENCES
Akasah, Z. A., & Alias, M. (2010). Bridging the spatial visualisation skills gap through engineering drawing using the whole-to-parts approach. Australasian Journal of Engineering Education, 16(1), 81-86.
www.mojet.net
Aksoy, Y., & Bulut, M. (2004). The influence of computer algebra system (CAS) in teaching applications of
derivative concept and problem solving abilities. Retrieved from
www.yess4.ktu.edu.tr/YermePappers/mehmet_bulut.pdf
Arıcı, S., & Aslan-Tutak, F. (2015). The effect of origami-based instruction on spatial visualization, geometry achievement and geometry reasoning. International Journal of Science and Mathematics Education, 13(1), 179-200.
Baki, A., Kösa, T., & Güven, B. (2011). A comparative study of the effects of using dynamic geometry software and physical manipulatives on the spatial visualisation skills of pre-service mathematics teachers. British Journal of Educational Technology, 42(2), 291-310.
Balomenos, R., Ferrini-Mundy, J., & Dick, T. (1987). Geometry for calculus readiness. In M . Lindquist & A. Schulte (Eds.), Learning and teaching Geometry, K-12 (pp. 195-209). Reston, VA: National Council of Teachers of Mathematics.
Battista, M. T., Wheatley, G. H., & Talsma, G. (1982). The importance of spatial visualization and cognitive development for geometry learning in preservice elementary teachers. Journal for Research in Mathematics Education, 332-340.
Boakes, N. (2009). Origami instruction in the middle school mathematics classroom: Its impact on spatial visualization and geometry knowledge of students. Research in Middle Level Education Online, 32(7), 1-12.
Çakmak, S. (2009). An investigation of the effect of origami-based instruction on elementary students’ spatial ability in mathematics. (Unpublished master thesis, Middle East Technical University, Ankara).
Carlson, M., Jacobs, S., Coe, E., Larsen, S., & Hsu, E. (2002). Applying covariational reasoning while modeling dynamic events: A framework and a study. Journal for Research in Mathematics Education,33, 352-378.
Carroll, J. B. (1993). Human cognitive abilities: A survey of factor-analytic studies. New York, NY: Cambridge University Press.
Cohen, J. (1988). Statistical power analysis for the behavioral sciences. Hillsdale, NJ: Erlbaum.
Creswell, J. W. (2012). Educational research: Planning, conducting and evaluating quantitative and qualitative research. Boston, MA: Pearson.
Delice, A., & Ergene, Ö. (2015). Investigation of drawings and rotation skills in integral volume problems solving process within communities of practices. Journal of Theory and Practice, 11(4), 1288-1309.
Eisenberg, T., & McGinty, R. L. (1977). On spatial visualization in college students. Journal of Psychology, 95, 99-104.
Ferrini-Mundy, J. (1987). Spatial training for calculus students: Sex differences in achievement and in visualization ability. Journal for Research in Mathematics Education, 126-140.
www.mojet.net Field, B. W. (2007). Visualization, intuition, and mathematics metrics as predictors of undergraduate
engineering design performance. Journal of Mechanical Design, 129(7), 735-743.
Fraenkel, J. R., Wallen, N. E., & Hyun, H. H. (1993). How to design and evaluate research in education (8th ed.). New York, NY: McGraw-Hill.
Godarzi, S. Q., Aminifar, E., & Bakhshalizadeh, S. (2009). The impact of using computer algebra systems (CAS) in teaching and learning of “double integral”. Retrieved from
http://www.recsam.edu.my/COSMED/cosmed09/AbstractsFullPapers2009Abstract/Mathematics%2 0Parallel%20PDF/Full%20Paper/M30.pdf
Grattoni, C. (2007). Spatial skills and mathematical problem solving ability on high school students. Retrieved from http://www.sesp.northwestern.edu/docs/masters/1469752174482341f7902e2.pdf
Guay, R. B. (1977). Purdue spatial visualization test. West Lafayette, IN: Purdue Research Foundation.
Guay, R. B. (1980). Spatial ability measurement: A critique and an alternative. A paper presented at the 1980 Annual Meeting of the American Educational Research Association. Boston, M.A: ERIC Document Reproduction Service No. ED 189166.
Guay, R. B., & McDaniel, E. D. (1977). The relationship between mathematics achievement and spatial abilities among elementary school children. Journal for Research inMathematics Education, 8, 211-215.
Gunderson, E. A., Ramirez, G., Beilock, S. L., & Levine, S. C. (2012). The relation between spatial skill and early number knowledge: The role of the linear number line. Developmental Psychology, 48(5), 12-29.
Güven, B., & Kösa, T. (2008). The effect of dynamic geometry software on student mathematics teachers' spatial visualization skills. The Turkish Online Journal of Educational Technology, 7(4), 100-1007.
Hegarty, M., & Waller, D. (2004). A dissociation between mental rotation and perspective-taking spatial abilities. Intelligence, 32(2), 175-191.
Hoffer, A. (1981). Geometry is more than proof. Mathematics Teacher, 74, 11-18.
Hoong, L. Y., & Khoh, L. S. (2003). Effects of geometer’s sketchpad on spatial ability and achievement in transformation geometry among secondary two students in Singapore. The Mathematics Educator, 7(1), 32-48.
Huang, C. H. (2013). Engineering students’ visual thinking of the concept of definite integral. Global Journal of Engineering Education,15(2), 111-117.
Kabaca, T., Aksoy, Y., Aktümen, M., & Mirasyedioğlu, Ş., (2009) The Use of computer algebra systems in
calculus teaching: Principles and sample applications. Vienna, Austria: Intech Education and Publishing.
www.mojet.net Karakuş, F., & Peker, M. (2015). The effects of dynamic geometry software and physical manipulatives on pre-service primary teachers’ van Hiele levels and spatial abilities. Turkish Journal of Computer and Mathematics Education (TURCOMAT), 6(3), 338-365.
Kaufmann, H., Steinbügl, K., Dünser, A., & Glück, J. (2005). General training of spatial abilities by geometry education in augmented reality. Annual Review of Cyber Therapy and Telemedicine: A Decade of VR, 3, 65-76.
Kaufman, S. B. (2007). Sex differences in mental rotation and spatial visualization ability: Can they be accounted for by differences in working memory capacity? Intelligence, 35(3), 211-223.
Kayhan, B. (2005). Investigation of high school students’ spatial ability. (Unpublished Master’s thesis, Middle East Technical University,Ankara).
Kösa, T. (2016a). Effects of using dynamic mathematics software on pre-service mathematics teachers spatial visualization skills: The case of spatial analytic geometry. Educational Research and Reviews, 11(7), 449-458.
Kösa, T. (2016b). The effect of using dynamic mathematics software: Cross section and visualization. International Journal for Technology in Mathematics Education, 23(4), 121-128.
Kurtuluş, A. (2013). The effects of web-based interactive virtual tours on the development of prospective mathematics teachers' spatial skills. Computers & Education, 63, 141-150.
Linn, M., & Petersen, A. (1985). Emergence and characterization of sex differences in spatial ability: A meta-analysis. Child Development, 56, 1479-1498.
Maier, P. H. (1998). Spatial geometry and spatial ability: How to make solid geometry solid? In E. Cohors-Fresenborg, K. Reiss, G. Toener, & H.-G. Weigand (Eds.), Selected papers from the Annual Conference of Didactics of Mathematics 1996 (pp. 63-75).
Mallet, D. G. (2007). Multiple representations for systems of linear equations via the computer algebra system Maple. International Electronic Journal of Mathematics Education,2(1), 16-32.
Markey, S. M. (2009). The relationship between visual-spatial reasoning ability and math and geometry problem-solving. (Doctoral dissertation). Available from ProQuest Dissertations and Theses database (UMI No. 3385692).
Mathews, J. H. (1990). Using a computer algebra system to teach double integration. International Journal of Mathematical Education in Science and Technology,21(5), 723-732.
McGee, M. G. (1979). Human spatial abilities: Psychometric studies and environmental, genetic, hormonal and neurological influences. Psychological Bulletin, 86, 889-918.
McLeay, H. (2006). Imagery, spatial ability and problem solving. Mathematics Teaching Incorporating Micromath,195, 36-38.
McMillan, J. H., & Schumacher, S. (2014). Research in education: Evidence-based inquiry. Boston, MA: Pearson.
www.mojet.net Meagher, M. (2005). The processes of learning in a computer algebra system (CAS) environment for college
students learning calculus. (Doctoral dissertation, The Ohio State University).
Miller, D. I., & Halpern, D. F. (2013). Can spatial training improve long-term outcomes for gifted STEM undergraduates? Learning and Individual Differences,26, 141-152.
Noinang, S., Wiwatanapataphee, B., & Wu, Y. H. (2008). Teaching-Learning tool for integral calculus.
Presentation at The 13th Asian Technology Conference in Mathematics, Suan Sunandha Rajabhat University, Bangkok, Thailand.
Olkun, S. (2003). Making connections: Improving spatial abilities with engineering drawing activities. International Journal of Mathematics Teaching and Learning, 1-10.
Pierce, R., & Stacey, K. (2004). A framework for monitoring progress and planning teaching towards the effective use of computer algebra systems. International Journal of Computers for Mathematical Learning,9(1), 59-93.
Salleh, T. S. A., & Zakaria, E. (2013). Enhancing students’ understanding in integral calculus through the integration of Maple in learning. Procedia-Social and Behavioral Sciences,102, 204-211.
Sevimli, E., & Delice, A. (2010). The influence of teacher candidates' spatial visualization ability on the use of multiple representations in problem solving of definite integrals: a qualitative analysis. Retrieved from http://www.bsrlm.org.uk/IPs/ip30-2/BSRLM-IP-30-2-10.pdf
Silverberg, J. (1999). Does calculus reform work? MAA NOTES,49, 245-248.
Sorby, S. A., & Baartmans, B. J. (1996). A course for the development of 3-D spatial visualization skills. Engineering Design Graphics Journal,60(1), 13-20.
Sorby, S., Casey, B., Veurink, N., & Dulaney, A. (2013). The role of spatial training in improving spatial and calculus performance in engineering students. Learning and Individual Differences,26, 20-29.
Travis, B., Lennon, E., (1997). Spatial skills and computer-enhanced instruction in calculus. Journal of Computers in Mathematics and Science Teaching,16(4), 467-475.
Thompson, P. W. (1994). Images of rate and operational understanding of the fundamental theorem of calculus. Educational Studies in Mathematics, 26, 229-274.
Thompson, P. W., Byerley, C., & Hatfield, N. (2013). A conceptual approach to calculus made possible by technology. Computers in the Schools, 30(1-2), 124-147.
Turgut, M., & Yilmaz, S. (2012). Relationships among preservice primary mathematics teachers’ gender, academic success and spatial ability. Online Submission, 5(2), 5-20.
Turner, K. V. (1982). An investigation of the role of spatial performance, learning styles, and kinetic imagery in the learning of calculus. (Unpublished Ph.D. dissertation, Purdue University).
www.mojet.net
Yıldız, B. (2009). Üç boyutlu ortam ve somut materyal kullanımının uzamsal görselleştirme ve zihinde
döndürme becerilerine etkileri. (Unpublished master thesis, Hacettepe Üniversitesi, Ankara).
Yolcu, B., & Kurtuluş, A. (2010). A study on developing sixth-grade students' spatial visualization ability.
İlköğretim Online, 9(1), 256-274.
Wiwatanapataphee, B., Noinang, S., Wu, Y. H., & Nuntadilok, B. (2010). An integrated Powerpoint-Maple based teaching-learning model for multivariate integral calculus. International Electronic Journal of Mathematics Education,5(1), 5-31.
Zimmermann, W. (1991, February). Visual thinking in calculus. In W. Zimmermann & S. Cunningham (Eds.), Visualization in teaching and learning mathematics (pp. 127-137). Washington, DC: MAA.
www.mojet.net
APPENDIX
An example of a worksheet on triple integrals with MAPLE
(The left part shows the worksheet given to the students, and the right part shows the explanations about the solution of the integral).
Subject: Definition of triple integrals and drawing solid region
GroupName: Date: / / 2014
Worksheet solution of the integral The explanations about the
Use the triple integrals to find the integral
�12𝑥𝑦𝑒𝑦𝑧2
111
00𝑥2
𝑑𝑧𝑑𝑥𝑑𝑦
Students cannot find this integral according to the z immediately. Therefore, it is necessary to change the order of integration
Draw the bounded region using MAPLE
www.mojet.net Find the projection of
region onto the xz-plane, xy-plane and yz-xy-plane to change the order of integration.
projection on xz-plane
projection on xy-plane
projection on yz-plane
Choose one of the projections onto the planes and rearrange order of the triple integral.
Students can choose the projection on the yz-plane.
Now find the integral.