INTRODUCTION
Bankruptcy prediction has long been an important and widely studied topic. The main impact of such research is in bank lending. Banks need to predict the possibility of default of a potential counterparty before they extend a loan. This can lead to sounder lending decisions, and therefore result in significant savings. In this study we focus only on the bankruptcy prediction problem for firms in the banking sector. Measuring the credit risk accurately also allows banks to engineer future lending transactions, so as to achieve targeted return/risk characteristics.
COMPUTER SCIENCE & TECHNOLOGY
www.computerscijournal.org
December 2011, Vol. 4, No. (2): Pgs. 317-327 An International Open Free Access, Peer Reviewed Research Journal
Application of Artificial Neural Network
in the Ratio Prediction of Axis Bank
ROLI PRADHAN
Department of Management Studies, MANIT, Bhopal (India).
(Received: September 27, 2011; Accepted: November 01, 2011)
ABSTRACT
The prediction of corporate bankruptcies is an important and widely studied topic since it can have significant impact on bank lending decisions and profitability. This work presents two contributions. First we review the topic of bankruptcy prediction, with emphasis on different models. Second, Inspired by the traditional credit risk models developed, we propose novel indicators for the NN system. Thereafter, this paper using the tailored back-propagation neural network endeavors to predict the financial ratios expressing the position of a firm to regulate the bankruptcy and assess the credit risks. It first estimates the financial ratio for a firm from 2001-2008 to the train the BPNN and uses the estimates of the year 2009 and 2010 values for the validation process. Finally it dwells to draw predictions for the period 2011-2015 and emphasizes the growing role of BPNN application based prediction models for banking sector with a case study of AXIS bank. We conclude with practical suggestions on how best to integrate models and research into policy making decisions.
Key words: Artificial Neural Network, Ratio prediction, Corporate Bankruptcies.
The focus of this article is on the application of the tailored backpropagation neural network application to check viability of credit lending using financial ratios. In the next section we give a review on the approach. Section III presents model design and methodology of using the ratios. Section IV discusses the input parameters being ratios of the ratio pillars. Section IV discusses the convergence details for the network. Section V throws light on the results and outcomes for the ratio pillars .Section VI provides the summary and conclusion of this paper.
Literature review
the bank authorities and the central banks on the global level to draw a number of lessons. The result being the new Basel Capital Accord which enlisted guidelines that all banks should develop systematic validated methods for assessing the risks associated with lending. As a result the new rules may increase the operational security of the banks in granting the credit. They are required to establish objective criteria and techniques for modeling the assessment of risk cutting down dependence on subjective personal judgment. Basel II norms are adopted to prevent banks from unexpected losses, improved profitability, increase risk carrying capacity and undertake more obligations. In consistence with the Basel Accord, it is realistic to expect that additional analytical tools be designed to manage the credit risk more effectively in the periods to come. We can therefore hope that credit scoring models would serve as a platform for these changes. Even though statistical models were formulated about 30 years ago, credit lending does not have any bench marks still paucity of default information continues to prove a principal obstacle to researchers
Academic studies seeking to predict corporate bankruptcies have a long history. An early study was based on a univariate analysis approach (Beaver 1966). Multivariate analysis techniques used in subsequent studies include discriminant analysis (Altman 1968), logit and probit regressions (Ohlson 1980, Zmijewski 1984) and hazard analysis (Shumway 2001). The exact variables used in these studies vary and include both accounting-based and market-accounting-based variables, but all of these studies have proposed reduced form models which are able to predict corporate bankruptcies with a fair degree of accuracy. Shumway (2001) compares the forecasting accuracy of a hazard model using a set of five variables, comprising two accounting-based and three market-accounting-based variables, to Altman’s (1968) and Zmijewski’s (1984) specifications which used mainly accounting-based variables, and concludes that the hazard model with accounting and market-based variables is the most accurate. In an examination of secular changes in the ability of accounting variables to predict bankruptcy, Beaver et al. (2005) find a slight decline in the predictive ability of financial ratios based on accounting variables over the period 1962 to 2002,
with a corresponding improvement in the incremental predictive ability of market-based variables. Structural models of default, based on Merton (1974) and commercialized by firms like Moody’s KMV (Crosbie and Bohn 2001), have also been studied (e.g., Vassalou and Xing 2004; Hillegeist et al. 2004). Although Hillegeist et al. (2004) find that these structural models outperform purely accounting-based, reduced form models, Campbell et al. (2008) find that information from structural models does not add any additional explanatory power to reduced form models utilizing both accounting and market information. Bharath and Shumway (2008) show that the functional form suggested by the Merton model is useful for predicting defaults, though it does not serve as a sufficient statistic for the probability of default.
Model design and methodology
In this paper, a two step methodology has been adopted. The part A provides the steps formulated for the prediction of financial ratio pillars, followed by part B which enlists the steps followed for the prediction of financial ratios using artificial neural networks.
Part A: Formulation of Ratio Pillars
The basic ratios are formulated from details mentioned in published statements like balance sheet, cash flow statements, yearly details of banks, profit and loss statements obtained from CMIE database, Reserve Bank of India. Data is also taken from the official websites of the banks and financial institutions and the internet. Consequently this research work uses financial data i.e. published time series data for the last 11 years from 2000 to 2009.
Part A
Eight ratio pillars have been constructed for the needful being Investment Valuation Ratio Pillar, Profitability Ratio Pillar, Management Efficiency Ratio Pillar, Profit & Loss Ratio Pillar, Debt Coverage Ratio Pillar, Cash Flow Indicator Ratio Pillar, Leverage Ratio. Ratio Pillar, Overall Performance Ratio Pillar.
Part B
inputs, Tolerance level Minimization, Data convergence using Neural Networks, Formulation of Absolute error, Prediction of ratios in each Ratios pillar, Data Validation
BPNN Model application for AXIS Bank
Axis Bank, formerly UTI Bank, is India’s third largest private-sector bank after the significantly larger ICICI Bank and HDFC Bank. It is engaged in Large & Mid Corporate Banking, Retail Banking, SME banking, Agri-business banking, International Banking, treasury etc. It has the largest EDC (Electronic Data Capturing) network, the third largest ATM network and the fourth largest base of debit cards in India. As of 31st December, 2010 it had a very wide network of more than 1281 branches including 169 Service Branches and over 5303 ATMs.
The basic input sheets for all the eight pillars are formulated for AXIS Bank. The process of ratio pillar formulation uses the book formulae for computation of the ratios in each pillar, which will further be used as input parameters for Artificial Neural Network. The details of the ratios and the values are enlisted in the table 1.
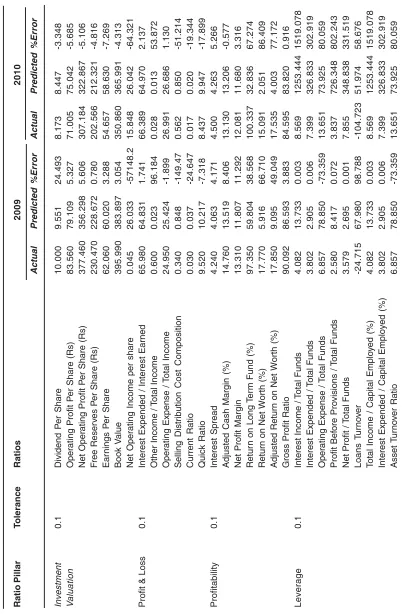
BPNN Modeling analysis, results and outcomes After the computation of the basic ratio pillars, as suggested by Table 1, this section uses the ratios in each pillar as inputs to train the network. The network after training computes the values of the ratios from 2009 upto the year 2015 at different tolerance level. The validation is done by the values obtained for the year 2009 and 2010.The tolerance level that provides the closest values is considered for prediction. Table 2 provides details of the percentage error at the adopted level of tolerance.
Observations
The validation was carried out for all the ratios. By the analysis of standard error the included ratios and excluded ratios were formulated. The ratios that have shown a deviation greater than 25% from the actual field data estimates are ignored. Such ratios are termed as excluded ratios. The excluded ratios have not been considered in the prediction process and have been dropped out from the prediction process. The estimates from 2001 to 2008 were applied to train the backpropagation
neural network and subsequently estimate the values for the year 2009 to 2010 the data values were used for validation. Based on these values predictions were drawn using BPNN from 2011 to 2015. The market has witnessed several ups and downs during the period 2005 and 2010 and the modeled BPNN has been able to closely predict the values from 2005 to 2010. The trained BPNN has been able to forecast the values of the internal included ratios of the ratio pillar in approximation to the actual values suggesting that the BPNN has the ability to forecast the financial ratios.
Analysis & findings
As per the above convergence study the table 5 provided the details of the size of ANN used for prediction and the associated level of tolerance.
T
a
ble1:
Ratios used as Inputs f
or the Neural Netw
ork Ratio Pillars Ratios Specifications 2000 2001 2002 2003 2004 2005 2006 2007 2 008 2 009 2 010 Investment Dividend P er Share 0.29 0.89 1.05 1.56 2.20 2.80 3.50 4.50 6.00 10.00 8.17 V aluation Oper
ating Profit P
er Share (Rs)
5.35 12.37 17.56 18.25 20.89 22.49 34.12 42.36 56.88 83.56 71.01
Net Operating Profit/Share (Rs)
42.50 42.50 48.50 49.50 50.23 83.98 128.98 193.93 244.63 377.46 307.18 F ree Reser v es P
er Share (Rs)
15.00 15.06 15.56 20.05 25.50 54.08 75.38 86.60 208.03 230.47 202.57 Ear nings P er Share 6.53 6.99 8.40 11.72 11.8 17.41 23.40 29.94 50.57 62.06 54.66 Book V alue 22.85 32.0 39.8 49.07 87.9 103.0 120.8 245.1 284.5 395.9 350.8
Net Operating Income per share
3.47 1.55 7.61 9.40 15.83 0.85 14.80 16.60 26.04 0.05 15.85 Profit Interest Spread 3.05 3.14 3.24 3.33 3.42 4.09 3.14 3.27 3.77 4.24 4.50
Adjusted Cash Margin (%)
20.4 19.7 18.9 18.24 17.5 17.47 16.07 14.11 14.19 14.76 13.13
Net Profit Margin
15.3 15.0 14.7 14.38 14.0 14.33 13.47 12.01 12.22 13.31 12.08 Retur
n on Long
T e rm Fund (%) 64.13 67.75 71.37 74.99 78.61 70.55 88.56 119.74 71.17 97.35 100.34
Return on Net Worth (%)
22.0 21.3 20.6 19.93 19.2 18.19 18.28 19.37 12.21 17.77 15.09
Adjusted Return on Net Worth (%)
13.54 13.54 13.54 13.54 13.54 13.54 16.94 19.45 12.38 17.85 17.54
Gross Profit Ratio
1 0 0 1 0 1 98.5 90.76 88.1 87.99 87.48 86.60 91.69 90.09 84.60 Profit & Loss
Interest Expended / Interest Earned
58.02 58.86 59.69 60.53 61.37 62.00 62.68 65.64 63.09 65.98 66.39
Other Income /
T otal Income 1.81 1.63 1.45 1.27 1.10 1.48 0.18 0.39 0.16 0.60 0.03 Oper
ating Expense /
T o tal Income 16.06 17.15 18.25 19.34 20.43 21.02 23.13 23.26 26.20 24.95 26.99
Selling Distribution Cost Composition
0.48 0.49 0.50 0.51 0.51 0.49 0.47 0.54 0.85 0.34 0.56 Current Ratio 0.09 0.08 0.07 0.07 0.06 0.06 0.04 0.03 0.03 0.03 0.02 Quick Ratio 9.79 9.65 9.52 9.38 9.25 11.55 6.52 7.39 9.23 9.52 8.44 Leverage Financial Leverage 6.93 5.80 4.94 5.25 3.96 3.70 3.64 3.25 3.25 4.08 2.58
Net financial leverage
0.84 1.01 1.16 1.25 1.66 2.66 3.37 4.08 3.23 13.73 8.42 Operating Leverage 0.02 0.03 0.03 0.08 0.02 0.03 0.12 0.17 0.05 0.00 0.07 Interest Coverage 22.5 21.8 22.7 25.53 21.6 13.99 9.28 7.66 6.45 8.57 3.84 Long T e rm
Debt / Equity
20.4 27.3 37.2 45.89 71.7 139.1 208.2 280.6 286.0 1 2 5 3 726.3 D e b t-E q u it y r a ti o 19.4 25.7 33.6 40.82 63.6 121.5 177.1 242.3 250.9 1 5 1 9 802.2 Owner’
s fund as % of
T otal Source 0.03 0.05 0.06 0.07 0.12 0.14 0.32 0.33 0.33 1.00 0.67 T
otal debt to assets r
a tio 0.95 0.94 0.90 0.89 0.89 0.87 0.85 0.86 0.88 1.00 0.89
Long term debt to assets ratio
Debt Coverage
Credit Deposit Ratio
19.6 25.3 30.9 36.52 42.1 47.40 52.79 59.85 65.94 68.89 75.81
Investment Deposit Ratio
54.1 52.7 51.3 49.90 48.4 41.90 49.85 48.96 41.39 39.04 39.97
Cash Deposit Ratio
16.8 15.7 14.6 13.53 12.4 13.72 8.18 7.17 8.17 8.16 5.74 T
otal Debt to Owners Fund
18.32 17.58 16.85 16.12 15.38 13.17 13.97 17.28 9.99 11.49 10.98
Financial Charges Coverage Ratio
1.69 1.66 1.63 1.60 1.57 1.55 1.53 1.41 1.46 1.43 1.38
Financial Charges Coverage Ratio
1.42 1.41 1.39 1.37 1.35 1.35 1.32 1.26 1.28 1.28 1.24 P ost T a x Cash Flow
Dividend Payout Ratio Net Profit
27.81 27.23 26.64 26.06 25.48 26.22 23.20 22.57 23.49 23.16 21.98
Dividend Payout Ratio Cash Profit
19.72 19.80 19.87 19.95 20.03 21.08 19.49 19.30 20.47 20.98 20.50
Earning Retention Ratio
70.9 71.6 72.4 73.20 73.9 73.10 76.88 77.53 76.84 76.94 78.55
Cash Earning Retention Ratio
79.42 79.46 79.51 79.56 79.60 78.48 80.57 80.78 79.78 79.11 79.89
Adjusted Cash Flo
w Times 96.7 93.0 89.2 85.45 81.6 77.77 69.28 75.97 70.42 58.33 59.03 Managerial
Interest Income /
T otal Funds 3.64 4.40 5.15 5.91 6.66 7.43 8.22 8.88 9.57 10.53 11.19 Efficiency
Interest Expended /
T otal Funds 1.77 2.18 2.60 3.01 3.42 3.85 4.14 4.87 4.83 5.56 5.88 Oper
ating Expense /
T otal Funds 0.25 0.52 0.79 1.06 1.33 1.59 1.90 2.07 2.51 2.64 2.96 Profit Bef ore Pro visions / T otal Funds 1.35 1.44 1.53 1.62 1.71 1.84 1.98 1.79 2.07 2.25 2.26
Net Profit /
T otal Funds 0.62 0.69 0.77 0.85 0.93 1.05 1.11 1.07 1.17 1.41 1.40 Loans T u rn o v er 0.18 0.18 0.18 0.18 0.18 0.18 0.19 0.18 0.18 0.19 0.19 T o
tal Income / Capital Emplo
y ed (%) 3.74 4.49 5.24 5.98 6.73 7.54 8.23 8.92 9.59 10.60 11.22
Interest Expended / Capital Employed (%)
1.77 2.18 2.60 3.01 3.42 3.85 4.14 4.87 4.83 5.56 5.88 Asset T u rn o v er Ratio 0.18 0.22 0.33 0.47 1.66 3.01 4.00 4.97 6.32 7.78 8.77 Overall
Capital Adequacy Ratio
9.25 9.72 10.1 10.66 11.1 12.66 11.08 11.57 13.73 13.69 13.96
Advances / Loans Funds (%)
30.69 35.85 41.01 46.17 51.34 56.76 58.50 69.07 75.89 73.87 82.30
Return on invested capital (ROIC)
5.04 2.47 1.75 1.23 1.05 0.72 0.53 0.32 0.23 0.17 -0.96
Return on Equity (ROE)
0.01 0.01 0.01 0.02 0.02 0.02 0.02 0.03 0.04 0.04 0.04
Fixed Assets Ratio
0.41 0.44 0.54 0.78 0.96 1.23 1.51 1.93 1.85 2.15 2.34 Capital T u rn o v er Ratio 0.00 0.00 0.01 0.01 0.01 0.01 0.01 0.01 0.02 0.02 0.02
Sales /net fixed Assets
T a ble 2: The per centa g e err or and T olerance Le vel f
or the Eight Ratio Pillar
s Ratio Pillar T olerance Ratios 2 0 0 9 2 0 1 0 Actual Predicted %Error Actual Predicted %Error Investment 0 .1 Dividend P er Share 10.000 9.551 24.493 8.173 8.447 -3.348 V aluation Oper
ating Profit P
er Share (Rs)
83.560 79.109 5.327 71.005 75.042 -5.685 Net Oper
ating Profit P
er Share (Rs)
377.460 356.298 5.606 307.184 322.867 -5.106 F ree Reser v es P
er Share (Rs)
230.470 228.672 0.780 202.566 212.321 -4.816 Ear nings P er Share 62.060 60.020 3.288 54.657 58.630 -7.269 Book V alue 395.990 383.897 3.054 350.860 365.991 -4.313
Net Operating Income per share
0.045 26.033 -57148.2 15.848 26.042 -64.321
Profit & Loss
0 .1 Interest Expended / Interest Earned 65.980 64.831 1.741 66.389 64.970 2.137
Other Income /
T otal Income 0.600 0.023 96.184 0.028 0.013 53.872 Oper
ating Expense /
T o tal Income 24.950 25.424 -1.899 26.991 26.686 1.130
Selling Distribution Cost Composition
0.340 0.848 -149.47 0.562 0.850 -51.214 Current Ratio 0.030 0.037 -24.647 0.017 0.020 -19.344 Quick Ratio 9.520 10.217 -7.318 8.437 9.947 -17.899 Profitability 0 .1 Interest Spread 4.240 4.063 4.171 4.500 4.263 5.266
Adjusted Cash Margin (%)
14.760 13.519 8.406 13.130 13.206 -0.577
Net Profit Margin
13.310 11.807 11.292 12.081 11.680 3.316 Retur
n on Long
T e rm Fund (%) 97.350 59.804 38.568 100.337 32.836 67.274
Return on Net Worth (%)
17.770 5.916 66.710 15.091 2.051 86.409
Adjusted Return on Net Worth (%)
17.850 9.095 49.049 17.535 4.003 77.172
Gross Profit Ratio
90.092 86.593 3.883 84.595 83.820 0.916 Leverage 0 .1
Interest Income /
T otal Funds 4.082 13.733 0.003 8.569 1253.444 1519.078
Interest Expended /
T otal Funds 3.802 2.905 0.006 7.399 326.833 302.919 Oper
ating Expense /
T otal Funds 6.857 78.850 -73.359 13.651 73.925 80.059 Profit Bef ore Pro visions / T otal Funds 2.580 8.417 0.072 3.837 726.348 802.243
Net Profit /
T otal Funds 3.579 2.695 0.001 7.855 348.838 331.519 Loans T u rn o v er -24.715 67.980 98.788 -104.723 51.974 58.676 T o
tal Income / Capital Emplo
y ed (%) 4.082 13.733 0.003 8.569 1253.444 1519.078
Interest Expended / Capital Employed (%)
Debt Coverage
0
.1
Credit Deposit Ratio
68.890
64.200
6.807
75.813
66.151
12.744
Investment Deposit Ratio
39.040
40.714
-4.289
39.974
40.195
-0.552
Cash Deposit Ratio
8.160
7.623
6.580
5.741
5.750
-0.157
T
otal Debt to Owners Fund
11.490
12.781
-11.232
10.978
11.294
-2.879
Financial Charges Coverage Ratio
1.430
1.501
-4.988
1.383
1.490
-7.761
Financial Charges Co
v
e
rage Ratio P
ost
T
a
x
1.280
1.321
-3.228
1.244
1.317
-5.850
Cash-flow
0
.1
Dividend Payout Ratio Net Profit
23.630
18.695
20.884
23.500
18.947
19.376
Dividend Payout Ratio Cash Profit
21.700
17.115
21.129
21.840
17.466
20.028
Earning Retention Ratio
76.380
87.391
-14.416
76.490
87.100
-13.871
Cash Earning Retention Ratio
78.300
88.829
-13.447
78.150
88.591
-13.360
Adjusted Cash Flo
w
Times
99.780
80.216
19.607
98.530
84.662
14.075
Managerial
0
.1
Interest Income /
T
otal Funds
10.530
9.921
5.786
11.191
10.501
6.170
Efficiency
Interest Expended /
T
otal Funds
5.560
5.832
-4.892
5.883
5.994
-1.881
Oper
ating Expense /
T
otal Funds
2.640
2.535
3.981
2.955
2.947
0.284
Profit Bef
ore Pro
visions /
T
otal Funds
2.250
2.395
-6.426
2.259
2.200
2.621
Net Profit /
T
otal Funds
1.410
1.351
4.149
1.396
1.368
1.977
Loans T
u
rn
o
v
er
0.190
0.182
4.348
0.187
0.182
2.715
T
o
tal Income / Capital Emplo
y
ed (%)
10.600
10.233
3.462
11.220
11.522
-2.690
Interest Expended / Capital Employed (%)
5.560
5.268
5.248
5.883
5.981
-1.665
Asset T
u
rn
o
v
er
Ratio
7.780
7.500
3.599
8.774
8.301
5.393
Overall
0.1
Capital Adequacy Ratio
13.690
73.870
0.165
0.043
2.146
0.018
Advances / Loans Funds (%)
12.974
69.754
0.168
0.024
1.305
0.010
Return on invested capital (ROIC)
5.233
5.572
-1.696
45.291
39.189
46.507
Return on Equity (ROE)
13.959
82.301
-0.955
0.044
2.341
0.018
Fixed Assets Ratio
13.412
79.700
0.159
0.024
1.347
0.010
Capital T
u
rn
o
v
er
Ratio
18.249
29.892
116.641
44.147
42.463
44.954
Sales /net fixed Assets
13.690
73.870
0.165
0.043
2.146
T
a
ble 3:
Details in brief of the predicted ratios in all eight pillar
s
Ratio Pillar
T
olerance
Ratios
2009
2010
2011
2012
2013
2
014
2015
Investment
0
.1
Dividend P
er Share
4.56
5.98
9.55
8.45
8.79
8.93
9.00
V
aluation
Oper
ating Profit P
er Share (Rs)
43.08
57.05
79.11
75.04
77.24
78.20
78.72
Ear
nings P
er Share
31.94
49.29
60.02
58.63
56.84
55.88
56.89
Book V
alue
220.94
293.64
383.90
365.99
374.00
377.40
379.18
Profit & Loss
0
.1
Oper
ating Expense /
T
o
tal Income
25.42
26.69
26.76
26.79
26.81
26.82
26.82
Current Ratio
0.04
0.02
0.03
0.03
0.05
0.05
0.05
Quick Ratio
10.22
9.95
8.51
8.52
8.52
8.52
9.53
Profitability
0.1
Interest Spread
4.06
4.26
4.36
4.41
4.43
4.45
4.45
Adjusted Cash Margin (%)
13.52
13.21
12.98
12.83
12.74
12.68
12.65
Net Profit Margin
11.81
11.68
11.60
11.55
11.52
11.50
11.49
Gross Profit Ratio
86.59
83.82
81.27
79.20
77.66
76.55
75.77
Leverage
0
.1
Financial Leverage
3.80
3.58
2.55
2.33
2.16
2.03
1.93
Interest Coverage
7.40
7.85
7.58
7.43
7.34
6.93
6.23
T
otal debt to assets ratio
0.97
1.09
0.92
0.92
0.92
0.92
0.92
Long term debt to assets ratio
0.86
0.80
0.80
0.83
0.88
0.88
0.79
Debt Coverage
0
.1
Credit Deposit Ratio
64.20
66.15
67.62
68.73
69.57
70.23
70.74
Investment Deposit Ratio
40.71
40.19
44.71
44.28
43.88
43.52
43.20
Cash Deposit Ratio
7.62
5.75
5.03
4.46
3.99
3.62
3.31
T
otal Debt to Owners Fund
12.78
11.29
11.85
11.45
11.09
10.78
10.50
Financial Charges Coverage Ratio
1.50
1.49
1.48
1.47
1.46
1.45
1.45
Financial Charges Coverage
1.32
1.32
1.31
1.31
1.31
1.30
1.30
Ratio P
o
st
T
a
x
Cash-flow
0.1
Dividend Payout Ratio Net Profit
23.01
21.89
22.89
23.89
22.89
23.89
24.89
Dividend Payout Ratio Cash Profit
21.01
20.30
21.01
20.01
19.01
20.02
19.02
Adjusted Cash Flo
w
Times
60.79
60.80
58.80
55.81
50.81
48.82
55.82
Managerial
0.1
Interest Income /
T
otal Funds
9.92
10.50
10.74
10.93
10.08
10.20
suggested by the network also being 0.2% to 5.8%. For Current Ratio a movement from 1% to 83% is observed and the network shows a similar fashion being approximately 0.6% to 75%.For Quick Ratio shows a movement from 3% to 43% is observed and the network shows a similar fashion being approximately 2% to 39%.In the Leverage Ratio Pillar it has been observed that the Financial Leverage moves in the range from 1% to 20% and the same movement of ratios has been predicted by the neural network. For the Interest Coverage the ratios oscillate in the range from 2% to 17% and the network suggests a similar trend being 0.01% go 13%. For Total debt to assets ratio shows a movement from 1% to 13% is observed and the network moved a similar pattern. For the Long term debt to assets ratio shows a movement from 0.1% to 17% is observed and the network moved a similar pattern.In the Debt Coverage Ratio Pillar it has been observed that the ratio Credit Deposit Ratio shows a movement of 4% to 12% as suggested by the network also being 2.7% to 8%. For Investment Deposit Ratio shows a movement from 2.6% to 15.1% is observed and the network shows a similar fashion being approximately 0.7% to 11%. For Cash Deposit Ratio shows a movement from 0.1% to 29% is observed and the network shows a similar fashion being approximately 1% to 24 %. For Total Debt to Owners Fund shows a movement from 4% to 23% is observed and the network shows a similar fashion being approximately 2% to 24 %. For Financial Charges Coverage Ratio shows a movement from 0.1% to 4.5% is observed and the network shows a similar fashion being approximately 0.2% to 3%. For Financial Charges Coverage Ratio Post Tax shows a movement from 0.1% to 4.5% is observed and the network shows a similar fashion being approximately 0.2% to 3%.In the Cashflow Ratio Pillar studies revealed that the Dividend Payout Ratio Net Profit moves in the range from 11% to 4% and the same movement of ratios has been predicted by the neural network. For the Dividend Payout Ratio Cash Profit the ratios oscillate in the range from 7% to 5% and the network suggests a similar trend. For Adjusted Cash Flow Times shows a movement from 5% to 10% is observed and the network moved a similar pattern.In the Managerial Efficiency Ratio Pillar study suggested that the Interest Income / Total Funds show a range of 6% to 20%, similar kind of error in the range of 1% to 12%
Efficiency
Interest Expended /
T
otal Funds
5.83
5.99
5.71
5.23
5.31
5.37
5.43
Oper
ating Expense /
T
otal Funds
2.53
2.95
2.96
2.73
2.68
2.72
2.75
Profit Bef
ore Pro
visions /
T
otal Funds
2.39
2.20
2.09
2.00
2.02
2.03
2.04
Net Profit /
T
otal Funds
1.35
1.37
1.26
1.23
1.25
1.26
1.27
T
o
tal Income / Capital Emplo
yed (%)
10.23
11.52
10.76
10.94
10.93
11.21
11.31
Interest Expended / Capital
5.27
5.98
6.01
6.21
6.30
6.36
6.42
Employed (%) Asset T
u
rn
o
ver
Ratio
7.50
8.30
8.43
8.78
8.06
8.29
8.47
Overall
0.1
Capital Adequacy Ratio
12.97
13.41
13.46
12.50
11.55
11.59
11.63
Advances / Loans Funds (%)
69.75
79.70
78.60
75.45
70.25
71.01
is predicted by the network. The Interest Expended / Total Funds move in the range from 0.8% to 23% and the similar swing of 0.9% to25% has been predicted by the neural networ k. The ratio Operating Expense / Total Funds shows a movement of 5% to 21% as suggested by the network also being 4% to 19 %. The ratio Profit before Provisions / Total Funds shows a movement of 0.4% to 16% a similar trend of 0.8% to 26% is projected by the network. For Net Profit / Total Funds, shows a movement from 3% to 20% is observed and the network shows a similar fashion being approximately 5% to 15%.The ratio being Total Income / Capital Employed (%) shows a movement from 5% to 20% is observed and the network shows a similar fashion being approximately 5% to 15%. The Interest Expended / Capital Employed (%), shows a movement from 0.8% to 17% is observed and the network shows a similar fashion being approximately 0.8% to 14%. The Asset Tur nover Ratio shows a movement from 12% to 53% is observed and the network shows a similar fashion being approximately 11% to 57%.In the Overall Ratio Pillar analysis study revealed that the Capital Adequacy Ratio show a range of 1.6% to 12%, a similar kind of error in the range of 0.3% to 8% is predicted by the network. The Advances / Loans Funds (%) moves in the range from 2% to 16% and the similar swing of 0.9% to 18% has been predicted by the neural network.
The simulation study output suggests that if these parameters are incorporated in the policy decisions the viability of credit lending would in turn be enhanced as the chances of estimating the financial position of the firm at the time of lending
and even at the time of changing the policy measures of credit be analysed.
CONCLUSION
In times of economic distress the BPNN model would provide assistance to finding the financial viability of the firm. The tailored back-propagation neural network endeavors to predict the financial ratios expressing the position of a firm to regulate the bankruptcy and assess the credit viability when a bank requires credit and can also be utilized to plan the periods of recovery of the lent amount. We have proposed novel inputs being ratio pillars incorporating certain ratios. As can be seen from the results, the new indicators (included ratios) influence the credit lending and act as the central factors for prediction of credit. This can be explained by the tendency of the financial to be highly volatile, not only of the health of a firm, but also of the health of the economy, which in turn affects the creditworthiness of the firm. The analysis also suggests that the model can forecast the financial position of the firm in case of loan value enhancement as well as the extension of the repayment period implying to be effective in the designing of policy measures related to credit viability thus proves to be a vital tool to regulate the occurrence of credit defaults. As the ratio pillars incorporate all the terms to be included while assessment of the firm’s financial position there are less chances of being misguided in the terms of credit lending hence the model can also act as an early warning system for the corporate and can be useful as a communication tool between the credit analyst and the management and hence serve in a practical credit risk policy context.
REFERENCES
1. Altman, Edward, “Financial ratios,
discriminant analysis and the prediction of cor porate bankruptcy”, The Journal of Finance, 13(4), September, 589-609 (1968).
2. Altman, Edward, “The success of business
failure prediction models: an international
survey”, Journal of Banking and Finance,
171-198 (1984).
3. Atiya, Amir., “Bankruptcy prediction for credit
risk using neural networks: a survey and new
results”, IEEE Transactions on Neural
Networks, 12(4): 929-935 (2001).
4. Beaver, William H.; Mcnichols, Maureen F.;
bankruptcy”, Review of Accounting Studies, 10: 93-122 (2005).
5. Bharath Sreedhar T., Shumway Tyler, “
Forecasting Default with the Merton Distance to Default Model”, The Review of Economic Times, 21(3): 1339-1369 (2008).
6. Campbell, Steven V., “Predicting bankruptcy
reorganization for closely held firms”,
Accounting Horizons, 10(3): 12-25 (1996).
7. Collins, Robert A.; Green, Richard.,
“Statistical methods for bankruptcy
forecasting”, Journal of Economics and
Business, 34: 349-354 (1982).
8. Deakin, Edward., “A discriminant analysis
of predictors of business failure”, Journal of Accounting Research, Spring, 167-179 (1972).
9. Edminster, Robert O., “An empirical test of
financial ratio analysis for small business failure prediction”, Journal of Financial and Quantitative Analysis, 1477- 1493 (1972).
10. Gordon, M. J., “Towards a theory of financial
distress”, Journal of Finance, 26: 347-356
(1971).
11. Hillegeist, Stephen; Keating, Elizabeth;
Cram, Donald, Lundstedt, Kyle., “Assessing the probability of bankruptcy”, Review of Accounting Studies, 9: 5-34 (2004).
12. Keasey, Kevin; MC.guiness, Paul., “The
failure of U.K. industrial firms for the period 1976-1984, logistic analysis and entropy measures”, Journal of Business, Finance and
Accounting, 17(1): 119-135 (1990B).
13. Mensah, Waw H., “The differential
bankruptcy predictive ability of specific price level adjustments: some empirical evidence”, The Accounting Review, Vol. LVIII, (2): 228-246 (1983).
14. Mensah, Yaw H., “An examination of the
stationarity of multivariate bankruptcy prediction models: a methodological study”, Journal of Accounting Research, 22(1): Spring, pp.380-395 (1984).
15. Meyer, Paul A.; Pifer, Howard W., “Prediction
of bank failures”, The Journal of Finance, 25(4): 853-868 (1970).
16. Merton, Robert C., “On the Pricing of
Corporate Debt: The Risk Structure of Interest
Rates”, Journal of Finance, 29(2): 449-470
(1974)
17. Ohlson, James A.., “Financial ratios and the
probabilistic prediction of bankruptcy”, Journal of Accounting Research, 18(1): Spring, pp. 109-131 (1980).
18. Scott, James., “The probability of
bankruptcy”, Journal of Banking and
Finance, 5: 317-344 (1981).
19. Shumway, Tyler., “Forecasting bankruptcy
more accurately: a simple hazard model”, Journal of Business, 74(1): 101-124 (2001).
20. Stevens, Donald L., “Financial characteristics
of merged firms: a multivariate analysis”, Journal of Financial and Quantitative Analysis, 149-158 (1973).
21. Wilcox, Jarrod W., “A simple theor y of
financial ratios as predictors of failure”. Journal of Accounting Research, Autumn, 389-395 (1971).
22. Zhang, Guoqiang; Hu, Michael Y.; Patuwo,
Eddy B.; Indro, Daniel C., “Artificial neuronal networks in bankruptcy prediction: general framework and cross validation analysis”, European Journal of Operational Research, 116: 16-32 (1999).
23. Zmijewski, Mark E., “Methodological issues