Published online January 30, 2014 (http://www.sciencepublishinggroup.com/j/ijefm) doi: 10.11648/j.ijefm.20140201.17
Growth of private commercial banks in Bangladesh
Md. Ariful Islam
1, Mahmudul Hasan Siddiqui
2, Md. Rayhan Islam
31
BASIC Bank Limited, Khulna, Bangladesh
2
Unilever Bangladesh Limited, Gulshan-1, Dhaka-1212, Bangladesh
3
Business Administration Discipline, Khulna University, Khulna-9208, Bangladesh
Email address:
arifrussell@yahoo.com (Md. A. Islam), mhs.sadi@gmail.com (M. H. Siddiqui),rayhan_07@yahoo.com (Md. Rayhan Islam)
To cite this article:
Md. Ariful Islam, Mahmudul Hasan Siddiqui, Md. Rayhan Islam. Growth of Private Commercial Banks in Bangladesh. International Journal of Economics, Finance and Management Sciences. Vol. 2, No. 1, 2014, pp.53-67. doi: 10.11648/j.ijefm.20140201.17
Abstract:
Now-a-days PCBs have succeeded to occupy a handsome portion of the total banking sector through their 23 years journey. For that matter, the study is done to verify how successfully PCBs have come across to today’s position. After liberation in 1971 all banks except few foreign banks’ branches were nationalized and reorganized. But the step of nationalization is viewed as a discouraging picture of NCBs because of some careless management activities. For that reason, PCBs had appeared in 1982 in the banking sector to improve the NCBs’ performance as well as the overall condition of the banking sector. The whole period has been segmented in to two parts and the growth of PCBs has been tried to find out according to the segments. Firstly, the denationalization and privatization period (1982-1989) and secondly, the financial liberalization period (1990-2004). We have tried to measure the growth of PCBs in the above mentioned time periods. To ascertain the PCBs’ growth we have used their branch expansion, deposit mobilization capability and credit deployment quality. With the help of these three components we can observe whether PCBs share in the total banking sector has been increased. We have also inquired that whether the performance of PCBs is better than that of NCBs. The study also covers NPL problems faced by the banks, and to what extent PCBs have recovered their NPL condition and what should be the further action to restrain the problem. Though PCBs have been playing the leading position, with the largest number of banks (30) in the banking sector, their overall performance is not as much appreciable as it should be. For that reason, PCBs should behold their full concentration to overcome their shortcomings.Keywords:
Banking, Industry, Growth, Private Commercial, Financial Institution, Growth, Performance1. Introduction
1.1. Background of the Study
Banks are known as the financial intermediaries because their basic role is to mobilize saving from the public on the one hand and to deploy one to productive investment on the other hand. Thus banks open up safe channels of savings and investment which are most vital for promoting economic growth. Without banks an economy cannot run smoothly because banks provide payment service to the economy. So not only the intermediary function, banks also enhance its activity by issuing note, holding demand deposit, honoring checks, facilitating international trade. Banks role in the development process is more prominent in developing countries than in developed countries because of dominance of the banks in the letter financial systems. So it is undoubtedly true that banks are the most influencing component of the financial structure and the
growth of the financial structure itself act as a facilitating factor in the economic transformation of a country. Financial sector of Bangladesh, like most developing countries, is dominated by banking enterprises. Currently, the banking sector of Bangladesh comprises of 4 nationalized commercial banks(NCBs), 5 government- owned specialized banks (SBs) dealing mostly with development finance in specialized sectors, 30 private commercial banks (PCBs) and 10 foreign commercial banks (FCBs).
54 Md. Ariful Islam et al.: Growth of Private Commercial Banks in Bangladesh
ownership of banks, major industries and insurance companies, which were privately owned during Pakistan period. But Bangladesh Bank ‘s Nationalization order did not specifically spell out the objectives of Nationalization due to the rapid increase in bad debt, overdue loans, irregularities in management and corruption among some of the members of the bank staff.
In the early 1980 because of the failure of NCB’s and increasing activities of the growing private sector, the need for allowing local private banks was keenly felt. This feeling became particularly strong after the disinvestment of some public sector enterprises. Accordingly govt. decided to allow the operation of local private banks and to denationalize 2 out of 6 NCBs(namely Uttara Bank & Pubali Bank) in 1982. The emergence for allowing PCBs was the desire on part of GOB(Government of Bangladesh) to the objectives of:
1. To increase the competition in the banking sector. 2. To reduce the deficit of government to meet the
continuous loss of the public enterprises.
3. To improve the operating efficiency of the banking sector.
4. To introduce competition in all spheres of economic activities.
5. To ensure the flow of credit to different economic sectors including the priority sectors.
6. To improve the customer service of the bank.
7. To run forward to the way of globalization of the financial sector.
Initially 5 banks were set up in private sector in 1982. With the setting up of a number of subsequent banks in this sector, the number of PCBs has stood up at 30 including 2 denationalized commercial banks as on March, 2005. On the basis of the above background, we can draw the following objectives of the study.
1.2. Objectives of the Study
The vital objective of the study is to recognize and scrutinize the growth of PCBs in Bangladesh. This specific objective is the examination of the following pertinent objectives:
• To examine the growth of PCBs in regard to branch expansion.
• To identify the growth of PCBs in regard to deposit mobilization.
• To evaluate the growth of PCBs in regard to credit deployment.
• To assess the growth of PCBs in regard to credit deposit ratio.
• To ascertain the trend of productivity and profitability of PCBs.
• To compare the growth of PCBs in regard to NCBs.
1.3. Methodology of the Study
The methodologies which have been chosen for this study cover the reference period, number of banks, sources
of data, and technique of analysis are delineated below – Reference period: Since the introduction of PCBs have been introduced in our country in1983 so the reference period of the study is from the year 1983 to the year 2004. We can divide the whole period into two distinct sub groups to fulfill the objectives of the study : (1) Denationalization and Privatization Period from the year 1983 to1989, (2): Financial Liberalization Period initiated by the “Financial Sector Reform Project” (FSRP) in the year 1990.This period is considered up to the year 2004 for this particular study. The various data related to the study are used in this study are taken as on the month of June of each year. This is done in order to maintain the chronological order of data and consistency in the study.
Number of Banks: There are 30 PCBs (including 2 denationalization commercial banks and 5 Islamic banks) in our country. In this study all the PCBs have been covered.
Sources of data: As the nature of the study dictates, the secondary sources of data (I.e., the published data) have been used here. Hence, there is no need to collect any type of primary data or raw data. A good number of sources of secondary data are used to meet the purposes of the present research work. The sources included: Bangladesh Bank Bulletin, Scheduled Bank Statistics, Economic Trend published by Bangladesh Bank, various publications of the Ministry of Finance (MOF), and different books, articles and seminar papers of home and abroad. Exact sources of data are cited in the footnotes of each table.
Data analysis: for accurate analyses of data several type of ratios have been used. To analyze the trend of commercial banks in terms of branch expansion, deposit mobilization, credit deployment, the trend lines (showing the relationship of the above variable with time) have been fitted.
The trend equation is:
Y’=a + bX
Where,
Y’ (read as Y prime) = Dependent variable (e.g., branch expansion, deposit mobilization, credit deployment)
X =The independent variable (time).
a = The Y-intercept. It is estimated as the value of Y when T=0
b = The slope of the line
The computer software named “MS-EXCEL 2000 “is used to draw the trend equation and relevant charts. Ratios such as “Deposit credit Ratio”, “Productivity Ratio” etc. have been used as shown below:
Deposit credit Ratio
DCR = Total Deposit /Total Credit
Productivity Ratio (Expenditure-Income Ratio) EI Ratio =Total Expenditure/Total Income
Annual Growth Rate”
Compound Annual Growth Rate = 1
Where, Tn= Current year value
To = Base year value
n = Number of years
By using these statistical tools the collected data have been analyzed and in some cases the approximate result is obtained because of some limitation.
1.4. Limitations of the Study
Any research work needs high degree of involvement regarding collection of information, creation of database and analysis of data. In this study, it has been tried to collect the related information and analyze the data being with the following limitations:
1. Inadequate logistics such as limited access to the information regarding various aspects of the banking system acts as a great hindrancefor the completion of the study.
2. The depth of the analysis the study has been limited to the extent of information collected from different sources.
3. In spite of taking proper care to collect necessary information and prepare this paper, some pitfalls might be there.
1.5.Organization of the Study
The research paper is divided into 5 chapters. The 1st chapter is the introduction of the study. This chapter is composed of the background of the study, objectives of the study, methodology of the study, and limitations of the study. Background of the study has focused on the role of banks in the financial sector, banking system before and after liberation and the adoption of denationalization and privatization in the banking sector. On the basis of the background the objective of ascertain the growth of PCBs in Bangladesh, has been drawn. To explain the objectives the methodologies which have been selected is stated in the methodology part, And at the end of the introduction chapter the limitations that have been faced is described in the limitation part of the study.
The analytical part of the study starts with the 2nd chapter which has dealt with the growth of PCBs in Bangladesh in regard to their branch expansion, deposit mobilization, credit deployment, credit deposit ratio, and productivity and profitability.
In our financial sector NCBs share is still very substantial, so a comparative analysis has been done between NCBs and PCBs in the 3rd chapter.
Finally the findings of the study have been summarized in the 4th chapter and from which the conclusions and recommendations have also been drawn.
2. Growth of PCBS in Bangaladesh
We know that the denationalization and privatization
process started in the commercial banking sector of Bangladesh since 1983. In that year two nationalized commercial banks (NCBs), namely Uttara Bank and Pubali Bank were denationalized and transferred to private ownership and five private commercial banks (PCBs), namely
1.National Bank Bangladesh Ltd, 2.The City Bank Ltd,
3.United Commercial Bank Ltd, 4.Islami Bank Bangladesh Ltd,
5.International Finance, Investment and Commerce Bank Ltd, were licensed to operate in the banking sector of Bangladesh and that is why this study is focusing on the period of denationalization and privatization. The development of PCBs in our country has been broadly discussed under two heads: Geographical coverage and functional coverage. In the Geographical coverage, expansion of branches and in the functional coverage, deposit mobilization and deployment of credit by the commercial banks are included.
2.1. Expansion of Branches
2.1.1. Trend Equation of Branch Expansion
To reach closer to the people as rapidly as possible, the extension of the geographical coverage of commercial banks through opening more and more branches is compulsory. For this purpose a number of branches have been opened in both urban and rural areas. In the year 1984, 628 branches of PCBs were in operation which has become 1494 in 2004. The denationalization and privatization period is demonstrating that the branches expanded with a sluggish scale by 199 branches. In the financial linearization period, the number stood at 1160 at the end of 1990s and lastly at 1494 in 2004. To examine how far the PCB’s has expanded its branches, the trend equation has been used.
B=a + bT
This equation showing the relationship between branch expansion (B) as the dependent variable and time(T) as the independent variable.
Another two variables (a) , the estimated value of B when T=0 or the estimated value of B where the regression line crosses the B-axis when T is zero and (b), the slop of the line, or the average change in B for each change of one unit in the independent variable T. The calculated value of “a” is 389.74 and “b” is 49.82. So the regression equation of branch expansion is,
B=389.74+49.82(T)
Table2.1.1. Trend Equation of Branch Expansion of PCBs in Bangladesh
Year B Year B
56 Md. Ariful Islam
Year B Year
1987 637.3552 1998 1988 687.3145 1999 1989 737.2739 2000 1990 787.2332 2001 1991 837.1925 2002 1992 887.1519 2003 1993 937.1112 2004
Source: Appendix Table 1
Chart2.1.1. Trend Equation of Branch Expansion of PCBs in Bangladesh(Sources: Table: 2.1.1)
So from the table and chart of Trend Equation of Branch Expansion we can see a positive correlation between time and PCBs branches, i.e., with the passage of time the PCBs operating in our country have extended their branches increasingly.
2.1.2. Area wise Branch Expansion
Not only branch expansion in the urban areas but also in the rural areas should be evaluated for measuring t
success in branch expansion, since the overwhelming proportion of the country’s population lives in the rural areas. The growth rate of rural and urban branches from 1983 to 2003 is 24.26 percent. But if we want to observe the proportion between urban and rural branches of PCBs, then we will find 60: 40 percent in the years 1985.
The following table shows the PCBs contribution in terms of branch expansion in urban and rural areas.
Table 2.1.2. Area wise Branch Expansion of PCBs
YEA R
PCBs
URBA N
%of total Branches RURA L % of total Branches
1983 12 0.2607 0 0 1984 46 0.95 0 0 1985 380 7.66 252 5.08 1986 409 8.00 256 5.01 1987 448 8.58 240 4.59 1988 482 9.02 251 4.70 1989 516 9.47 269 4.93 1990 545 9.84 282 5.09 1991 580 10.32 296 5.27 1992 N.A. N.A N.A. N.A. 1993 N.A. N.A N.A. N.A. 1994 N.A. N.A N.A. N.A. 1995 N.A. N.A N.A. N.A.
Md. Ariful Islam et al.: Growth of Private Commercial Banks in Bangladesh
B 1186.908 1236.867 1286.827 1336.786 1386.745 1436.705 1486.664
Trend Equation of Branch Expansion of PCBs in
table and chart of Trend Equation of Branch Expansion we can see a positive correlation between time hes, i.e., with the passage of time the PCBs operating in our country have extended their branches
Not only branch expansion in the urban areas but also in the rural areas should be evaluated for measuring the PCBs success in branch expansion, since the overwhelming proportion of the country’s population lives in the rural areas. The growth rate of rural and urban branches from But if we want to observe ban and rural branches of PCBs, then we will find 60: 40 percent in the years 1985.
The following table shows the PCBs contribution in terms of branch expansion in urban and rural areas.
Area wise Branch Expansion of PCBs
TOTAL BRANCHE S % of total Branches
0 4603 0 4817 5.08 4963 5.01 5114 4.59 5224 4.70 5345 4.93 5451 5.09 5539 5.27 5621 N.A. 5656 N.A. 5740 N.A. 5792 N.A. 5813
YEA R
PCBs
URBA N
%of total Branches
1996 758 12.90 1997 776 13.13 1998 821 13.79 1999 849 14.19 2000 913 15.08 2001 959 15.58 2002 1011 16.10 2003 1054 16.86 2004 1108 17.77
Sources: Appendix Table 2
The table indicates that in the begi
denationalization and privatization period the PCBs branch expansion growth rate was very low and there was no branches in the rural areas after permitting private banking in the first two years. With the passage of time the percentage share of PCBs in both rural and urban areas started to increase and within the beginning of financial liberalization period it stood 65: 35 percent. And finally the proportion has become wider and has stood 74: 26 percent in 2004. The urban to rural proportion is sho
negligible concentration in the rural areas as the rural areas’ share of PCBs branches has decreased gradually
2.1.3. Growth Rate of Branch Expansion
To find out the growth rate we have used the formula of Compound Annual Growth Rate, which measu average annual percent increase of economic data from one period to another.
Table 2.1.3.Growth Rate o
Time Period
Branches At the Beginning Period
Branches at the End Period
1984-1988 628 1989-1993 785 1994-1998 971 1999-2004 1160
Sources: Appendix Table 1
(Here the base year is considered 1984 instead
actual figure of number of branches was not found for the year 1983)
Chart 2.1.3. Growth Rate of PCBs Branches n Bangladesh PCBs TOTAL BRANCHE S RURA L % of total Branches
321 5.46 5874 319 5.40 5911 312 5.24 5952 311 5.20 5982 318 5.25 6056 337 5.47 6156 335 5.34 6278 369 5.90 6253 386 6.19 6236
The table indicates that in the beginning of denationalization and privatization period the PCBs branch expansion growth rate was very low and there was no branches in the rural areas after permitting private banking in the first two years. With the passage of time the Bs in both rural and urban areas started to increase and within the beginning of financial liberalization period it stood 65: 35 percent. And finally the proportion has become wider and has stood 74: 26 percent in 2004. The urban to rural proportion is showing the negligible concentration in the rural areas as the rural areas’ share of PCBs branches has decreased gradually.
Growth Rate of Branch Expansion
To find out the growth rate we have used the formula of Compound Annual Growth Rate, which measures the average annual percent increase of economic data from one
Growth Rate of PCBs Branches
Branches at the End Period
No. Of Year(n)
Growth Rate(%)
733 5 3.140 943 5 3.736 1133 5 3.134 1494 6 4.316
considered 1984 instead of 1983 because of the number of branches was not found for the year 1983)
So the chart 2.1.4 is showing a smooth upward trend over the period of 1984-2004. It is in the range of 3 to 4.5 percent. The stability shows a better correlation between time and branch expansion and sustainable position in the banking sector.
2.2. Deposit Mobilization of PCBs
The geographical coverage indicates the extent of bank branches through which banks can provide their services, but what services they are providing, are stated through the functional coverage of banking sector. Commercial banks, should regulate their activities, i.e., geographical and functional coverage, in such a way so as to serve the objectives of economic development of the country concerned. The expansion of branches also led to the mobilization of greater volume of deposit. Deposits are the main sources of funds for the commercial banks. As all other activities of the banks are mainly dependent on the quantum of deposits, it can be referred to as the lubricant that turns the wheels of the banking industry. Growth of deposit with the banking system in any country is a welcome phenomenon. It is particularly more important in a capital scarce country because of the existence of imbalance between the availability of funds and the demand for such funds. Our first attempt to find out the growth of PCBs’ deposit mobilization by using the trend equation, but before that at a glance the situation of PCBs deposit mobilization should demonstrate.
PCBs were able to mobilize their deposit only by 1.39 percent of total deposit mobilization in the initial stage of denationalization and privatization period. They recovered the poor condition very swiftly and reached 26.99 percent of total deposit mobilization at the beginning of financial liberalization period. At present it is giving a much better position with a 42.86 percent of total deposit mobilization in the year 2004.
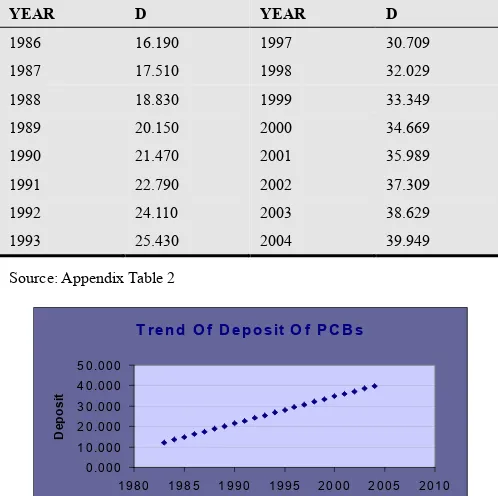
2.2.1. Trend Equation of Deposit Mobilization
The table 2.2.1 shows the trend equation of deposits mobilized by the PCBs during the period of 1983-2004. Like all trend equation of branch expansion, this trend equation is also having positive slope, which has been found statistically significant. The figures in the table have been found by calculating the amount of deposit mobilized by PCBs over the said period. Here “a” has been found 10.9098 and “b” is 1.3199. And deposit mobilization has been treated as the dependent variable denoted by “D” and the equation stands:
D=10.9098+1.3199(T)
Table 2.2.1. Trend Equation of Deposit Mobilization by PCBs
YEAR D YEAR D
1983 12.230 1994 26.750 1984 13.550 1995 28.070 1985 14.870 1996 29.389
YEAR D YEAR D
1986 16.190 1997 30.709 1987 17.510 1998 32.029
1988 18.830 1999 33.349 1989 20.150 2000 34.669 1990 21.470 2001 35.989 1991 22.790 2002 37.309
1992 24.110 2003 38.629 1993 25.430 2004 39.949
Source: Appendix Table 2
Graph 2.2.1. Trend Equation of Deposit Mobilization by PCBs. Sources: Table 2.2.1.
So it is very natural that with the expansion of time trend line will also be upward linear trend, but in order to ascertain how much growth it has attained, we need to find out the growth rate of deposit mobilized by the PCBs within the said period of time
2.2.2. Growth Rate of Deposit Mobilization
Here also we will take the formula of “Compound Annual Growth Rate” to measure the growth rate of deposit collected by PCBs over the period of 1984-2004.
In the year 1983-1986 the growth was extremely high with 93.78 percent just because of the high expansion of deposit mobilization to the year of privatization. But after that deposit collection rate slowed down and started to increase 1 percent to 2 percent up to the year 1991.
Table 2.2.2.Growth Rate of Deposit Mobilization
Time Period
Deposit Value of Beginning Period
Deposit Value Of End Period
No. of Year
Growth Rate(%)
1984-1986 6.24 19.6 4 93.78
1987-1989 20.93 24.51 3 5.349
1990-1992 25.66 25.63 3 -0.039
1993-1995 28.23 27.93 3 -0.352
1996-1998 27.83 27.98 3 0.178
1999-2001 29.01 33.6 3 4.967
2002-2004 36.8 42.86 3 5.159
Sources:Appendix Table 2
T re n d O f D e p o s it O f P C B s
0 .0 0 0 1 0 .0 0 0 2 0 .0 0 0 3 0 .0 0 0 4 0 .0 0 0 5 0 .0 0 0
1 9 8 0 1 9 8 5 1 9 9 0 1 9 9 5 2 0 0 0 2 0 0 5 2 0 1 0
Ye a r
D
e
p
o
s
58 Md. Ariful Islam et al.: Growth of Private Commercial Banks in Bangladesh
Chart 2.2.2. Growth Rate of Deposit Mobilization. Sources: Table 2.2.2
A negative trend has been observed from the year 1992 to 1996 and growth rate were -.039 and -.352 percent respectively in those two years. PCBs deposit mobilization capability improved with a low rate, 0.178 in the year 1999, just after the recession and tended to increase again and achieved a stable positive trend.
2.2.3. Area Wise Mobilization of Deposit
How far and how effectively the functional coverage of the commercial banks are spread geographically over time,
should be a subject matter of the performance of a commercial banking system. The table 2.2.3 presents the area wise percentage distribution of deposit mobilization by PCBs in Bangladesh. It reveals that both the share of rural deposits and its rate of growth over time were very poor. The percentage share of urban deposit in total deposit was 1.39% in1983, went up to 20.89% in 1988 and then reached 24.60% in 1993 and stayed almost stable till 2000. From the year 2001 the increasing trend was noticed and finally in 2004 the percentage of urban deposit mobilization by PCBs reached at 39.14 of total deposit of the banking sector.
In the context of share of rural branches in total number of branches, the percentage share of the rural deposit in the total deposit seems to be very low. The critical factor(among many others such as lower level of rural income, lack of availability of appropriate assets to rural savers etc.) for the very low level of rural deposits in is the lack of motivation on the part of the rural bankers. If they can be motivated properly then the growth rate of deposit in the rural sector of PCBs can also be improved within the given constraints.
Table2.2.3. Rural-Urban distribution of Deposit of PCBs
YEAR URBAN (Amount in lacs of TK)
% of Total Deposit Mobilization
RURAL(Amount in lacs of TK)
% of Total Deposit
Mobilization TOTAL
1983 70.72 1.39 0 0 5098
1984 446.09 6.23 0 0 7158.4
1985 1596.16 17.06 49.37 0.53 9356.32
1986 2072.54 18.81 86.36 0.78 11016.64
1987 2556.05 19.26 222.26 1.67 13274.16
1988 3261.5 20.89 322.57 2.07 15614.65
1989 3891.62 21.51 375.28 2.07 18091.08
1990 4641.68 22.79 405.56 1.99 20367.1
1991 5528.12 24.23 524.22 2.30 22818.02
1992 5992.19 22.89 603.14 2.30 26181.57
1993 7366.88 24.60 709.19 2.37 29945.35
1994 9390.04 25.51 937.58 2.55 36815.63
1995 9707.23 24.94 980.98 2.52 38924.12
1996 10342.59 24.66 1050.32 2.50 41941.17
1997 11549.63 24.48 1171.18 2.48 47189.36
1998 12564.86 24.16 1330.74 2.56 52004.51
1999 14663.81 24.86 1580.6 2.68 58994.12
2000 17606.98 24.81 1749.25 2.46 70981.25
2001 24819.63 30.40 1792.6 2.20 81650.02
2002 30554.58 32.82 2224.37 2.39 93084.14
2003 38684.73 36.02 2844.9 2.65 107406.8
2004 47579.41 39.14 3463.76 2.85 121576.1
Sources: Appendix Table 4
Chart2.2.3. Rural-Urban distribution of Deposit. Sources: Table 2.2.3.
As the table and chart shows that the share of PCBs in rural deposit is less than 3 percent from the period of privatization and denationalization till 2004. This almost fixed growth rate is an indication that very little concentration has been given to the rural areas for deposit mobilization by the PCBs. And from the table 2.2.4 we can also come to the conclusion that the urban-rural proportion of deposit mobilized by PCBs demonstrated a high deviation between them.
Growth Rate Of Deposit Deployment
-10.000 0.000 10.000 20.000 30.000 40.000 50.000
1984-1986
1987-1989
1990-1992
1993-1995
1996-1998
1999-2001
2002-2004
Year
D
e
p
o
s
it
Rural-Urban Deposit Distrbution
0.00 10.00 20.00 30.00 40.00 50.00
19
83
19
85
19
87
19
89
19
91
19
93
19
95
19
97
19
99
20
01
20
03
Year
P
e
rc
e
n
ta
g
e
o
f
T
o
ta
l
D
e
p
o
s
it
Table2.2.4. Proportionate Urban-Rural Deposit Mobilization by PCBs
YEAR URBAN-RURAL YEAR URBAN-RURAL
1983 0 1994 1001.52
1984 0 1995 989.54
1985 3233.06 1996 984.71
1986 2399.88 1997 986.15
1987 1150.03 1998 944.20
1988 1011.10 1999 927.74
1989 1036.99 2000 1006.54
1990 1144.51 2001 1384.56
1991 1054.54 2002 1373.63
1992 993.50 2003 1359.79
1993 1038.77 2004 1373.63
Sources: Appendix Table 4
The above table shows that the urban sector’s deposit mobilization is on an average 1000 times than rural sectors. That is, for one Taka deposit mobilization from rural area, the PCBs are mobilizing on an average TK.1000 from the urban area. Since a mentionable proportion of the country’s people is living in the rural sector, so PCBs should give more attention in the rural deposit collection.
2.3. Growth of Credit Deployment by PCBs
Another important primary function of a commercial bank is to extend credit to the deficit economic units that comprises borrowers of all types. Bank credit is a catalyst of economic development. Without adequate finance, there can be no growth in the economy. Bank lending is important for the economy in the sense that it can simultaneously finance all the sector and sub-sectors of economic arena, which comprises agricultural, commercial and industrial activities of a nation. Therefore, a bank is supposed to distribute its loanable fund among economic agent-in-deficit in a manner that it will generate sufficient income for it and at the same time benefits the borrower to overcome his/her deficit. Banks used to lend in two ways- discounting and purchasing of bills and advances.
Hence, Bank credit can be classified in two broad categories-
1. Advances
2. Bills discounted and purchased.
So the growth of credit deployment by PCBs will give us an indication for ascertaining the growth of PCBs.
2.3.1. Generation Wise Growth of Credit Deployment
Since our study is to find out the growth of PCBs so we will focus on the period from the inspection of private banking to till now. The whole time period can be discussed under two segments:
From The Period of Denationalization and Privatization
to Financial Liberalization (1982-1989):
In the beginning of the above mentioned period(1982) the NCBs role was very much dominant as the private banking had just started its journey. In the year 1983 NCBs, SBs, PCBs and FCBs credit deployment position were 69.50, 24.8, 0.60 and 5.0 percent respectively of the total credit deployment. But NCBs proportionate share decreased as PCBs started to penetrate in the market. As a result at the end of this period (1989), the credit situation stood at 51.55, 21.65, 20.16 and 6.64 percent respectively. In this period both the NCBs and SBs growth rate declined (-23.93%) and (-2.59%) while PCBs and FCBs growth rate increased by 64.94% and 2.96% respectively. Though PCBs were able to create its own place in the market but the decreasing trend of NCBs appear to provide that the intentions of denationalization and privatization to improve NCBs conditions in term of improving credit quality, were not successful.
From the Inception of Financial Liberalization till Today (1990-2004):
During (90-2004), PCBs market share was increased as a result of liberalization. PCBs and FCBs attracted the customers through their efficient services; however, FCBs market share is almost constant over the years. NCBs share was around 50% up to 1999. SBs market share declined as the directed lending was stopped. In June 2004 market share of NCB, SB, and FCB were 37.05%, 9.81%, and 6.81% respectively and with the leading position of PCBs of 46.33% . The credit deployment by all banks on the basis of their ownership over the period of 1983-2004 has been drawn in the chart 2.3.1.
Chart2.3.1. Credit deployment by all banks. Sources: Appendix Table-3
2.3.2. Trend Equation of Credit Deployment of PCBs
Like the branches and deposit, the trend equation also has been used here to demonstrate the positive correlation between time and credit deployment by PCBs.
Trend Equation: C= a + b(T)
Where, C = Credit, the independent variable a = Intercept, the calculated value is 5.866 b = The slope of the line, is 1.607
So the equation stands:
C = 5.866 + 1.607(T) Credit Deployment By Banks
0.00 20.00 40.00 60.00 80.00
1 3 5 7 9 11 13 15 17 19 21
Time Period
C
re
d
it
60 Md. Ariful Islam et al.: Growth of Private Commercial Banks in Bangladesh
Table2.3.2.Trend Equation of Credit Deployment Of PCBs
Year C Year C
1983 7.47 1994 25.16 1984 9.08 1995 26.77 1985 10.69 1996 28.37 1986 12.30 1997 29.98 1987 13.90 1998 31.59 1988 15.51 1999 33.20 1989 17.12 2000 34.80 1990 18.73 2001 36.41 1991 20.33 2002 38.02 1992 21.94 2003 39.63 1993 23.55 2004 41.23
Source: Appendix Table 3
Chart 2.3.2.Trend Equation of Credit Deployment Of PCBs. Source: Table 2.3.2
2.3.3. Area Wise Credit Deployment
Again how far the PCBs have expanded their credit area wise will be another indetermination to examine the growth of PCBs.
Table 2.3.3. Area Wise Credit Deployment
YEAR
PCB’s CREDIT
URBAN %of total
Credit RURAL
%of total Credit
1983 31.95 0.64 0 0 1984 273.81 5.46 0 0 1985 1010.50 11.31 87.87 0.98 1986 2050.96 18.82 109.95 1.01 1987 1886.75 15.96 78.61 0.66 1988 2507.57 17.99 98.17 0.70 1989 3163.66 18.96 166.51 1.00 1990 3817.24 19.17 246.1 1.24 1991 4559.12 21.32 148.66 0.70 1992 5351.24 22.24 124.26 0.52 1993 6578.70 24.04 134.86 0.49 1994 7524.97 24.16 193.94 0.62 1995 8055.00 23.75 188.69 0.56 1996 1880.44 5.06 205.36 0.55 1997 10052.33 24.07 230.16 0.55 1998 1773.34 3.70 247.36 0.52 1999 13682.47 25.35 308.26 0.57 2000 15848.51 26.70 354.67 0.60 2001 22484.11 32.69 358.32 0.52 2002 27328.37 35.60 526.16 0.69 2003 32618.64 38.50 727.99 0.86 2004 39377.24 41.39 920.43 0.97
Sources: Appendix Table 6
Chart 2.3.3. Area Wise Credit Deployment. Source: Table 2.3.3
As a whole, chart 2.3.3 shows the overall trend of urban-rural deployment of credit by the PCBs. It reveals that proportion of urban credit was always higher than that of rural credit. But in the year 85-86 both the proportion of urban and rural credit was in an increasing trend. But after 1990, the proportion of rural credit stared declining as a result of deregulation and liberalization. So, it can be concluded that withdrawal of credit control encourages banks not to go for rural financing.
As in deposit, in case of credit deployment also it has been observed that a very high deviation exists between urban and rural credit deployment PCBs, which indicates that the most of the credit of PCBs are being deployed in the urban areas.
2.4. NPL Problem in PCBs and Recent Action toward the NPL Problem
The most important indicator of loan quality is the non-performing loan, higher the proportion of NPL, lower the quality of loan management in the bank. In this study, the percentage of gross and net non-performing loans (NPLs) to the total assets and total advances have been considered. Though the volume of NPL of the PCBs has reduced in the recent years, still this is the biggest problem at this moment not only for the PCBs but also for the whole banking system. As per Bangladesh Bank Annual Report 2003-2004, FCBs have the lowest proportion, while DFIs have the highest one (38.4%),followed by NCBs(28.3%). PCBs condition is much better than the other state owned banks with a 8.3% NPL to the total loans. The following table 2.4 has demonstrated the NPL picture of different types of banks in Bangladesh.
Table 2.4. Ratio of NPL to Total Loans By Type Of Banks
Bank
Type 1997 1998 1999 2000 2001 2002 2003
NCBs 31.4 35.6 41.3 34.1 32.8 30.1 28.3
DFIs 57.0 59.1 58.5 54.6 54.5 48.0 38.4
PCBs 25.1 26.3 21.2 15.5 10.5 10.5 8.3
FCBs -0.5 0.1 0.9 -0.1 -0.3 -0.4 0.0
TOTAL 30.7 34.4 35.6 28.8 28.8 22.6 18.8
Sources: Bangladesh Bank Annual Report 2003-2004
Trend Of Credit Of PCBs
0 10 20 30 40 50
1980 1985 1990 1995 2000 2005 2010
Year
C
re
d
it
Area Wise Credit Deployment By PCBs
0.00 10.00 20.00 30.00 40.00 50.00
1 3 5 7 9 11 13 15 17 19 21
Time Period
C
re
d
it
The ratio of non-performing loans to total loans of all banks show an improving trend. In case of PCBs, the ratio of NPL has been continuously decreasing over the year and if they are able to maintain this trend then it will be a new dimension for the PCBs.
Chart 2.4. Ratio of NPL to Total Loans by Type of Banks. Source: Table:2.4
Recent Actiontowardsthe NPL Problems
The CPD Task Force (2003) has suggested the following actions to be taken in order to address the NPL problems.
Careful and strict vigilance must be maintained so that no loan is turned bad or default. Toward this end, the total loan process (sanction, monitor and recovery) is to be made more balanced, effective and free from all sorts of influence.
For effective implementation of the new Money Loan Court Act, all concerned parties specially bank officers and authorities must be initiating best possible efforts.
At the initiative of bank authorities, compromise settlements may be tried outside the jurisdiction of Money Loan Court Act – 2002.
No loan should be rescheduled for more than two times.
Credit risk management should not be confined only to loan disbursement through lending risk analysis. It should be extended to loan monitoring and finally to recovery.
Debt Collection unit should be reorganized as loan work out unit or each bank may establish loan work out department for managing the problem loans. Each bank is required to formulate a specific loan recovery policy as a part of its credit policy.
The formation of Asset Management Company may be considered for overcoming loan default problem.
2.5. Trend of Profitability and Productivity of PCBs
Profit and profitability are two separate concepts. The former indicates absolute measurement while the latter indicates relative measurement that is profit in relation to some other variable. In commercial banks, as in other cases, the profit is defined as the difference between total income
and total expenditure. Income and expenditure sources of the commercial banks may be grouped under two heads: (a) interest and (b) non-interest sources. In the terminology of commercial banking, the difference between interest income and interest expenditure is known as ‘spread’ and the difference between interest expenditure and non-interest income is known as ‘burden’.
Therefore, alternatively, profit is also defined as the difference between ‘spread’ and ‘burden’. In common parlance, productivity refers to the output per unit of input employed. The measurement of productivity in a service industry like commercial banks is very difficult, because identification and separation of input and output is not easy in the commercial banks. Therefore two things must be carefully observed: first, input and output must represent total banking activity and second, both of them must be financial in nature.
Although there are various measure of profitability, the
best and widely used measure is return
onassets(ROA) ,which is supplemented by return on equity (ROE).
2.5.1. Return on Assets(ROA) and Return on Equity(ROE)
Table 2.5.1 and 2.5.2 show ROA and ROE and chart 2.5.1 shows the aggregate position of these two indicators for all banks which reveal that the PCBs had an inconsistent trend.
Table 2.5.1. Return on assets(ROA)
Year NCBs DFIs PCBs FCBs Total
1997 0 -2.1 1.1 4.8 0.3
1998 0 -2.8 1.2 4.7 0.3
1999 0 -1.6 0.8 3.5 0.2
2000 0.1 -3.7 0.8 2.7 0
2001 0.1 0.7 1.1 2.8 0.7
2002 0.1 0.3 0.8 2.4 0.5
2003 0.1 0 0.7 2.6 0.5
Sources: Bangladesh Bank Annual Report 2003-2004
Table 2.5.2.Return on Equity(ROE)
Year NCBs DFIs PCBs FCBs Total
1997 1.3 -29.1 24.4 38.2 7
1998 0.3 -36.3 26.8 40.7 6.6
1999 -1.1 -29.4 15.3 41.8 5.2
2000 1.7 -68 17 27.3 0.3
2001 2.4 12.3 20.9 32.4 15.9
2002 4.2 5.8 13.6 21.5 11.6
2003 3 -0.6 11.4 20.4 9.8
Sources: Bangladesh Bank Annual Report 2003-2004
Comparative Position Of NPLs By Types Of Banks
-10 0 10 20 30 40 50 60 70
1996 1998 2000 2002 2004
Year
B
il
li
o
n
T
a
k
a
62 Md. Ariful Islam et al.: Growth of Private Commercial Banks in Bangladesh
Chart 2.5.1. Aggregate Profitability of All Banks. Source: Table:2.5.1 and 2.5.2
Earnings as measured by return on assets (ROA) and return on equity (ROE) vary largely within the industry. Table 2.5.1and 2.5.2 and chart 2.5.1 show the aggregate position of these two indicators for all banks in which we can notice the PCBs portion is much better than NCBs and DFIs in both cases.
2.5.2. Productivity
To measure the productivity, we have used the Expenditure-Income (EI)ratio which indicates the soundness of bank’s management. Generally a high and increasing expenditure to income ratio indicates the operating inefficiency that could be due to weaknesses in management. The table 2.5.3 demonstrates the EI ratio of all banks;
Table 2.5.3. Expenditure- Income Ratio by All Banks
YEAR NCBs DFIs PCBs FCBs
1998 99.8 180.4 85.3 60.1 1999 100.5 145.2 90.4 67.4 2000 99.4 175.3 90.8 77.7
2001 99.0 89.1 88.1 75.7 2002 98.5 95.9 91.9 78.3 2003 98.8 101.1 93.1 80.3
Source: Bangladesh Bank Annual Report 2003-2004
Chart 2.5.3.Expenditure- Income Ratio by All Banks. Source: Table 2.5.3
From the above information we can observe the PCBs expenditure to income ratio is showing an increasing trend from last few years, i.e., the manage quality has been deteriorated from the year 1996 to 2003.
3. Comparative Performance Analysis
between PCBS and NCBS
Our banking financial institutions can be divided into 2 subgroups, namely (1) commercial banks and (2) specialized banks. Among the commercial banks there are another 3 groups (a) nationalized commercial banks, (b) private commercial banks, (c) foreign commercial banks. Currently, the banking sector of Bangladesh comprises of 4 nationalized commercial banks (NCBs), 5 government-owned specialized banks (SBs) dealing with development finance in specialized sectors, 30 private commercial banks (PCBs) and 10 foreign commercial banks (FCBs). The structure of the banking sector according to Bangladesh Bank Annual Report 2003-2004 is:
Table 3. Banking Structure in Bangladesh.
Type of
Schedule Banks NCBs PCBs FCBs SBs Total
2003-2004 4 30 10 5 49
Source: Bangladesh Bank Annual Report 2003-2004
Chart 3. Banking Structure in Bangladesh. Source: Table 3
PCBs cannot alone ensure the efficiency of the overall banking system. The intention behind the denationalization and privatization was to create competition in the banking sector, especially to encourage NCBs. According to Bangladesh Bank Annual Report 2003-04, the share of NCBs in total deposits and loans are 41.7 and 40 percent respectively. As on December-2003, the capital of NCBs was only 4.3 percent of risk weighted assets and classified loan was around 29 percent. While the PCBs position was 9.7 and 16.4 percent respectively. A comparative analysis between NCBs and PCBs have been done to examine and verify whether the allowing of denationalization and privatization was really worthwhile in order to improve the performance of NCBs.
Aggregate Profitability of All Banks
-80 -60 -40 -20 0 20 40 60
1996 1998 2000 2002 2004
Ye ar
NCBs ROA NCBs ROE DFIs ROA DFIs ROE PCB ROA
PCB ROE FCBs ROA FCBs ROE
Expenditure-Income Ratio By All Banks
0
50
100
150
200
1996
1998
2000
2002
2004
Year
P
e
rc
e
n
t
NCBs DFIs PCBs FCBs
BANKING SECTOR OF BANGLADESH
2003-2004
3.1. Comparison on the Basis of Bank Branches
First of all we have made an attempt to compare the performance of NCBs and PCBs covering their branch expansion. According to Schedule Banks Statistics (April – June, 2004) total 6236 branches were in operation in which the area wise distribution of NCBs and PCBs are shown in the table 3.1.
Table 3.1.1. Branches in Operation
Year
NCBs PCBs
Urban Rural Sub Total
%of Total
Branches Urban Rural Sub Total
%of Total Branches
2003 1223 2146 3397 54.28 1141 369 1510 24.13 2004 1243 2145 3388 54.33 1108 386 1494 23.96
Sources: Appendix Table 2
From the above data we can see that the NCBs share of total branches increased very slightly only by .05% where PCBs share decreased by .17 % during 2003-2004.
Chart 3.1.1.Branches in Operation. Source: Table 3.1.1
The table and graph show the number of branches for the different types of banks. The table indicates that there are a large number of branches operating under NCBs and PCBs branch network is limited in comparison to NCBs. Specially in the rural sector PCBs branch contribution (6.19%) is very few whereas NCBs branches occupy the highest percentage of the total branch operation(34.40%) in the rural sector in the year 2004.
3.2. Comparison on the Basis of Deposit
Banks’ one of the main work is to collect deposits. With the expansion of bank branches the deposits of the nationalized commercial banks also grew at an increasing rate. The basic objective of banks nationalization in 1972 or for that matter of NCBs was to mobilize rural savings through the expansion of bank branches.
But we see that PCBs in Bangladesh have established their branches basically in urban areas and collect deposits from the people of the town.
The various kinds of deposits are mobilized by both the NCBs and PCBs can be categorized as fixed deposit, short-
term deposit, long term deposit etc. Both NCBs and PCBs work as intermediary to collect deposits and lend it to the clients.
Table 3.2.1. Deposits distributed by different category of banks: (in Billion Taka)
Time NCBs %of total
deposit PCBs
%of total deposit
December,
2003 516.65 48.10 415.30 38.67 December,
2004 545.56 44.87 510.43 41.98
Source: Scheduled Bank Statistics April-June, 2004
Of the total deposits of TK. 121576.11 crores, the shares of NCBs was TK. 54556.19 crores and that of PCBs was TK. 51043.17 crores in 2004. The PCB’s percentage of total deposits increased by 3.31% but in case of NCBs the rate of deposit mobilization decreased by 3.23 percent in 2004 over the previous year.
Graph 3.2.1. Deposits Distributed by PCBs and NCBs.Source: Appendix Table 4
So we see that, PCBs mobilization of deposit is greater than that of NCBs. The reason is that PCBs in Bangladesh offer attractive interest rate to their clients for more deposits and we also see that, many PCBs in Bangladesh have started Bank Marketing Program by their employee to collect deposits but the NCBs in Bangladesh have not started this type of program.
4. Findings, Conclusions and
Recommendations
The banking system of our country is comprised of four types of schedule banks, namely, nationalized Commercial banks(NCBs), government-owned development financing institutions(DFIs), private commercial banks(PCBs) and foreign commercial banks(FCBs). Private commercial banks are playing most significant role in the banking sector through its geographical and functional coverage. There is no disagreement that the performance of the commercial banks of a country should be judged in the context of the objectives of development and the socio-economic conditions prevailing in that country.
0 1000 2000 3000 4000
N
O
.
O
F
B
R
A
N
C
H
E
S
2003 2004
YEAR BRANCHES IN OPERATION
NCNs URBAN NCBs RURAL NCBs TOTAL
PCBs URBAN PCBs RURAL PCBs TOTAL
0 10000 20000 30000 40000 50000
D
E
P
O
S
IT
2003 2004
YEAR
DEPOSIT MOBILIZATION BY NCBs PCBs
64 Md. Ariful Islam et al.: Growth of Private Commercial Banks in Bangladesh
In this study an attempt has been made for the justification of the denationalization and privatization and how successfully PCBs have contribute to improve the performance of commercial banks. Keeping in mind the specific objective of the study, to examine the growth of private commercial banks, the whole study has been arranged. To fulfill the objective, three major components have been focused, such as how far PCBs have expanded their branches, to what extent they have mobilized deposits and how effectively they have managed their credit function.
Some significant observations have been noted while analyzing the overall scenario of PCBs in Bangladesh. The observations are enumerated as follows –
Within 21 years PCBs have established 30 banks with 1494 branches, which is comparatively almost 1/2 of NCBs and around 24% of total branches in operation.
In the denationalization and privatization period, PCBs contribution to the total banking sector was not at all satisfactory from 1980s to mid-1990s, because of regulatory forbearance. So the denationalization and privatization cannot be treated as victorious for PCBs as well as overall banking sector.
PCBs performance have started to be better after mid-1990s, which have been manifested through significant increase of PCBs share in overall banking operation. Consequently the financial performance of PCBs have also improved in the latter part of 1990s as well as 2004. So it can be said that in the financial liberalization period PCBs have conquered their position that of denationalization and privatization period.
It was expected that the decision of denationalization and privatization had been able to raise the profitability of the NCBs and the commercial banking sector as a whole, but the profitability of NCBs deteriorated over the years since the denationalization and privatization process started.
The PCBs of the country are mainly focusing their operation mainly in the urban areas. Hence, urban branches (branches situated in the municipal areas) are getting more attention from the top management of the banks. Rural branches always remain the objects of negligence on the part of the PCBs.
It has been observed that the NCBs are holding the major segment of the total bank deposits distribution. But the monopoly of NCBs has changed with the inception of PCBs in the banking arena of Bangladesh from the year 1983.
The growth rate of PCBs deposit was high enough up to mid of the 1980s, but it declined and turned in to negative growth just after the Financial Sector Reform Program (FSRP) had launched in 1990. However, PCBs again had been able to attain a positive growth at the end of 1990s which continued till 2004
The credit situation of PCBs is better than other types of banks and PCBs also managed to reduce the volume of NPL in the recent year.
The profitability of NCBs as well as the commercial banking sector went down from the level existing before the process of denationalization and privatization started, though the absolute profit level of the commercial banks increased, which has proved that the intention of raising competition has been aborted.
The comparative performance between PCBs and NCBs has given the indication that the performance of NCBs is still not satisfactory, may be because of numerous problems such as political influence in loan decisions, excess manpower, poor salary and so on.
5. Conclusion and Recommendations
After having studied the growth of PCBs in Bangladesh, it can be said that, after than capturing the highest proportionate share of the banking sector, the PCBs performance is not as much satisfactory as it should be. During 1980s PCBs performance was not satisfactory as it not only failed to achieve the desired efficiency of its own, but also was unsuccessful to improve the position of NCBs, which was thought to be improved. The Performance of PCBs have started to be better after mid-1990s, which have been manifested through significant increase of PCBs share in overall banking operations. Licensing a number of PCBs leading towards an expansion of branches all over the country, providing better salary and another advantages to their employees, improving competition among PCBs, strict banking supervision have contributed largely for the matter of increasing the banking share of PCBs and their financial performance. But still there are some drawbacks which are acting as the barrier to achieve the expected performance of PCBs and for these reason some subject matter can be recommendations can be made.
Recent reform measures should be maintain accordingly so that the existing problems of PCBs can be solved.
For a balanced banking business, rural areas or branches must be given due emphasis as they can provide a handsome portion of earnings.
Systematic and proper planning system should be introduced to achieve expected goal.
Political and other sorts of intervention should be avoided to select project, for bank investment so that the proportion of NPL can be reduced further.
Appendix
Appendix Table 1.TOTAL BRANCHES IN OPERATION
YEAR BRANCHES
NCBs SBs PCBs FCBs TOTAL
2004 3388 1318 1494 36 6236 2003 3397 1314 1510 32 6253 2002 3496 1311 1398 31 6236 2001 3612 1215 1296 33 6156 2000 3607 1185 1231 31 6054 1999 3616 1175 1160 29 5980 1998 3617 1173 1133 26 5949 1997 3619 1171 1095 24 5909 1996 3620 1151 1079 22 5872 1995 3611 1164 1016 18 5809 1994 3605 1186 971 18 5780 1993 3595 1184 943 22 5744 1992 3587 1168 915 22 5692 1991 3582 1166 883 22 5653 1990 3545 1145 827 22 5539 1989 3522 1122 883 22 5549 1988 3486 1104 733 22 5345 1987 3446 1068 709 22 5245 1986 3399 1015 678 21 5113 1985 3393 1028 653 20 5094 1984 3843 981 628 20 5472 1983 3843 914 N.A 20 4777
Source: Bangladesh Bank Annual Report, various issue.
Appendix Table 2. AREA WISE DISTRIBUTION OF BANCHES
(Lacs Taka)
YEAR NCBs PCBs TOTAL
URBAN RURAL URBAN RURAL
1983 1419 2321 12 0 4603 1984 1424 2413 46 0 4817 1985 1124 2222 380 252 4963 1986 1135 2264 409 256 5114 1987 1144 2302 448 240 5224 1988 1154 2332 482 251 5345 1989 1181 2341 516 269 5451 1990 1191 2354 545 282 5539 1991 1197 2368 580 296 5621 1992 N.A. N.A. N.A. N.A. 5656 1993 N.A. N.A. N.A. N.A. 5740 1994 N.A. N.A. N.A. N.A. 5792 1995 N.A. N.A. N.A. N.A. 5813 1996 1326 1326 758 321 5874 1997 1326 1346 776 319 5911 1998 1336 1336 821 312 5952 1999 1336 1336 849 311 5982 2000 1337 1337 913 318 6056 2001 1338 1338 959 337 6156 2002 1321 1321 1011 335 6278 2003 1250 1250 1054 369 6253 2004 1243 1243 1108 386 6236
SOURCE: SCHEDULED BANKS STATISTICS (From June’83 toJune’04)
Appendix Table 3.TOTAL DEPOSIT MOBILIZATION BY BANKS
(Percentage of total deposit)
YEAR DEPOSIT
NCBs SBs PCBs FCBs
1983 85.32 4.53 N.A. 8.76 1984 82.54 4.60 6.24 6.62 1985 69.86 5.83 17.59 6.72 1986 68.39 5.73 19.60 6.28 1987 64.32 7.51 20.93 7.24 1988 58.92 10.37 22.95 7.76 1989 62.43 4.78 24.51 8.28 1990 62.28 4.82 25.66 7.24 1991 61.18 4.88 26.99 6.95 1992 62.78 5.11 25.63 6.48 1993 62.16 5.44 28.23 4.17 1994 62.52 6.31 27.22 3.95 1995 61.19 6.34 27.93 4.54 1996 61.33 5.54 27.83 5.30 1997 60.26 5.15 28.19 6.40 1998 59.19 5.80 27.98 7.03 1999 57.54 5.93 29.01 7.52 2000 54.50 6.31 31.43 7.76 2001 52.66 6.59 33.60 7.15 2002 50.30 5.80 36.80 7.10 2003 46.00 5.20 41.40 7.40 2004 44.40 5.63 42.86 7.11
Source: Bangladesh Bank Annual Report, various issue.
Appendix Table 4. AREA WISEDISTRIBUTION OFDEPOSITS
YEAR NCBs PCBs TOTAL
URBAN RURAL URBAN RURAL
1983 3053.07 1187.31 70.72 0 5098 1984 4217.63 1559.95 446.09 0 7158.4 1985 4887.87 1717.36 1596.16 49.37 9356.32 1986 5706.49 1902.16 2072.54 86.36 11016.64
1987 6502.66 2405.09 2556.05 222.26 13274.16 1988 7087.61 3037.55 3261.5 322.57 15614.65 1989 8465.55 3131.09 3891.62 375.28 18091.08 1990 9624.82 3295.3 4641.68 405.56 20367.1
1991 10638.63 3833.94 5528.12 524.22 22818.02 1992 12534.16 4390.93 5992.19 603.14 26181.57 1993 13795.81 5003.82 7366.88 709.19 29945.35 1994 16676.62 6090.39 9390.04 937.58 36815.63 1995 17562.45 6452.76 9707.23 980.98 38924.12
1996 18946.76 7207.49 10342.59 1050.32 41941.17 1997 20806.49 8162.8 11549.63 1171.18 47189.36 1998 22716.28 9058.51 12564.86 1330.74 52004.51 1999 25169.53 10176.62 14663.81 1580.6 58994.12 2000 26037.36 1152.44 17606.98 1749.25 70981.25 2001 32173.04 12053.71 24819.63 1792.6 81650.02 2002 34998.26 13157.04 30554.58 2224.37 93084.14 2003 38106.18 13559.2 38684.73 2844.9 107406.8 2004 41727.28 12828.91 47579.41 3463.76 121576.1
66 Md. Ariful Islam et al.: Growth of Private Commercial Banks in Bangladesh
Appendix Table 5. TOTAL CREDIT DEPLOYMENT BY BANKS
(Percentage of total deposit)
YEAR CREDIT
NCBs SBs PCBs FCBs
1983 69.60 24.80 0.60 5.00 1984 63.40 26.80 4.20 5.60 1985 57.00 25.60 12.30 5.10 1986 55.80 24.50 14.00 5.70 1987 53.10 23.60 16.70 6.60 1988 51.90 22.90 18.70 6.50 1989 51.55 21.65 20.16 6.64 1990 52.01 20.50 21.40 6.09 1991 52.66 19.33 22.00 6.01 1992 49.56 19.59 24.72 6.13 1993 52.16 16.88 26.25 4.71 1994 50.60 17.04 27.35 5.01 1995 53.13 14.14 27.59 5.14 1996 52.88 14.99 26.73 5.40 1997 53.03 14.26 26.94 5.77 1998 51.45 16.17 26.16 6.22 1999 50.29 16.48 27.27 5.96 2000 47.55 16.00 30.34 6.11 2001 45.47 13.83 34.90 5.80 2002 42.35 12.85 38.63 6.17 2003 39.65 10.86 42.51 6.98 2004 37.05 9.81 46.33 6.81
Source: Bangladesh Bank Annual Report, various issue.
Appendix Table 6. AREA WISE DISTRIBUTION OF CREDIT
(Lacs Taka)
YEAR NCBs PCBs TOTAL
URBAN RURAL URBAN RURAL
1983 2862.42 628.34 31.95 0 5020.99 1984 3327.14 831.78 273.81 0 5017.02 1985 4326.60 763.52 1010.50 87.87 8933.19 1986 6391.27 1217.38 2050.96 109.95 10898.73 1987 5151.63 1130.85 1886.75 78.61 11822.45 1988 6005.66 1230.07 2507.57 98.17 13936.15 1989 7330.81 1193.39 3163.66 166.51 16686.72 1990 8326.39 2033.46 3817.24 246.1 19909.43 1991 9308.54 2414.68 4559.12 148.66 21387.19 1992 10325.90 2089.02 5351.24 124.26 24058.55 1993 11681.90 2445.54 6578.70 134.86 27361.08 1994 12744.65 3074.95 7524.97 193.94 31140.8 1995 14003.13 3280.56 8055.00 188.69 33910.87 1996 15859.28 3728.67 1880.44 N.A. 37166.04 1997 18253.23 4011.75 10052.33 230.16 41764.56 1998 20048.05 4395.26 1773.34 247.36 47989.72 1999 22292.06 5130.96 13682.47 308.26 53983.58 2000 22847.70 5315.48 15848.51 354.67 59361.74 2001 26508.61 5075.35 22484.11 358.32 68778.01 2002 28803.58 5104.67 27328.37 526.16 76772.36 2003 30934.78 4914.30 32618.64 727.99 84734.11 2004 33150.36 4511.51 39377.24 920.43 95130.25
Source: scheduled banks statistics (From June’83 toJune’04)
References
[1] Bangladesh Bank . 2004. Annual Report 2003-2004. Dhaka. Bangladesh Bank.
[2] Choudhury, Toufic A. 2004. “Private Banking In Bangladesh”. Bangladesh Institute Of Bank Management .(Mime)
[3] Choudhury, Toufic A. 1990. “An Evaluation Of The Performance Of Commercial Banks Of Bangladesh”. Himachal Pradesh University , Shimla.(Mime)
[4] Choudhury, Toufic A. 1998. “Impact OfDenationalisation and Privatisation in the Profitability and Productivity of the Commercial Banks of Bangladesh”. Bank Parikroma. Vol.XIII, Nos 3 &4. pp.37-49
[5] Uddin, Mohammad Sohrab, Dr. Bandana Shaha, Toufic Ahmed Choudhury. 1998. “Growth and Structure of the Banking Sector in Bangladesh”. Bank Parikrama. Vol. X. pp. 1-9.
[6] Huda, Md. Nazrul.1998. “Bangladesh’s Financial Sector: An Oveview”. Bank Parikrama. Vol.XXII,Nos 3 & 4. pp. 33-54. [7] Ahmed, Faruquddin.1999.”Banking in Bangladesh-
Evolution and Present Status”.. Vol. XXIV, No.2,June,1999. pp. 5-12.
[8] Alam, Khorshed. 1994. “Reforms in Finance and Banking in Bangladesh”. Bank Parikrama. Vol.XIX, Nos.3 & 4, September-December,1994. pp.1-6.
[9] Choudhuri, A.H.M. Nurul Islam, et al.1995. “ An Evaluation of the Impact of Reforms in the Financial Sector”. Bank Parikrama. Vol. XX, Nos.3 & 4.1995.pp.1-44
[10] Mason, D. Robert, Douglas A. Lind.1990. Statistical Techniques in BUSINESS & ECONOMICS. Ninth Edition. Irwin.
[11] Choudhury, Toufic Ahmed. “PRINCIPLES AND PRACTICES OF BANKING”. Bangladesh Institute of Bank Management.(Mime)
[12] Bangladesh Bank, Scheduled Bank Statistics. Dhaka. Bangladesh Bank, 1983-2004.
[13] Bangladesh Bank, Economic Trend. Dhaka. Bangladesh Bank, 1983-2003.
[14] Bangladesh Bank, Bangladesh Bank Bulletin. Dhaka: Bangladesh Bank, 1983-2003.