European Journal of Economic Studies, 2014, Vol.(7), № 1
1
E
UROPEAN
of Economic
Journal
Studies
Has been issued since 2012.
ISSN 2304-9669. E-ISSN 2305-6282
2014. Vol.(7). № 1. Issued 4 times a year
Impact Factor OAJI 2012 – 0,527 Global Impact Factor 2012 – 0,532
EDITORIAL STAFF
PhD Vidishcheva Evgeniya – Sochi State University, Sochi, Russia (Editor-in-Chief) Dr. Simonyan Garnik – Scientific Research Centre of the Russian Academy of Sciences, Sochi, Russia
Dr . Levchenko Tat'yana – Sochi State University, Sochi, Russia
Dr . Tarakanov Vasilii – Volgograd State Univ ersity , Volgograd, Russia
EDITORIAL BOARD
Dr. Balatsky Evgeny – Central Economics and Mathematics Institute (RAS), Moscow, Russia Dr. Eliseeva Irina – Sociological Institute of the Russian Academy of Sciences, Saint-Petersburg, Russia
Dr. Gunare Marina – Baltic International Academy, Riga
Dr. Kryshtanovskaya Olga – Institute of Sociology of the Russian Academy of Sciences, Moscow, Russia
Dr. Minakir Pavel – Econom ic Research Institute of the FarEastern Branch Russian Academy of Sciences, Khabarovsk, Russia
Dr. Vishnevsky Valentine – Institute of Industrial Economics of the National Academy of Sciences of Ukraine, Donetsk, Ukraine
The journal is registered by Federal Service for Supervision of Mass Media, Communications and Protection of Cultural Heritage (Russia). Registration Certificate ПИ № ФС77-50465 4 July 2012.
Journal is indexed by : CrossRef (UK), EBSCOhost Electronic Journals Service (USA), Electronic scientific library (Russia), Global Impact Factor (Australia), Index Copernicus (Poland), Open Academic Journals Index (Russia), ResearchBib (Japan), ULRICH’s WEB (USA).
All manuscripts are peer reviewed by experts in the respective field. Authors of the manuscripts bear responsibility for their content, credibility and reliability.
Editorial board doesn‘t expect the manuscripts‘ authors to always agree with its opinion.
Postal Address: 26/2 Konstitutcii, Office 6 354000 Sochi, Russia
Website: http://ejournal2.com / E-mail: ejoes@inbox.ru
Founder and Editor: Academic Publishing House Researcher
Passed for printing 15.03.14. Format 21 29,7 /4. Enam el-paper. Print screen. Headset Georgia.
Ych. Izd. l. 4,5. Ysl. pech. l. 4,2.
Circulation 250 copies. Order № 100.
© European Journal of Economic Studies, 2014
European Journal of Economic Studies, 2014, Vol.(7), № 1
2
Е
ВРОПЕЙСКИЙ
ЭКОНОМИЧЕСКИХ
Ж
урнал
ИССЛЕДОВАНИЙ
Издается с 2012 г. ISSN 2304-9669. E-ISSN 2305-6282 2014. № 1 (7). Выходит 4 раза в год
.
Impact Factor OAJI 2012 – 0,527 Global Impact Factor 2012 – 0,532
РЕДАКЦИОННАЯ КОЛЛЕГИЯ
Ветитнев Александр – Сочинский госу дарственный у ниверситет, Сочи, Россия (Гл. редактор)
Видищева Евгения – Сочинский госу дарственный у ниверситет, Сочи, Россия Левченко Татьяна – Сочинский госу дарственный университет, Сочи, Россия
Симонян Гарник – Сочинский научно-исследовательский центр Российской академии наук, Сочи, Россия
Тараканов Василий – Волгоградский госу дарственный университет, Волгоград, Россия
РЕДАКЦИОННЫЙ СОВЕТ
Балацкий Евгений – Центральный экономико-математический институт РАН, Москва, Россия
Вишневский Валентин – Институт экономики промышленности Национальной академии наук Украины, Донецк, Украина
Гунаре Марина– Балтийская международная академия, Рига
Елисеева Ирина – Социологический институт РАН, Санкт-Петербург, Россия
Минакир Павел – Институт экономических исследований ДВО РАН, Хабаровск, Россия Крыштановская Ольга – Институт социологии РАН, Москва, Россия
Жу рнал зарегистрирован Федеральной службой п о надзору в сфере массовых коммуникаций, связи и охраны культу рного наследия (Российская Федерация). Свидетельство о регистрации средства массов ой информации ПИ № ФС77-50465 от 4 июля 2012 г.
Журнал инд ексируется в: CrossRef (Велик обритания), EBSCOh ost Electroni c Jou rnal s Servi ce (США ), Global Impact Factor (Австралия), Index Copernicu s (Польша), Научная электронная библиотека (Россия), Open Academic Journals Index (Россия), ResearchBib (Япония), ULRICH’s WEB (США).
Статьи, поступившие в редакцию, рецензируются. За достоверность сведений, изложенных в статьях, ответственность несут авторы пу бли каций.
Мнение редакции м ожет не совпадать с мнением авторов материалов.
Адрес редакции: 354000, Россия, г. Сочи, ул. Конституции, д. 26/2, оф. 6
Сайт журнала: http://ejournal2.com/ E-mail: ejoes@inbox.ru
Учредитель и издатель: ООО «Научный издательский дом "Исследователь"» - Academic Publishing House Researcher
Подписано в печать 15.03.14. Формат 21 29,7 /4.
Бумага офсетная. Печать тра фаретная. Гарнитура Georgia.
Уч.-изд. л. 4,5. Усл. печ. л. 4,2. Тираж 250 экз. Заказ № 100.
© European Journal of Economic Studies, 2014
3
C O N T E N T S
V.V. Biryukov, Z.S. Gelmanova
Integration Processes in the Industry Sphere ………..
Nailya M. Feizrakhmanova
A Methodology for Calculating Tourist Insurance Rates ……….
4
9
Adam Galamboš, Lukrecija Đeri, Aleksandra Dragin, Tamaš Galamboš, Jelica J. Marković
Air Travel Safety Perception Among Tourists With or Without Flying Experience ………… 15
Marianna V. Kichurchak
Characteristics of the Effect of the Shadow Economy on the Reproduction
of Public Goods in Ukraine ……….. 25
Arthur V. Kuchumov, Anna D. Melnikova
The Concept of Creating a Tourism/Recreation Cluster
in the Republic of Karelia ………. 33
Maria V. Shendo, Yana G. Levina
An Analysis of the Target Segments of the Tourism Services Market
4
UDC 33Integration Processes in the Industry Sphere
1 V.V. Biryukov 2 Z.S. Gelmanova 1 -2 Karaganda State Industrial University, Kazakhstan
Abstract. Research of the issues related organization and functioning of the intercompany relations is particularly topical. In the context of integration processes in the production complex there is an objective need to develop new and revise the already-existing methodological schemes and ways that are oriented to the competition power provision and economic institution development in the production.
Keywords: integration, quasi-integration, intercompany relations, management.
Introduction.
Over the last few years integration issues in the industry sphere and roles of the end product sales in this process are under active discussions in the scientific sphere. The interest to the problematics is conditioned upon serious competetive recovery reserves of the cooperative producers and the end product consumers. High risks and distrust to the contractors increases transaction expenses which reduce the competetive recovery. In response to the growing integration processes there is a task of intercompany management of economical formations in the industry. An important peculiarity of Russia‘s economics modern development stage is increasing the role of integrated structures in the industry sector. Industrial integrated structures have the following significant advantages: they have a great potential for implementing the strategy of competitive advantage; they have an opportunity to diversify production and create closed manufacturing chains; they react to the market changes more flexible; they are able to economize by centralizing some functions; they are more resistant due to the multiple risk operations transfer to subsidiaries, etc.
Discussion.
Scientific stage of the problem. The theoretical bases for the development of the integration process are reflected in the works of prominent Western scientists like Bertalanffy, Galbraith, R.G. Coase, D.S. North, J. Tyrol, O. Williamson, H. Haken, K. Arrow and others. Issue on effectiveness assess of the integrated structures is researched in the works of V. Pareto, E. Peters, R. Pindyck, A. Thompson, Joseph Schumpeter and others. Functioning problems of the integrated business structures were under research of R. Ackoff, I. Ansoff, Braley, S. Myers, R. Matthews, JS Pappe, A Strickland. In recent years, intercompany cooperation in industry and logistics is deeply researched in the economic literature both abroad and in Russia. There is a significant backup on the developing the methodological basis of the complex integrated structures management in the works of V.I. Sergeeva, V.V. Dybsky, O.D. Protsenko, L.B. Mirotin, A.G. Nekrasov, V.S. Lukinskogo, S.A. Uvarov, E.I. Zaitseva, B.V. Sokolov, A.V. Smirnov, A.V. Arkhipov, S. Wirth, H. Wildemann, H.P. Wiendahl, J. Suedow, J. Kaeschel, T. Teich, D.Ivanova (Germany), R. Swiekatowsk (Poland), B. Kaluza (Austria), L.M. Camarihna-Matos (Portugal), C. Chandra, H. Simchi-Levi, T. Tayur, T. Harrison (US). Thus, the intercompany management current state analysis allows to fix that:
- insufficiently studied theoretical and methodological bases for the efficiency assessment of the company integration and supply, production functionality, sales;
- most industry companies have no management approach to the flow processes management aimed to optimization of the intercompany transactions;
- arising expenses and losses when promoting the goods from the original provider of material resources to the final consumer of the end products are not fully taken into consideration and quantified;
5
balance approach of integrated providers of material resources, producers and consumers.
Based on this the research aim is to develop the methodological basis of industrial company effective management under conditions of the integration processes. To approach the aim it is required to deliver the following targets:
1. to find out the peculiarities of the management under conditions of integration in the industry sphere;
2. to develop the methods and economical mathematical model of the integrated areas optimal functioning in the industry sphere.
Let‘s work a task. The traditional system approach satisfies the requirements of the economical relations current stage. With that today amid the integration processes development the issues on economical practicability and mutual dependance in the whole chain of the participants cooperation become topical, i.e. development and system approach range expansion including its contragents study. Under the conditions of integration processes development the necessity of range expansion of the system approach to the assesment and integrated subjects management has been proved.
By integration of the industry companies we take a process directed to joining of the economical entities to the entire financial and economic «nature» in order to achieve competitive advantages in the external environment through the efficient additions of the potential participants that form its structure. In other words, by integration we can mean both the process and result of interaction between the separate structural elements of some assembly that leads to the link optimization between them and their union into a single system which has a new quality and new potential possibilities videlicet synergy. This is accompanied by an increase in the effectiveness of the activity due to compound of the separate parts into a single system through the so-called systemic effect. In particular, the integration in a metallurgical complex allows to reduce cross unit costs for the final production, cost savings linked with the outside contractors and intermediaries, transaction cost reduction for the intermediate products indirect taxation. In addition, there is a possibility of capital-intensive projects and research programs. Integrated steel structure profitably differ with a higher stability and lower dependent on adverse changes in market conditions.
The main division criterion for the integration unions to full, partial and quasi-integration is an active company control extent over an ownership of the companies belonged to the union while maintaining a full control over developing the different business forms. Performance of the quasi-integration economical forms: virtual corporations, strategical alliances, clusters, delivery chains. First two forms define unions in the big business sphere, second two forms appear mostly in the medium business sphere. Economical forms of the quasi-integration: virtual corporations, strategical alliances, clusters, delivery chains. It ought to be remarked that the generally accepted «quasi-integration» definition doesn‘t exist. At that different sources core with mismatch of the definitions and the phenimenon conception as well. Particularly, K. Blua defines quasi-integration as a situation where «the companies avoid the vertical integration risk or the ownership rigidity taking out its advantages» [1]. By quasi-integration M. Dietrich means «permanent relations between legally independent economical units» [2]. V. Tretiak has the same opinion; he thinks that we should link quasi-integration existence with the assets integration of legal independent companies that voluntary give consent to control over their assets [2].
Quasi-integrated structure is a combination of theindependent companies and organizations that coordinate the activities based on network interaction principle and high trust degree defined by non-formilized relations, sociability, mobility, dynamical structure. Differential peculiarity of the quasi-intergartion stuctures is period of relations that is enough to create some «internal» systems of the norms and rules for the group which in most cases allow not to apply to the «external» third party for conflict management. At that the certain norms are formed - «stoppers» that make each of the partners to consider the interests of other participants and thereby conduce the structure stability. Quasi-integration forms are shown in the table Nr 1.
6
Table 1: General description of the corporate integration forms
Type Description
1. Strategic alliances
Integration of independent companies for a certain project realization. The companies are independent in settlement of other topics that are not linked to the alliance interests.
2. Franchising Franchising (trademark owner) provides the franchise with goods, technology and contributes to the business minimazing by this the financial and management recources.
3. Virtual corporation
Its prototype is net organization. The organization is created to execute activities or realize arising needs. It is created from different companies based on a contract that provides integration of the partners efforts for some project realization.
4. Dynamics focal net
Dominant central company («broker») groups a partner net, takes best scopes from the net and coordinates activities on a value engineering by hierarchical methods. It is characterized by stability absence, competition among the partners, open network logon.
5. Value network
It is created with the aim to impprove logistic and marketing processes in a customer-oriented network (retail business, consumer product manufacturing).
Aims: terms reduction, costs saving, service improvment, consumer needs considerations. Based on «just-in-time delivery» and «perpetual stocking» systems. It has the quasi-integration form. The partner structure is differ by low fluidity. The network is characterized by polycentrism that is stepwise changed by focal company creation.
6. Facal supply net [89]
One partner domination (focal company) that coordinates the whole value network creation. It has the hierarchic pyramidical form. The structure is vertcally integrated. Dynamics competition among the partners that vid for specific projects participation.
7. Cluster
A group of geographically localized integrated companies, suppliers of equipment, utilities, customized services, infrastructure, scientific-research institutes, universities and other organizations that mutually explanatory of each other and strengthen competitive position of self contained companies and the cluster as a whole.
7
tendency for the integrated structure innovative development.
Let us work another task. An author method of supply, production and sales performance optimization at the industry companies under conditions of the integration with contragents has been developed. As distinct from the existing ones first of all it is based on expenses and losses identification sources in the supply chain «supplier-producer-consumer»; secondly it takes into account the correlation between costs and losses; thirdly it shows different schemes of the flow processes with taking into consideration the external environent requirements and interaction with the byuers each of which impacts to the reason and value of the expenses and losses; fourthly it allows to plan the optimal supply and sales parameters based on a difference in production delivery time and its payment. The criterion is minimum of the integral expenses that includes classic, logistic and transaction expenses [3-5].
Oriented to the proposed method an economic and mathematical model for identifying the supply and sales parameters under conditions of advance payment and delay of payment at the integrated companies based on the modern programs application has been developed and tested at one of the biggest metallurgic compaies in Russia [6]. The model allowed to get the following practical results: minimal value of the integrated expenses could be achieved at the time value of
the sold production payment and it is rubles; modeling of the variant with an advance payment for the sold production has shown that the minimal value of the intergated expenses could be achieved at the advance payment value =40% and waiting time of the end
production 34 days; best balance between sales rejims could be achieved at the payment time
of the sold production 5 days and waiting time of the end production from 17 up to 34 days depends on the advance payment and sales volume on the advance payment; to increase customer service level for 1% it‘s required to increase expenses for 1,8 milion rubles, at that losses will be reduced for 0,85 million rubless. Vice versa, service level reduction for 1% will lead to losses increase for 0,9 million rubles, at that expenses will be reduced for 0,3 million rubles [6,7].
Practical relevance of the work is what the obtained results allow to move from an intuitive to the scientific rationale of the management decisions took by a management of the integrated industry companies in the cost control process.
Economical effect lies in expenses reduction by stages of the producer cash flow that at in the stage of quasi-integration with suppliers of the material recources and consumers of the end production [8].
Developments and guidance papers have practical value and could be used by management and specialists of the economical subsidiaries.
Individual contribution of the article writers lies in original optimization method development and building up a model of the effective functioning industry companies integrated into a supply chain.
Conclusions:
- under conditions of growing integrated processes there is an objective task to develop a new management tool and perfom its evaluation; the criterion of the effective management under condition of the integration is minimum of the integration expenses for the whole product promotion chain from formation up to consumption, from the supplier up to end consumer; to take fast management decisions it‘s required to build up an adequate model which allows to define and approach optimal parameters of the integrated participants in a real-time mode.
References:
1. M.U. Sheresheva, Inter-management networks in the system of the modern sectorial market operation forms / M.U. Sheresheva. М., 2006. 53 p.
1. V.P. Tretiak, Ownership in the quasi-integration structures [Electronic resource]. – Access mode: old.econ.pu.ru/files/Tretyak_1134404912.
8
3. A.G. Butrin, Supply chain modeling at the industry companies: study guide - Chelyabinsk: SUSU publishing center, 2010. p. 184.
4. A.G. Butrin, Z.S. Gelmanova, Supply management at the industrial holdings, monograph – Astana.: publishing and polygraphic center of Kazakhstan and Russia University, 2013. p. 164
5. Ivanov D., Kaeschel J., Sokolov B. Integrated Modeling of Enterprise Networks // International Journal of Agile Systems and Management. 2007. N 2(1). 1,5.
6. Ivanov D., Zschorn L., Kaeschel J., Sokolov B. V., Archipov A.V. Dynamical Synthesis And Reconfiguration Of Competence-Cell -Based Production Networks // Information Control Problems in Manufacturing / ed. by A. Dolgui et al. Amsterdam: Elsevier, 2007. 11
9
UDC 33A Methodology for Calculating Tourist Insurance Rates
Nailya M. Feizrakhmanova
Russian University of Cooperation, Russian Federation PhD student
E-mail: nfeyzrahmanova@rucoop.ru
Abstract. This article examines a methodology for calculating tourist insurance rates. The author suggests introducing an adjustment coefficient for risk accumulation in calculating rates for insuring against the risk of harm to the life of a tourist during travel.
Keywords: insurance, tourist insurance, rates, insurance amount, calculation methodology.
Введение. Обязательным условием успешной реализации основных действующих и
перспективных направлений системы принятия решений по страхованию в туризме, а также для дальнейшего развития туристической отрасли является эффективная государственная политика в области страхования. Одним из основных инструментов управления рисками туристической отрасли является страхование.
Страхование является одним из сегментов финансового рынка. Страхование в туризме это необходимость, продиктованная временем и современными условиями предоставления услуг, заключающаяся в обеспечении безопасности и защиты интересов путешественников при совершении туристических поездок, реализующаяся посредством отношений между страхователями и страховщиками. Актуальность страхования туристов обусловлена как международными нормами по предоставлению финансовой защиты туристов, так и ростом числа активных и экстремальных видов отдыха (дайвинг, прыжки с парашюта, альпинизм, виндсерфинг, сплав, пешие туры, горные лыжи, походы по пещерам).
Исследовательская часть. В настоящее время страховая отрасль в сфере туризма
предоставляет более десятка видов услуг страхования (Таблица 1). Прежде всего, страхуется здоровье туриста (различные виды медицинского страхования и помощи, от несчастного случая с покрытием медицинских расходов, страхования жизни) и его имущество. Рассматриваются и иные неблагоприятные факторы риска.
Страховые компании продолжают работу над оптимизацией своего продукта в сфере страхования путешественников. Предложить что-то принципиально новое на этом рынке становится все сложнее, поэтому основные усилия страховщиков направлены на совершенствование сервиса.
Совершенствование сервиса необходимо проводить во всех направлениях, как в отношении качества обслуживания клиентов, так и в отношении качества предоставляемых страховых продуктов. В настоящее время, клиенты обращаются в колл-центры и к консультантам напрямую для получения интересующей их информации. Существенным изменением в сервисе обслуживания клиентов стало бы проведение модернизации интернет-сайтов компаний и создание личных кабинетов клиентов, с помощью которых страхователи смогли бы в любое время суток узнать необходимую им информацию, ознакомиться с полезной информацией, просматривать информацию, касающуюся своих договоров страхования, контролировать взаиморасчеты со страховой компанией, а также отправлять заявки на внесение изменений в договор страхования и просматривать статус страховых выплат.
Таблица 1
Услуги, предоставляемые крупнейшими российскими страховыми компаниями туристам
Ст раховая
компания Медицинское страхование Прочее
Ингосстрах медицинских расходов;
наступления несчастного случая;
10
потери багажа авиаперевозчиком. третьими лицами. Альянс амбулаторное или стационарное
медицинское лечение;
экстренная стоматологическая помощь (острая зубная боль); транспортировка в больницу ; медицинская эвакуация
к постоянному месту ж ительст ва; приобретение лекарств,
предписанных врачом.
телефонные переговоры с сервисной службой, связанные со страховым случаем;
возвращение детей в страну постоянного прож ивания в случае экстренной
госпитализации родителя во время отдыха;
посещение родственником застрахованного лица, в случае его госпитализации;
досрочное возвращение из поездки в чрезвычайных ситуация;
страхование гражданской
ответственност и, на случай причинения вреда ж изни, здоровью или иму ществу другого человека или юридической лица; страхование багажа,
зарегистрированного и сданного под ответственность перевозчика, на случай его потери или тотального повреждения; страхование от несчастного случая на время путешест вия.
ВСК
медицинские расходы; расходы по медицинской транспортировке;
репатриацию тела в случае смерт и Застрахованного;
необходимость получения медицинской информации; расходы на экстренну ю стоматологическую помощь.
предоставление административной помощи – передача экстренных сообщений при страховом случае;
необходимость досрочного возвращения Застрахованного в экстренной ситуации; необходимость эвакуации детей, сопровождающих Застрахованного;
необходимость визит а третьего лица в чрезвычайной ситуации;
расходы на юридическую помощь; организацию помощи при потере документов;
расходы в случае утраты багажа;
расходы в случае задержки регулярного авиа или морского рейса.
Альфастрахова
ние амбулаторному и стационарному медицинские расходы по лечению;
расходы на экстренну ю стоматологическую помощь; расходы на транспортировку и репатриацию.
расходы при невыезде в запланированну ю поездку; расходы при потере багажа;
расходы с возникновением гражданской ответственност и перед третьими лицами.
Росгосстрах медицинские расходы, связанные с оказанием скорой и неотложной медицинской помощи,
амбулаторным и стационарным лечением;
медико-транспортные расходы по транспортировке с места
происшествия в ближайшее медицинское учреждение, а также медицинской репатриации на территорию Российской Федерации после окончания лечения;
расходы на телефонные переговоры с нами по поводу страхового случая;
расходы на визит родственника к вам за границу в чрезвычайной ситуации; расходы по вашему досрочному
возвращению в Российскую Федерацию в чрезвычайной ситуации;
расходы по получению юридической и административной помощи;
расходы по эвакуации ваших
11
расходы по репатриации останков в случае смерт и;
расходы по экстренной стоматологической помощи в пределах установленного договором страхования лимита;
Аналитическое исследование. Вопросы разработки методик защиты интересов
туристов, развития форм страхования, совершенствования нормативно-правового обеспечения, систематизации информации по оценке и страхованию рисков приобретают с каждым годом большую значимость.
Специфика туристической сферы и сложившаяся практика страхования туристов, а также отсутствие достаточного объема статистических данных и высокая вероятность реализации рисковых событий, требует разработки более точной методики расчета тарифных ставок. Как правило, при проведении актуарных расчетов в данном направлении применяются методики расчета тарифных ставок по массовым видам страхования.
Основные виды страхуемых рисков:
от острых внезапных заболеваний;
от несчастных случаев;
от пропажи багажа или другого имущества;
от невозможности выезда в оплаченную поездку;
от отсутствия снега на горнолыжных курортах;
на случай задержки самолетов и другого транспорта при выезде-въезде;
на случай невыдачи визы:
на случай наступления личной гражданской ответственности горнолыжников;
на случай плохой погоды во время нахождения туриста на отдыхе;
на случай непредоставления или неполного предоставления туруслуг.
В основе разработанной методики лежат принципы расчетов тарифных ставок по рисковым видам страхования, рекомендованные Федеральной службой Российской Федерации по надзору за страховой деятельностью, адаптированные для их применения с учетом специфики туристической деятельности.
Информация по данному виду страхованию достаточно ограничена, что также подтверждается тем, что страховые компании не информируют население о данном виде страхования даже посредством рекламы. Ведь очевидно, что страхование приводит к удорожанию стоимости туристической путевки. Проанализировав интернет -сайты крупнейших страховых компаний по количеству выданных полисов страхования путешествий (Иногосстрах, Альянс, ВСК, Альфастрахование, Росгосстрах) можно сделать следующий вывод о том, что действительно страховые компании на первый план по информационной открытости выставляют такие страховые продукты как КАСКО, ОСАГО, страхование ответственности, защита дома и т.д. То есть информация о данных видах страхования находится на первой странице, достаточно заметно и т.п.
Согласно общим принципам расчета тарифных ставок по рисковым видам страхования ставка страхового взноса состоит из тарифной нетто-ставки и расходов на ведение дела и т.д. Автором предлагается нетто-ставку тарифа на страхование риска причинения вреда жизни или здоровью туристов, страхование от невыезда, страхование гражданской ответственности туристов, рассматривать как сумму нетто-ставок страхового тарифа по указанным выше составляющим данного риска, то есть:
Тн=Тжз+Тнв+Тго (1) гдеTжз тариф на страхование риска причинения вреда жизни или здоровью туристов;
Tнвтариф на страхование невыезда,
Tг отариф на страхование гражданской ответственности туристов.
12
где Тжп тариф на страхование риска причинения вреда жизни туриста во время
туристической поездки,
Тзп тариф на страхование риска причинения вреда здоровью туриста во время
туристической поездки,
Расчет тарифа на страхование риска причинения вреда жизни туриста во время туристического путешествия может быть проведен на основе общей статистики причинения ущерба отечественным туристам. Расчет тарифа на страхование риска причинения вреда здоровью туриста предлагается осуществлять аналогично.
Согласно общим принципам расчета тарифных ставок полная нетто-ставка страхового тарифа включает в себя основную часть и рисковую надбавку и может быть рассчитана по следующей формуле:
Тжп=Тжпо+Тжпн (3)
где Тжп – тарифная нетто-ставка риска причинения вреда жизни туристу во время
путешествия,
Тжп о – основная часть тарифа на страхование риска причинения вреда жизни туриста,
Тжпн – рисковая надбавка к тарифу на страхование риска причинения вреда жизни туриста.
В качестве исходной информации автором предлагается использовать статистику гибели туристов России во время путешествия.
Основная часть тарифа на страхование риска причинения вреда жизни туриста во время туристической поездки, по мнению автора, должна быть рассчитана по следующей формуле:
Тжпо=Ку/К×Кк×100, (4)
где Ку количество туристов, погибших в ходе путешествия,
К общее количество туристов, Кк коэффициент кумуляции риска.
Кк=Ку/Ккт, (5)
где Ккт – количество страховых случаев, приведших к гибели туристов.
При расчете тарифа на страхование риска причинения вреда жизни туристу во время путешествия автором предлагается ввести поправочный коэффициент кумуляции риска. Одиночные туристические поездки в настоящее время осуществляются редко, поэтому существует высокая вероятность того, что одним страховым событием будет настигнуто несколько застрахованных объектов (например, гибель всей семьи во время путешествия), что повлечет за собой существенные страховые возмещения и должно быть учтено при формировании страхового тарифа.
Учитывая специфику риска причинения вреда жизни туристов во время путешествия (страховая сумма будет равна сумме возмещения), формула расчета рисковой надбавки примет упрощенный вид:
Тжпн=Тжпо*а(
)*г
К
1
(6)где Кг – запланированное на год количество договоров по данному виду страхования,
а(
) коэффициент, который зависит от гарантии безопасности гамма (
). Его значение может быть взято из Таблицы 2 согласно методике расчета тарифных ставок по рисковым видам страхования:Таблица 2.
Значения коэффициента а(
)
0,84 0,90 0,95 0,98 0,9986а 1,0 1,3 1,645 2,0 3,0
13
Соответственно, в расчете рисковой составляющей нетто-ставки страхового тарифа автором предлагается использовать значение 1,645.
Результативность исследования. Таким образом, нетто-ставку тарифа на
страхование риска причинения вреда жизни туристов во время путешествия на этапе полета автором предлагается рассчитывать по следующей формуле:
Тжп=
1
).
К
1
)
а(
(
100
г 2
КТ уК
К
К
(7)Тариф на страхование риска причинения вреда здоровью туриста во время туристической поездки в соответствии с типовой методикой автором предлагается рассчитывать следующим образом:
Тз п=Тз по+Тз пн, (8)
где Тзп тариф на страхование риска причинения вреда здоровью туриста во время
туристической поездки (нетто-ставка),
Тзп оосновная часть тарифа на страхование риска причинения вреда здоровью туриста во
время туристической поездки,
Тзпнрисковая надбавка к тарифу на страхование риска причинения вреда здоровью туриста
во время туристической поездки.
Основная часть тарифа на страхование риска причинения вреда здоровью туриста во время туристической поездки, по мнению автора, должна быть рассчитана по следующей формуле:
Тз по=Ку/К*Св/С/*Кк*100 (9) где Ку количество туристов, жизни которых был причинен ущерб во время путешествия,
К количество туристов, осуществивших путешествие,
Св средняя сумма страхового возмещения по данному виду страхования,
С средняя страховая сумма по данному виду страхования,
Рисковая надбавка в соответствии с методикой расчета тарифных ставок по рисковым видам страхования определяется как:
, * / ) / ( / 1 * ) ( * 2 г у в у зпо зпн К К К С С К К а Т
Т
(10)При расчете тарифа на страхование риска причинения вреда здоровью туристов во время путешествия введен поправочный коэффициент кумуляции риска, который отражает, что одиночные туристические поездки в настоящее время осуществляются редко, поэтому существует высокая вероятность того, что одним страховым событием будет настигнуто несколько застрахованных объектов (например, гибель всей семьи во время путешествия), что повлечет за собой существенные страховые возмещения и должно быть учтено при формировании страхового тарифа.
Учитывая специфику риска причинения вреда жизни туристов во время путешествия (страховая сумма будет равна сумме возмещения), формула расчета рисковой надбавки примет упрощенный вид:
Тжпн=Тжпо*а(
)*г
К
1
(11)Таким образом, нетто-ставку тарифа на страхование риска причинения вреда здоровью космонавтов на этапе подготовки к полету автором предлагается рассчитывать по следующей формуле:
Тзп= 1).
14
Заключение.
Таким образом, при расчете тарифа на страхование риска причинения вреда жизни туристу во время путешествия автором предлагается ввести поправочный коэффициент кумуляции риска. Одиночные туристические поездки в настоящее время осуществляются редко, поэтому существует высокая вероятность того, что одним страховым событием будет настигнуто несколько застрахованных объектов (например, гибель всей семьи во время путешествия), что повлечет за собой существенные страховые возмещения и должно быть учтено при формировании страхового тарифа.
Примечания:
1. Об организации страхового дела в Российской Федерации: Федеральный закон РФ от 27 ноября 1992 г. №4015-1 (в ред. от 28 июня 2013 г. №134-ФЗ) [Текст ].
2. Об основах туристской деятельност и в Российской Федерации: Федеральный закон РФ от 24 ноября 1996 г. №132-ФЗ (в ред. 03.05.2012, с изм. и доп., вступающими в силу с 01.11.2012): принят Гос. Ду мой 4 октября 1996 г.: Одобрен Советом Федерации 14 ноября 1996 г. [Текст].
3. Безопасный отдых и туризм: Высшее профессиональное образование [Текст ] / Под. ред. С.С. Соловьев. М.: Академия, 2008. 288 с.
4. Булатова, М., Седова, И. Страхование в вопросах и от ветах [Текст] /М.Булатов, И. Седова//Турбизнес. 2000. №10. С. 20 -21.
5. Введение в туризм [Текст] / Под ред. М.Б. Бирж аков. 9 -ое изд., перераб. и доп. СПб.: Издательский дом Герда, 2007. 576 с.
6. Веселовский, М. Я. Ст раховой сервис [Текст ]: Учебное пособие. М.: Альфа–М: ИНФРА–М, 2007 . 288 с.
7. Дементьев, С. Факторы риска [Текст]/ С. Дементьев //Турбизнес. 2008. №10. С. 16-17.
References:
1. Ob organizatsii strakhovogo dela v Rossiiskoi Federatsii: Federal'ny i zakon RF ot 27 noyabry a 1992 g. №4015-1 (v red. ot 28 iy unya 2013 g. №134-FZ) [Tekst].
2. Ob osnovakh turistskoi deyatel'nosti v Rossiiskoi Federatsii: Federal'ny i zakon RF ot 24 noyabry a 1996 g. №132-FZ (v red. 03.05.2012, s izm. i dop., v stupayushchimi v silu s 01.11.2012): prinyat Gos. Dumoi 4 oktyabrya 1996 g.: Odobren Sovetom Federatsii 14 noy abry a 1996 g. [Tekst].
3. Bezopasny i otdy kh i turizm: Vysshee professional'noe obrazovanie [Tekst] / Pod. red. S.S. Solov 'ev. M.: Akademiya, 2008. 288 s.
4. Bulatova, M., Sedov a, I. Strakhovanie v voprosakh i otvetakh [Tekst] /M.Bulatov , I. Sedova//Turbiznes. 2000. №10. S. 20 -21.
5. Vvedenie v turizm [Tekst] / Pod red. M.B. Birzhakov. 9 -oe izd., pererab. i dop. SPb.: Izdatel'skii dom Gerda, 2007 . 576 s.
6. Veselovskii, M. Ya. Strakhovoi servis [Tekst]: Uchebnoe posobie. M.: Al'fa–M: INFRA–M, 2007 . 288 s.
7 . Dement'ev , S. Faktory riska [Tekst]/ S. Dement'ev //Turbiznes. 2008. №10. S. 16-17.
УДК 33
Методика расчета тарифных ставок по страхованию туристов
Наиля Мансуровна Фейзрахманова
Российский университет кооперации, Российская Федерация Аспирант
E-mail: nfeyzrahmanova@rucoop.ru
Аннотация. В статье рассмотрена методика расчета тарифных ставок по страхованию
туристов. Автор предлагает при расчете тарифа на страхование риска причинения вреда жизни туристу во время путешествия ввести поправочный коэффициент кумуляции риска.
Ключевые слова: Страхование, страхование туристов, тарифные ставки, страховая
15
UDC 33Air Travel Safety Perception Among Tourists With or Without Flying Experience
1Adam Galamboš 2Lukrecija Đeri 3Aleksandra Dragin
4Tamaš Galamboš 5Jelica J. Marković 1University in Novi Sad, Serbia
Department of Geography, Tourism and Hotel Management, Faculty of Science, Trg Dositeja Obradovića 3, 21000 Novi Sad
E-mail: adam_galambos@yahoo.com M.Sc.
Position: PhD Student
2University in Novi Sad, Serbia
Department of Geography, Tourism and Hotel Management, Faculty of Science, Trg Dositeja Obradovića 3, 21000 Novi Sad
E-mail: djerilukrecija@gmail.com Ph.D.
Position: Assistant Professor
3University in Novi Sad, Serbia
Department of Geography, Tourism and Hotel Management, Faculty of Science, Trg Dositeja Obradovića 3, 21000 Novi Sad
E-mail: aleksandra.dragin@dgt.uns.ac.rs Ph.D.
Position: Assistant Professor
4University in Novi Sad, Serbia
Department of Geography, Tourism and Hotel Management, Faculty of Science, Trg Dositeja Obradovića 3, 21000 Novi Sad
E-mail: tamas.galambos@yahoo.com M.Sc.
Position: PhD Student
5University in Novi Sad, Serbia
Department of Geography, Tourism and Hotel Management, Faculty of Science, Trg Dositeja Obradovića 3, 21000 Novi Sad
E-mail: jelica.markovic@uns.ac.rs M.Sc.
Position: PhD Student
16
travel safety perception between tourist with and without flying experience; H2 - Tourists with flying experience consider air transport as the safest. The data in this research was gathered through a direct questionnaire. The main methods used for data analyze and display of results were descriptive statistics, T-test and standard deviation. Data was processed with the IBM SPSS 19.0. software package for statistical research. Results showed that tourists without flying experience have doubts towards air travel safety, which is also influencing tourism. On the other hand, tourists with more experience regard airplanes as the safest way of travel.
Keywords: air transport, tourism, safety, tourist attitude, fear of flying, air travellers.
Introduction
Transportation of people and things can be considered to be one of the necessities of human kind since antiquity. The notion of transport exists since historical roots of humanity, and its importance has exponentially multiplied over time. Today it is one of the most represented mass phenomena.
Tourists‗ transport service is an integral part of travel industry [1]. Transportation plays a significant role in the regional communication systems. It often forms a network around places, and it develops and operates a territorial subsystem for tourism and recreation [2].
The significance of traveler airline transportation across the globe can be illustrated by the number of airline travelers. In 2010, it was over 2.5 billion [3]. What needs to be considered is the participation ratio of certain types of transport in total international tourist movement:
Air transport 51%;
Road transport 41%;
Aquatic transport 6% and
Rail-road transport 2%.[4]
At the moment, era of air transport is in progress, considering that it had surpassed all other kinds of transport according to the number of transported passengers (51%). Apart from the increasing significance of this kind of transport, it is necessary to accentuate the return influence of tourism on airline transport. With the emergence of new attractive tourist destinations in the world, like in the United Arabic Emirates, it stimulates significant tourist movements.
Considering its proportions, even the slightest difficulties in its functioning can lead to significant consequences. When tourism is in question, there are a large number of factors which disrupt tourist air traffic. Those that need to receive special attention are of psychological nature, such as prejudice, irrational and rational fears, opinions, disinformation etc. From this aspect, it would be interesting to study people‘s opinions on safety of airline traffic. In order to achieve relevant results, it is necessary to separate two basic categories, which need to be analyzed as parallels. Those are, airline passengers who already have experience with fly ing and passengers who have not used services of this kind of transport. We can ask the question if there is a difference in understanding of the degree of safety of airline traffic among these two groups. If that is the case, if it can be measured and its course established? If the answer is revealed, we can acquire information about the degree of its influence on functioning and development of airline traffic, as well as tourism. Data shows that an increasingly large number of airline companies are dedicating attention to fear of safety and fear of flying , meaning that this problem is worthy of attention.
Airline transport, as a subsystem of tourist industry is divided into four basic categories, according to their business orientation. Each of these business philosophies attracts different passenger structure, considering that their choice is influenced by their travel goals [5]:
Classic airline companies;
Charter airline companies;
Low budget airline companies;
Specialized airline companies.
17
Helidream Canaria company organizes panoramic helicopter flights for visitors to Tenerife city and its coast [7]. With the appearance of a new kind of tourism - space tourism, there is a whole new field to explore attitudes and opinions of tourists towards air traffic. Virgin Galactic company plans its first test flight by the end of 2013, and is considered to be a pioneer of this kind of transport [8].
Literature overview
Researching preferences and attitudes of tourists towards certain types of transport was directed in two different tracks in scientific works.
The first category contains works where authors take the attitude of tourists as a starting point, a concrete result of using services of transport companies, to study the said relation. These services take place on the way to the destination, as well as during the stay on the final destination. Every stay in a transport vehicle provokes certain emotions, reactions in the tourists and influences their satisfaction of the provided service.
Qu and Li (1997) researched the degree of satisfaction and attitudes relating to public transport in Hong Kong in the segment of Chinese tourists from the interior of the country [9]. Studied aspects were reliability, cleanliness, comfort, efficiency, choice and price of service of city public transport. Thompson and Schofield (2007) conducted a similar research in Manchester, England, where they included the category of safety [10]. The goal of their research was to determine the attitudes of transport quality, and its influence o general satisfaction of stay in the county. The questionnaire consisted of 18 attributes, divided into 3 factor groups. Safety of the vehicle and transportation by public transport were placed in ―Efficiency and safety‖ group.
The second track of research takes its starting point the assumption that habits and model of human behavior are of the highest importance to the personal relation towards certain types of transport. This approach presumes that tourist-passenger attitudes are not based exclusively on the experiences that have already occurred. Attitudes are influenced by various factors, such as education, public information and social values.
Attitudes belong in the immeasurable factors, which are significantly different depending on the person, and for that reason it is impossible to determine general rules of influence on the decisions about travel.[11]
Influence of tourist awareness of the mode of travel has been researched by Garvill et al. (2003). During a terrain experiment they gathered information about opinions, habits and models of behavior of passengers via journals and questionnaires. Results have shown that decisions on the mode of transport have been made in accordance with their attitudes and habits.[12]
According to Innocenti (2013), models of behavior as a factor of influence on the choice of the mode of transportation, are based on the three following elements: recognition and inflow of information, influence of habits on tourist decisions and risk awareness in transport.[13]
The stated researches prove the existence of certain factors with potential tourists which influence their state of awareness, attitudes, and therefore, the decisions they make. In order to understand the behaviors and the possibility of their control, it is necessary to determine what those factors are and what is their influence on passenger attitudes and their relation with certain modes of transport. Each factor consists of a group of attributes which represent a certain cost or effort for tourists during travel (price, time, effort, discomfort and distrust). These groups make up the basis of the research of tourist behavior in scientific works [14]. The risk during travel, such as motion sickness, accidents, criminal behavior and terrorist attack represents another category of ―cost‖. These types of events can result in dissatisfaction, injury or even death of a passenger [15] [16]. Perception of risk and reaction to risk among people is not the same, but it depends on multiple factors: culture, personality and experience [17].
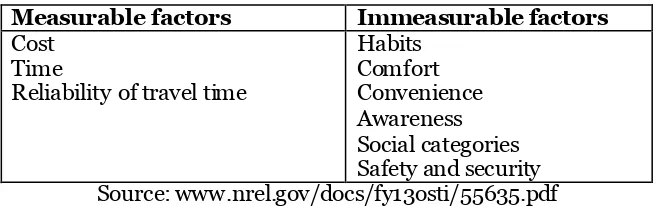
During decision making about the mode of transport to a tourist destination, the passengers take in consideration the time and money necessary as the most important categories. Secondary factors in decision making are personal attitudes about reliability, comfort, convenience and safety of the transport service. [11]
18
Table 1. Factors which influence decision making about travel
Measurable factors Immeasurable factors
Cost Time
Reliability of travel time
Habits Comfort Convenience Awareness Social categories Safety and security Source: www.nrel.gov/docs/fy13osti/55635.pdf
The focus of this work is the attitude of tourists towards the safety of certain types of transport, as one of the most significant factors in the process of decision making. According to a series of statistical research, airline transportation is the safest mode of transport. Due to specific technological characteristics and a lesser degree of awareness, airline transportation most often causes psychological barriers in passengers.
Research of a German Institute for Public Opinion (GIPOR) has determined that approximately 15% of population has a fear of flying, while approximately half of the subjects feel uneasy while on an airplane. Nervousness often happens even several weeks before the travel [19]. Analysis of attitudes will be conducted in parallel between persons that have traveled by airplane and persons that, up until the point of research, have not, in order to determine the influence of flying experience on the attitudes relating to the safety of this mode of transport.
The passengers can find an alternative mode of transport if the one chosen seems unsafe (e.g. the driver is of older age with eyesight problems, travel of a female individual by night train predominantly occupied by males). [11]
The influence of fear of flying on perception of safety
Moen (2007) researches passenger reactions on travel insecurity via three categories: distress, search for excitement and trust [17]. Results have shown that the most frequent reaction is distress, and that tourists are ready to pay more money for travel which they find safer. Carlsson et al. (2004) also dealt with the readiness of tourists to pay a higher price for transport [20]. Beforehand, they presented the examinees with objective facts about the risk of travel. The answers confirmed that the passengers would agree to a higher price if that would contribute to safer travel by plane, unlike travel by taxi. Weinstein (1989), finds that there are persons who think optimistically about the travel outcome to reduce stress before the travel [21]. Feischer, Tchetchik and Toledo (2012) find that the passengers, due to impossibility of introspection of safety characteristics of airline companies, deal with other flight details in order to reduce distress [22]. Authors conducted a questionnaire among students in Israel in order to establish the elements of airline transport which are influential to the perception of safety. The examinees were offered four interior fights for New York and London, each with different characteristics. Results have shown that passengers experience day time flights to be much safer and that with the increase of the ticket fear of flying proportionally decreases.
Medical research shows that it is possible to enable over 80% of patients to travel normally by airplane. Treatment procedure begins with determining the thoughts which cause fears in patients. After that, they are gradually exposed to flying, beginning with talking and ending in practice. [23]
19
In this research, Siomkos (2000) dealt with the affect of airline accidents on general public [24]. They determined that the accidents do not have too high influence on frequent flyers, considering that they are informed about general safety of airline transportation in relation to other modes of transport. Third of examinees declared that they avoid using services of those airline companies whose planes have participated in recent accidents.
Methodology
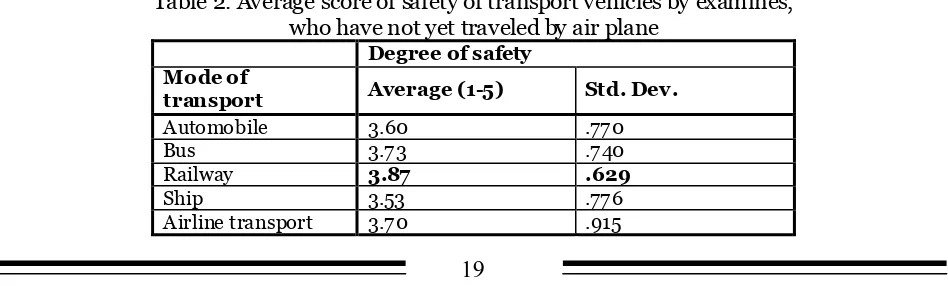
Methods used in gathering, processing and analysis of data as well as representation of research results are: historical, statistical, comparative, descriptive and field research (benchmarking). Data from examinees has been collected via written benchmarking, with previously constructed questionnaires. It consisted of two parts. The first part was intended to gather basic socio-demographic data, to research important but anonymous data (6 questions). The second part dealt with concrete questions from the field of safety of airline traffic (6 questions for persons which have not yet traveled by airplane and 6 for those that did, who also had additional 2 questions of informative character). Firstly, the examinees were to declare if they traveled by airplane up until that moment. Depending on the answer, they were redirected to appropriate fields of the questionnaire. In that way, the examinees were classified, which is necessary for this type of research. Therefore, comparative data analysis of parallel categories was enabled. In this segment, the examinees graded the safety of certain means of transport, through five point Likert scale. Ranges on the scale were marked as follows: 1- not safe at all, 2- partially not safe, 3- cannot assess, 4- partially safe, 5- completely safe. Benchmarking was conducted during April to June, 2011, and the collecting of samples has been conducted by accidental choice method. Data within research are collected directly, via the questionnaire. For analysis and representation of results, descriptive analysis, T-test and standard deviation were used. To process data IBM program packet for statistical processing SPSS 19.0 was used.
Results and discussion
When dealing with the division of examinees according to gender, it is important to accentuate that the test group consists of mostly females. The ratio is: men 33.3% and women 66.7%.
A large portion of the sample falls into group of 19-29 year olds, that make 79.4%, then other categories in the following order: 30-39 year olds, 10.8%, 60-69 year olds, 3.9%, 50-59 year olds, 2.9%, 70+ years categories is 2.0% and the smallest group is 40-49 year olds, 1%. It is important to mention the fact that there were no minors.
With educational classification of the examinees there is a slightly more equable dispersion. Also, data shows that there are examinees with primary school, whether it was completed or not. During the gathering process of field data, popular ―bologna process‖ of high education in Serbia was in its initial implementation phase, which often lead to changes in regulations but also in Law on higher education. Therefore, at the moment it seemed most logical to ask a question relating to this information in a way which would provide data about college and BA studies, as well as MA/magister studies. The most prevalent were persons with completed four year university education (BA), with 45.1%. The following category according to size was high school education 29.4%, followed by persons with MA or magister diploma 12.7%, college 11.8% and finally 1% of examinees had a PhD. Degree of education can be a significant component in the ability of reasonable and realistic thought, as well as distinctive weighing of all safety aspects in total.
Table 2. Average score of safety of transport vehicles by examines, who have not yet traveled by air plane
Degree of safety Mode of
transport Average (1-5) Std. Dev .
Automobile 3.60 .770
Bus 3.73 .740
Railway 3.87 .629
Ship 3.53 .776