VIETNAM NATIONAL UNIVERSITY – HOCHIMINH CITY INTERNATIONAL UNIVERSITY
SCHOOL OF BUSINESS
THE DETERMINANTS OF ONLINE SHOPPING
INTENTION ON MOBILE APPLICATIONS
AMONG VIETNAMESE CONSUMERS
In Partial Fulfillment of the Requirements of the Degree of
BACHELOR OF ARTS in BUSINESS ADMINISTRATION
Student’s Name: HOANG THI MY NHUNG
Student’s ID: BABAIU13201
Advisor: BUI QUANG THONG, Ph.D.
Ho chi minh City, Viet Nam
THE DETERMINANTS OF ONLINE SHOPPING
INTENTION ON MOBILE APPLICATIONS
AMONG VIETNAMESE CONSUMERS
APPROVED BY: Advisor
APPROVED BY: Committee,
_____________________
Bui Quang Thong, Ph.D
_______________________
________________________
________________________
ACKNOWLEDGEMENT
From the bottom of my heart, I would like to express my profound appreciation: First of all, to my devoted advisor - Ph. D Bui Quang Thong. Thank you for guiding and supporting me in the whole process of conducting this thesis by suggesting many valuable instructions and helping me have a comfortable mind to complete the study. Secondly, to all my lectures at the School of Business Administration of International University - Vietnam National University. Thank you for spending your time and effort to give many precious lessons to me and other students as well.
Thirdly, to all of my best frends in high school and university. Thank you for helping me to distribute the questionnaire and solve the problems occuring during the process of doing this thesis.
Last but not least, to all of my family members. Thank you for your overwhelming love and great care.
TABLE OF CONTENTS
ACKNOWLEDGEMENT ... iii
TABLE OF CONTENTS ...Error! Bookmark not defined. LIST OF TABLES ... vi
LIST OF FIGURES ... viii
ABSTRACT ... ix
ABBREVIATIONS ... xi
CHAPTER I ... 1
1.1 Research Background ... 1
1.2 Research Objectives ... 6
1.3 Research Questions ... 6
1.4 Significances of the Research ... 7
1.5 Research Scope ... 7
1.6 Research Structure ... 8
CHAPTER II ... 9
2.1 Online Shopping Intention on Mobile Applications ... 9
2.2 Factors Affecting Online Shopping Intention on Mobile Applications ... 9
2.2.1 Ease-of-access ... 9
2.2.2 Usefulness ... 10
2.2.3 Enjoyment ... 11
2.2.4 Anxiety ... 12
2.2.5 Price Value ... 12
2.2.6 Trust ... 13
2.3 Research Model ... 14
CHAPTER III ... 17
3.1 Research Design ... 17
3.2 Sample Size and Sampling Design ... 20
3.3 Questionaire Design ... 21
3.4 Pilot Study ... 25
3.5 Data Collection Procedure ... 25
3.6 Data Analysis Method ... 26
CHAPTER IV ... 28
4.1 Response Rate ... 28
4.2 Sample Demographic ... 28
4.2.1 Gender ... 29
4.2.2 Age ... 30
4.2.3 Job... 31
4.2.5 Frequency of shopping on mobile applications in recent 6 months of
respondents ... 32
4.2.6 Frequency of mobile application brands shopped by respondents ... 33
4.3 Descriptive Statistics ... 34
4.3.1 Descriptive Statistics of Ease-of-access to mobile shopping applications ... 34
4.3.2 Descriptive Statistics of Usefulness when using mobile shopping applications ... 35
4.3.3 Descriptive Statistics of Enjoyment when using mobile shopping applications ... 36
4.3.4 Descriptive Statistics of Anxiety when using mobile shopping applications ... 37
4.3.5 Descriptive Statistics of Price Value when using mobile shopping applications ... 38
4.3.6 Descriptive Statistics of Trust on mobile shopping applications ... 39
4.3.7 Descriptive Statistics of Online Shopping Intention on Mobile Applications . 40 4.4 Reliability Test ... 41
4.4.1 Reliability Test for Ease-of-access ... 42
4.4.2 Reliability Test for Usefulness ... 42
4.4.3 Reliability Test for Enjoyment ... 43
4.4.4 Reliability Test for Anxiety ... 44
4.4.5 Reliability Test for Price Value ... 45
4.4.6 Reliability Test for Trust ... 45
4.4.7 Reliability Test for Shopping Intention on Mobile Applications ... 47
4.4.8 Summary of the final Cronbach's Alpha for all factors ... 48
4.5 Exploratory Factor Analysis (EFA) ... 49
4.5.1 EFA for Independent Variables ... 50
4.5.2 EFA for Dependent Variables ... 58
4.6 Multiple Linear Regressison Analysis ... 59
4.6.1 Correlation Analysis between independent variables and dependent variables. ... 59
4.6.2 Regression Analysis ... 60
4.7 Revised research model ... 62
CHAPTER V ... 64
5.1 Conclusion ... 64
5.2 Recommendations ... 65
5.3 Limitations ... 67
REFERENCE ... 68
APPENDIX A ... 73
SURVEY QUESTIONNAIRE IN ENGLISH ... 73
SURVEY QUESTIONNAIRE IN VIETNAMESE ... 77
LIST OF TABLES
TABLE 1: MEASUREMENT ITEMS WITH SOME MODIFICATIONS 22
TABLE 2: VALID RESPONSE RATE 28
TABLE 3: PERSONAL INFORMATION OF RESPONDENTS 29
TABLE 4: FREQUENCY OF SHOPPING ON MOBILE APPLICATIONS IN RECENT 6 MONTHS 32
TABLE 5: FREQUENCY OF MOBILE APPLICATION BRANDS SHOPPED BY RESPONDENTS 33
TABLE 6: DESCRIPTIVE STATISTICS OF EASE-OF-ACCESS 35
TABLE 7: DESCRIPTIVE STATISTICS OF USEFULNESS 36
TABLE 8: DESCRIPTIVE STATISTICS OF ENJOYMENT 37
TABLE 9: DESCRIPTIVE STATISTICS OF ANXIETY 37
TABLE 10: DESCRIPTIVE STATISTICS OF PRICE VALUE 38
TABLE 11: DESCRIPTIVE STATISTICS OF TRUST 39
TABLE 12: DESCRIPTIVE STATISTICS OF ONLINE SHOPPING INTENTION ON MOBILE APPLICATIONS 40
TABLE 13: RULES OF THUMB FOR INTERPRETATION OF THE CRONBACH'S ALPHA 41
TABLE 14: RELIABILITY STATISTICS OF EASE-OF-ACCESS 42
TABLE 15: ITEM-TOTAL STATISTICS OF EASE-OF-ACCESS 42
TABLE 16: RELIABILITY STATISTICS OF USEFULNESS 43
TABLE 17: ITEM-TOTAL STATISTICS OF USEFULNESS 43
TABLE 18: RELIABILITY STATISTICS OF ENJOYMENT 43
TABLE 19: ITEM-TOTAL STATISTICS OF ENJOYMENT 44
TABLE 20: RELIABILITY STATISTICS OF ANXIETY 44
TABLE 21: ITEM-TOTAL STATISTICS OF ANXIETY 44
TABLE 22: RELIABILITY STATISTICS OF PRICE VALUE 45
TABLE 23: ITEM-TOTAL STATISTICS OF PRICE VALUE 45
TABLE 24: RELIABILITY STATISTICS OF TRUST 46
TABLE 25: ITEM-TOTAL STATISTICS OF TRUST 46
TABLE 26: RELIABILITY STATISTICS OF TRUST AFTER REJECTING ITEM TRU6 46
TABLE 27: ITEM-TOTAL STATISTICS OF TRUST AFTER REJECTING ITEM TRU6 47
TABLE 28: RELIABILITY STATISTICS OF SHOPPING INTENTION ON MOBILE APPLICATIONS 47
TABLE 29: ITEM-TOTAL STATISTICS OF SHOPPING INTENTION ON MOBILE APPLICATIONS 48
TABLE 30: SUMMARY OF THE FINAL CRONBACH'S ALPHA 48
TABLE 31: THE RULES OF THUMB TO INTERPRET THE VALUE OF KMO 49
TABLE 33: TOTAL VARIANCE EXPLAINED FOR INDEPENDENT VARIABLE OF FIRST ROUND 51
TABLE 34: ROTATED COMPONENT MARTRIXA FOR INDEPENDENT VARIABLES OF FIRST ROUND 53
TABLE 35: KMO AND BARTLETT'S TEST FOR INDEPENDENT VARIABLES OF FINAL ROUND 54
TABLE 36: TOTAL VARIANCE EXPLAINED FOR INDEPENDENT VARIABLE OF FINAL ROUND 55
TABLE 37: ROTATED COMPONENT MARTRIX FOR INDEPENDENT VARIABLES OF FINAL ROUND 57
TABLE 38: COMPONENT MATRIXA FOR DEPENDENT VARIABLE 58
TABLE 39: KMO AND BARTLETT'S TEST FOR DEPENDENT VARIABLE 58
TABLE 40: TOTAL VARIANCE EXPLAINED FOR DEPENDENT VARIABLE 59
TABLE 41: CORRELATIONS 60
TABLE 42: MODEL SUMMARY 61
TABLE 43: ANOVA 61
LIST OF FIGURES
FIGURE 1: VIETNAMESE CHANGES IN POPULATION, INTERNET USERS, AND MOBILE SUBSCRIPTION
FROM 2005 TO 2014 1
ABSTRACT
Nowadays, e-commerce market, especially mobile commerce market, is really potential in Vietnam. However, very few customers conduct online purchasing by their smartphones and tablets. In other words, the potential of mobile commerce market has not been promoted. To attract more people engaging online shopping on mobile devices, firstly, providers of mobile shopping services need to know the elements affect customer’s shopping intention and then carrying out interventions that change those affecting factors. Therefore, it is necessary to conduct a research about this problem. This study aims to investigate whether the following factors, which are ease-of-access, usefulness, enjoyment, anxiety, price value, and trust affect online shopping intention on mobile applications or not. Then, it tries to evaluate the degree of impact of each factor on shopping intention by mobile applications. Finally, from the collected results, it suggests practical implications to the system providers or retailers of mobile shopping applications to help them stimulate the consumers' buying intention.
Regards the way to collect data used for the research, a survey was carried out. Among 361 survey forms were distributed, there were 300 valid questionnaires that could be used to collect data. To test the correctness of proposed hypotheses and conceptual model, Multiple Regression Analysis approach was applied.
The final results proved that the consumers’' shopping intention on mobile applications is significantly affected by ease-of-access, enjoyment, price value, and trust. The remains, which are anxiety and usefulness, do not affect the shopping intention. Among those research factors having impact on shopping intention in this study, the price value plays as the most important determinant of online shopping intention on mobile applications. The second significant factor having influence on dependent variable is the trust of customers on mobile shopping applications. The third rank belongs to the effect of enjoyment on shopping intention. And the factor having least influence on online shopping intention on mobile applications is the ease-of-access.
intention on these applications. Then, they could effectively promote the online shopping, especially shopping on mobile applications, to potential purchasers and retain the existing clients.
Keywords Online shopping intention, Online shopping, Mobile shopping applications,
ABBREVIATIONS
EFA: Exploratory Factor Analysis KMO: Kaiser-Meyer-Olkin
CHAPTER I
INTRODUCTION
This chapter generally introduces the research topic, explain reasons of choosing this problem, and give an overall background about it. Besides, this part also mentions the research objective, research questions, significances of the research, research scope and the organization of the whole study.
1.1 Research Background
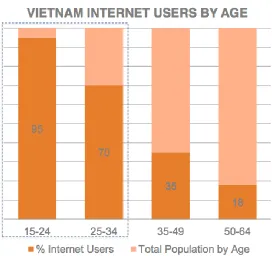
In recent years, the remarkable growth in the use of the internet and in the number of mobile phone users has led to a rivalled growth of mobile commerce. According to the survey about Viet Nam Digital Landscape 2015 of Moore Corporation, from 2005 to 2014, while the total population only approximately increased by 10 per cent, the number of internet users increased more than three times and the number of mobile subscription increased more than eight times. In which, the age group that most of people have used internet is 15 - 24, and 25 - 34 years' old (figure 2).
Figure 1: Vietnamese changes in population, internet users, and mobile
subscription from 2005 to 2014
Figure 2: The percentage of Vietnam internet users by age group in 2015
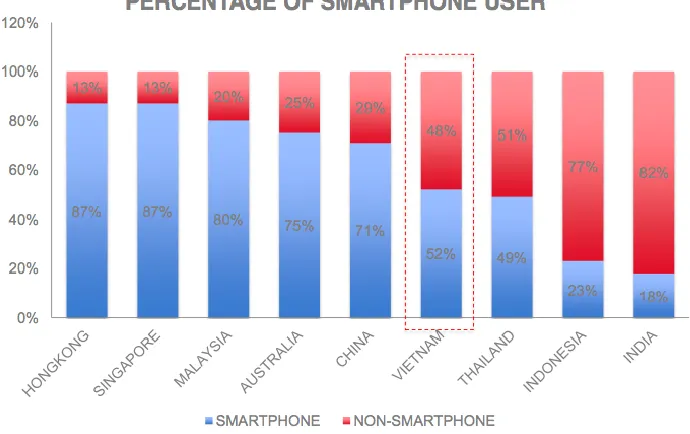
Figure 3: Percentage of smartphone user in 2015
Figure 4: Online activities people do on their smartphones in 2015
(Source: Moore Corporation, 2015) As regards the demographic information of online buyers in 2015, the survey about Viet Nam Digital Landscape 2015 of Moore Corporation concluded as the following: Firstly, 59 percent of online buyers were female; Secondly, the majority of online buyers were officer and student, which nearly accounted for 80 percent. The remains are business owner and other jobs. Another investigation, which came from Nielsen Global E-commerce Study in 2015, predicted that in 2016, the millennial generation, which their age from 21 to 34 years’ old, would be the key force shopping online.
Figure 5: The percentage of online buyers based on gender in 2015
Figure 6: The percentage of online buyers based on occupation in 2015
(Source: Moore Corporation, 2015)
Figure 7: The predictive percentage of online buyers in 2016 based on age group
In general, e-commerce market, especially mobile commerce market, is really potential in Vietnam. This development will bring benefits to both retailers and consumers. Hence, many retailers and providers have started to penetrate the mobile shopping market by design the shopping website and application with display is only suitable for smartphones and tablets along with promotion when using these services. However, currently, very few customers purchase goods and services online by their smartphones and tablets. In other words, the potential of mobile commerce market has not been promoted. To attract more people engaging online shopping on mobile devices, firstly, providers of mobile shopping services need to know the elements affect customer’s shopping intention and then carrying out interventions that change those affecting factors. Therefore, it is necessary to conduct a research about this problem. In this study, to be easy to conduct and complete the research in limited time, the research topic only relates to online shopping on mobile applications. Because of these convincing causes, the research topic for my graduation thesis is: "THE DETERMINANTS OF ONLINE SHOPPING INTENTION ON MOBILE APPLICATIONS AMONG
VIETNAMESE CONSUMERS"
1.2 Research Objectives
The aims of this research are:
- Finding out factors influencing the online shopping intention on mobile applications.
- Evaluating the degree of impact of each factor on intention of online shopping on mobile applications.
- Giving practical recommendations to the system providers of mobile shopping applications.
1.3 Research Questions
To achieve the aims of this research, two research questions are formulated as the following:
- How much does each factor influence the online shopping intention on mobile applications?
1.4 Significances of the Research
Foremost, the outcome of the research could help to resolve the objectives of the research. Secondly, it would help system providers of mobile shopping applications to recognize which elements impede or stimulate the customers' shopping intention on these applications. From these implications, they could effectively promote the online shopping, especially shopping on mobile applications, to potential purchasers and retain the existing clients. Last but not least, to carry out and complete this study, I have to find out from other previous researches about this topic. As a result, my knowledge and expertise in the research field and the online shopping segment will be widened. 1.5 Research Scope
1.6 Research Structure
The overall structure includes five main sections, which are introduction, literature review, methodology, data analysis and findings, conclusions and recommendations. The detail concent of each section is explained as the following:
- Chapter 1: Introduction
This chapter generally introduces the research topic, explain reasons of choosing this problem, and give an overall background about it. Besides, this part also mentions the research objective, research questions, significances of the research, research scope and the organization of the whole study.
- Chap 2: Literature Review
For the most chapter, it reviews concepts, theories, relations between independent and dependent variables from the previous researches associated with customers' purchasing intention on mobile allpications. More significantly, it also proposes the research model and hypotheses that will be applied in this study.
- Chapter 3: Methodology
This chapter presents the specific information of the research method, research design, the way to assemble data and analyse collected data. In addition, the criteria for choosing research sample and the questionnaire items are also provided in this part.
- Chapter 4: Data Analysis and Findings
This chapter refers to the process of summarising, analysing collected data from questionnaires. From the collected results, this part will explains the statistic numbers to get findings for the research and discussion of the results.
- Chapter 5: Conclusions and Recommendations
CHAPTER II
LITERATURE REVIEW
This chapter reviews concepts, theories, relations between independent and dependent variables from the previous researches associated with customers' purchasing intention on mobile allpications. More significantly, it also proposes the research model and hypotheses that will be applied in this study.
2.1 Online Shopping Intention on Mobile Applications
Shopping is a process of buying products or services (Peterson, Bal Subramanian, & Bronnenberg, 1997). According to Hsiao (2009), there are two types of shopping: physical store shopping and online shopping (or e-shopping). Specifically, according to Mokhtarian (2004), e-shopping refers to “searching for and/or purchasing consumer goods and services through the Internet”.
According to Ajzen (1991), intention is considered as an motivational element of behavior, and refers to the individual conscious attempt to perform a specified behavior. Based on the definition from Techopedia website, a mobile application, or app, is a technological software invented for mobile devices (including smartphones or tablets). As regards its functions, it provides similar services like website, however, it has some differences in display comparing with website. While website is mainly served for people using PCs, application is especially designed only for people using mobile devices. In conclusion, within the context of E-commerce, online shopping intention on mobile applications refers to an individual plan to purchase products or services via the Internet on the mobile applications by smartphones and tablets (Chen, Hsu, & Lin, 2010; Fygenson & Pavlou, 2006).
2.2 Factors Affecting Online Shopping Intention on Mobile Applications
2.2.1 Ease-of-access
According to Sivunen and Valo (2006), the ease-of-access is the level of availability and spread of this tool in the market. Moreover, Hsi-Peng Lu and Philip Yu-Jen Su (2009) argued that ease-of-access is relevant to the level to which a consumer could easily get connection with internet through mobile devices. It also mentiond that a high level of ease-of-access of a system owing two basic features, which are the presence and the trustworthiness of that system. The first characteristic refers to the availability of the system in the market which is perceived by the majority of consumers and the readiness to access the system for consumers anytime and anywhere. The second characteristic means that the system should have a good connection ensuring that customers do not need to connect that system many times or change their location to get a good access.
Relationship between Ease-of-access and Online Shopping Intention on Mobile
Applications
Many researches asserted that ease-of-access is considered as a vital determinant of intention to use as technological devices that are not complicated to connect and operate will be less intimidating to users (Mao et al., 2005; Ong et al., 2004). Moreover, Davis (1989) also presented that users tend to adopt a system that require less mental effort to use or acess. Lastly, Hsi-Peng Lu and Philip Yu-Jen Su (2009) stated that the a person evaluation about the needed effort paid to connect and use the online shopping will positively affect their intention to shop on internet. While this research topic is about shopping intention on mobile applications, shopping on mobile applications is similar to shopping on internet. Therefore, the following hypothesis is suggested that:
H1: Ease-of-access will positively affect online shopping intention on mobile
applications. 2.2.2 Usefulness
Definition
declared that usefulness is viewed as a fundamental motivating force for consumers to conduct their online transactions. Many other researches proved that usefulness plays as a main stimulation for consumer behavior to espouse the online shopping technology (Abu-Shamaa and Abu-Shanab, 2015; Wen et al., 2011).
Relationship between Usefulness and Online Shopping Intention on Mobile
Applications
Davis (1989) also insisted that people have a tendency to use or not use an application when they perceive it has an ability to assist them solve their work better. In addition, the Technology Acceptance Model (TAM) (David, 1989) suggested that people will go along with technological tool if they are convinced by its positive and effective performance. Moreover, many other previous researches' results supported the positive relationship between usefulness of online shopping and online shopping intention (Abu-Shamaa and Abu-Shanab, 2015; Wen et al., 2011). Hence, the following hypothesis is proposed:
H2: Usefulness will positively affect online shopping intention on mobile applications.
2.2.3 Enjoyment
Definition
Enjoyment is defined as the customers' direct experience of immediate pleasure and delight when using mobile devices to shopping (Lu and Yu‐Jen Su, 2009). According to Chu and Lu (2007), the enjoyment experienced by users plays as a key driver in customer's mind to perform an activity. For example, the making decision of buying online music is motivated by perceived playfulness. While Venkatesh (1999) discovered that the high degree of intrinsic factors will be the motive power to maintain a prolonged intention to use information technology software. In which, intrinsic factors refer to playfulness, pleasure and the awards achieved when performing particular action (David et al., 1992).
Relationship between Enjoyment and Online Shopping Intention on Mobile
Applications
be related to playfulness, pleasure and the awards achieved when performing particular action. From Lu and Yu‐Jen Su (2009), enjoyment is regarded as an elementary factor having positive impacts on online shopping intention because customers can experience pleasure and entertainment while searching for products and services on mobile internet with a wide range of online display media, such as product descriptions, pictures, background music, videos, and games. Based on these conclusions, the following hypothesis is proposed:
H3: Enjoyment will positively affect online shopping intention on mobile applications.
2.2.4 Anxiety
Definition
According to Compeau, Higgins & Huff (1999), anxiety refers to the negative emotions, and the feelings of fearfulness and worry. According to Lu and Yu‐Jen Su (2009), anxiety related to information technology, which is the above feelings, occurred when people perform behaviors interacting with mobile shopping services. These negative emotions usually appear because users imagine in their mind or experience in reality.
Relationship between Anxiety and Online Shopping Intention on Mobile
Applications
Several previous researches have investigated that anxiety negatively affect the information technology adoption (Compeau et al., 1999; McFarland and Hamilton, 2006). Igbaria and Iivari (1995) have stated that “individuals who experience high levels of anxiety are likely to behave more rigidly than individuals whose level of anxiety is relatively low”. In other words, people usually keep away from performing behaviors invoking the feelings of anxiety (Compeau and Higgins, 1995). Therefore, the following hypothesis is proposed:
H4: Anxiety will negatively affect online shopping intention on mobile applications.
2.2.5 Price Value
Definition
using them”. Some previous researches in related areas such as wearable technology (Gao et al., 2015), mobile internet (Wang et al., 2010), mobile health (Dwivedi et al., 2015) has proved the important impact of this factor on usage intention. In particular, in the internet shopping market, the influence of price value on customers' purchasing intention is strong. It is because with the available information from different sources, to compare the paid cost and the perceived value, customers only need to click and make a decision without any effort (Kim et al., 2012).
Relationship between Price Value and Online Shopping Intention on Mobile
Applications
In terms of mobile shopping, the financial cost for owning smartphones or tablets and the fee for connecting the internet service might hinder the shopping intention on mobile applications. Hence, when the benefits received from shopping on mobile applications are more significant than the perceived cost paid, consumers tend to have the intention to use it (Venkatesh et al., 2012). Thus, the following hypothesis is suggested:
H5: Price value will positively affect online shopping intention on mobile applications.
2.2.6 Trust
Definition
According to Jøsang et al. (2007), the meaning of trust varies depending on each related concept. Therefore, there are many definitions of trust which develops over time. One of the famous notion of online trust came from Corritore et al. (2003), which stated that the degree of confidence in situation that when meeting a risk on internet, the possibility that person can be attacked or harmed will not occur. Many previous researches pointed out that consumers, who do not have enough online trust, are those people who are not willing to purchase products and services online (Pavlou et al., 2007; Park et al., 2012). Relationship between Trust and Online Shopping Intention on Mobile
Applications
between this factor and internet shopping intention because the formation of trust factor is really important for the develop of online shopping. Some other reserches have drawn the conclusion that trust straight impacts the shopping intention on mobile applications for both existing consumers and potential consumers (Lu et al., 2012; Faqih, 2011). Based on the above discussion, the following hypothesis is proposed:
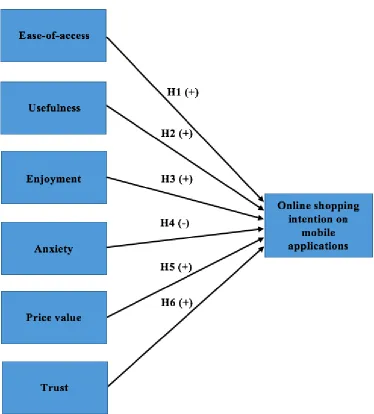
H6: Trust will positively affect online shopping intention on mobile applications.
2.3 Research Model
Figure 8: Research Model
H1: Ease-of-access will positively affect online shopping intention on mobile
applications.
H2: Usefulness will positively affect online shopping intention on mobile applications.
H3: Enjoyment will positively affect online shopping intention on mobile applications.
H4: Anxiety will negatively affect online shopping intention on mobile applications.
H5: Price value will positively affect online shopping intention on mobile applications.
CHAPTER III
METHODOLOGY
This chapter presents the specific information of the research method, research design, the way to assemble data and analyse collected data. In addition, the criteria for choosing research sample and the questionnaire items are also provided in this part.
3.1 Research Design
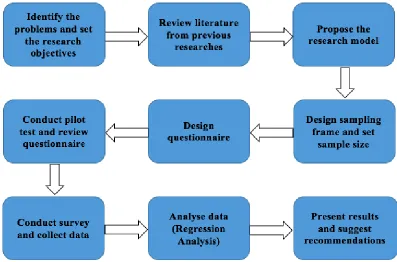
The figure 9 describes the research process of this study including nine main steps. These steps are orderly explained as the following:
- Identifying the problems and setting the research objectives. - Reviewing literature from previous researches.
- Proposing the research model.
- Designing sampling frame and setting sample size for survey. - Designing questionnaire form.
- Conducting pilot test and reviewing questionnaire form. - Conducting survey and collecting data.
- Analysing collected data.
Figure 9: Research Process
hypotheses. Unlike deductive approach, the latter method try to build the conceptual theory by beginning with the detailed evidence or observation.
specific numbers. In relating to an academic terms, the research methods being suitable for this study are deductive approach and quantitative research.
3.2 Sample Size and Sampling Design
As stated by Gorsuch (1983) and Hatcher (1994), because Exploratory Factor Analysis is used to test validity of the scale, the size of sample should comply with the criterion is that at the minimum, the number of variables per the number of total items satisfies the proportion of five to one. The measurement scale totally has 31 items. By this rule, the compulsory sample size reaches 155 respondents. However, Comfrey and Lee (1992) argued that to achieve a fair and good sequel after researching, the number of respondents should be 200 and 300 respectively. Hence, the sample size of this study is approximately 300 respondents.
As regards the sampling techniques, due to limited time, budget and geographic approach capability, this research will conduct on the convenience sampling, it also called as haphazard, accidental, or availability sampling. According to Neuman (2006), the advantages belonging to this kind of sampling is the high level of ease to attain and access the respondents. Besides, the financial budget using for availability sampling is low, even free. Therefore, with the purpose serving for academic project and the limited conditions, the convenience sampling is the most suitable sampling technique for this study. Concerning the way to distribute questionnaire to respondents, the questionnaire will have two forms: paper questionnaire and onine questionnaire. The paper questionnaire will be directly distributed to targer respondents at specific locations. Besides, the online questionnaire will be sent to surveyed through their individual email and social network like Facebook or Zalo.
University, and the office building at 119 Dien Bien Phu street, Da Kao ward, District 1, Ho Chi Minh City.
3.3 Questionaire Design
The questionnaire survey encompasses three parts, which are selective questions, main questions, and personal information of respondents.
The first part is named selective questions. The purpose of this question is to eliminate
unqualified respondents who never use mobile applications to shop before. Moreover, it also provides the respondents' basic information about the rate of occurence of shopping by mobile applications in recent period and specific brands of mobile applications that respondents used to shop. To be more specific, it comprises three questions. The first question is that: "Have you ever shopped online on mobile applications?". In this question, if the answer is yes, respondents will continue to complete the survey. On the other hand, if the answer is no, respondents will immediately finish the questionnaire. The second question is that: "In recent six months, how many times did you use mobile applications to shop?". The last question of the first part is that: " Which mobile applications do you usually use to shop?". With regard to this question, respondents can simultaneously choose many different brands of shopping applications or list names of other brands that they shopped by themselves. The second part is considered as the core of questionnaire as it includes all main
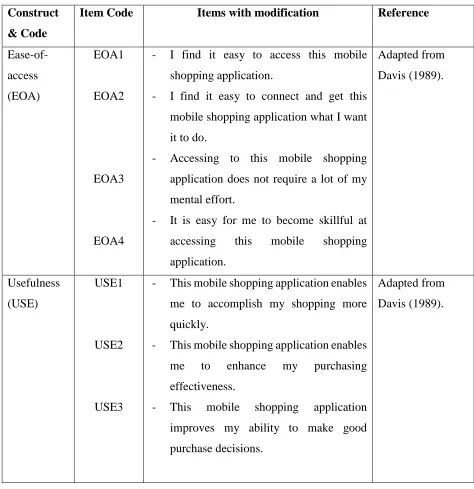
et al., (2012), and Pavlou (2003). All questions will be evaluated by using five-point Likert scale (ranging from 1 to 5), which is evaluated as the following: "1 - strongly disagree", "2 - disagree", "3 - neutral", "4 - agree", "5- strongly agree". The below table specifically presents the measurement items used in the survey with some modifications along with its code and source.
Table 1: Measurement Items with some modifications
Construct
& Code
Item Code Items with modification Reference
Ease-of-access (EOA) EOA1 EOA2 EOA3 EOA4
- I find it easy to access this mobile shopping application.
- I find it easy to connect and get this mobile shopping application what I want it to do.
- Accessing to this mobile shopping application does not require a lot of my mental effort.
- It is easy for me to become skillful at accessing this mobile shopping application. Adapted from Davis (1989). Usefulness (USE) USE1 USE2 USE3
- This mobile shopping application enables me to accomplish my shopping more quickly.
- This mobile shopping application enables me to enhance my purchasing effectiveness.
- This mobile shopping application improves my ability to make good purchase decisions.
USE4 - I find this mobile shopping application useful for online transactions.
Enjoyment (ENJ)
ENJ1
ENJ2
ENJ3
- Using this mobile application to shop is fun.
- Using this mobile application to shop is enjoyable.
- Using this mobile application to shop is very entertaining.
Adapted from Venkatesh et al., (2012). Anxiety (ANX) ANX1 ANX2 ANX3 ANX4
- I feel apprehensive about using this mobile shopping application for purchase.
- It scares me to think that I could cause my mobile devices to destroy a large amount of information by hitting the wrong key when shopping online on this mobile application.
- Using this mobile shopping application is somewhat intimidating me.
- I have avoided using this mobile shopping application because it is unfamiliar to me.
Adapted from Meuter et al.
(2003) and
Compeau et al. (1999). Price Value (PRI) PRI1 PRI2 PRI3 PRI4
- Using this mobile application to shop is reasonably priced.
- Shopping on this mobile application is a good value for the money.
- At the current price, shopping on this mobile application provides a good value.
- When using this mobile shopping application, I compare the prices of
Adapted from Venkatesh et al.
(2012) and
PRI5
different brands to be sure I get the best value for the money.
- I always check prices at this mobile shopping application to be sure I get the best value for the money I spend.
Trust (TRU) TRU1 TRU2 TRU3 TRU4 TRU5 TRU6
- I feel safe in my transactions with this mobile shopping application.
- I trust this mobile shopping application to keep my personal information safe. - I trust the administrators of this mobile
shopping application will not misuse my personal information.
- I believe in the information this mobile shopping application provides.
- Based on my perception of this mobile shopping application, I know it is not opportunistic.
- There are negative outcomes on this mobile shopping application.
Adapted from Loiacono et al. (2002), Koufaris and Hampton- Sosa (2004), Pavlou (2003), and Gefen et al. (2003).
Online Shopping Intention on Mobile Applications (INT) INT1 INT2 INT3 INT4 INT5
- I intend to shop on this mobile shopping application.
- I will always try to shop on this mobile shopping application.
- I plan to shop on this mobile shopping application.
- I will strongly recommend this mobile shopping application to others.
- If I have accessed to this mobile shopping application, I want to use it as much as possible.
The final part, which is personal information, requires the respondents to provide their
demographic information such as: gender, age, occupation, monthly income or allowance.
3.4 Pilot Study
Before the questionnaire is officially distributed to target respondents, pilot test is necessary to conducted to assess the capacity of the questionnaire form, identify the shortcomings associated with survey, and predict the minimum time needed to carry out the survey (Iarossi, 2006). Pilot test need only a small sample size, about 15 to 25 respondents are enough (Aaker et al., 2006). Hence, the pilot test of this study is implemented with 20 target respondents. Because of the very small sample size of pilot test, data collected from this test is not enough to fully analyse data by statistical software, it still bring an overall view about the questionnaire to check whether the proposed questions are easy to understand by respondents or not. From that, researcher could review and correct questionnaire to complete the official form.
3.5 Data Collection Procedure
As regards the time to deliver questionnaire to students, it is provided in the break time of the class of Mr. Bui Quang Thong named Business Research Methods on Thursday afternoon and two others named Business Game on Thursday morning and Saturday morning. To ensure the quality of collected data about objectivity, reliability, and validity, Mr. Bui Quang Thong agreed to help me by give bonus point to students doing the questionnaire. The others were distributed during the midday break at library of the above universities. With these respondents, to encourage them to objectively complete the questionnaire, they will receive useful documents about learning English or designing slide through their individual email. Besides, the online questionnaire will be sent to surveyed through their individual email and social network like Facebook or Zalo. The duration distributing questionnaire and collecting enough the required number of questionnaires lasted about two continuous weeks, which was from Apr 6th to Apr 20th.
3.6 Data Analysis Method
CHAPTER IV
DATA ANALYSIS AND FINDINGS
This chapter refers to the process of summarising, analysing collected data from questionnaires. From the collected results, this part will explains the statistic numbers to get findings for the research and discussion of the results.
4.1 Response Rate
From April 6𝑡ℎ to Apr 20𝑡ℎ, 361 survey forms were distributed to the subjects. In particular, there were 156 online surveys and 205 paper questionnaires. However, only 300 question sheets are considered as qualified data because of the following reasons. Firstly, about 11% of respondents (including 40 question sheets) have not yet used mobile shopping applications. The other reason is that the remains, which accounts for 6% of total respondents (including 21 question sheets), did not complete all the questions or answered with a little amount of variance. Hence, the percentage of valid collected questionnaires is approximately 83%.
Table 2: Valid Response Rate
FREQUENCY PERCENT
INVALID 61 16.90
VALID 300 83.10
TOTAL 361 100.00
4.2 Sample Demographic
Table 3: Personal information of respondents
DETAIL FREQUENCY PERCENT
GENDER Male 95 31.7
Female 205 68.3
AGE
15 - 18 3 1
19 - 25 284 94.7
26 - 30 7 2.3
31 - 35 3 1
> 35 3 1
JOB
Students 254 84.7
Executives
(Engineer, Doctor, Teacher,...) 5 1.7
Office Executives 33 11
Others 8 2.7
INCOME
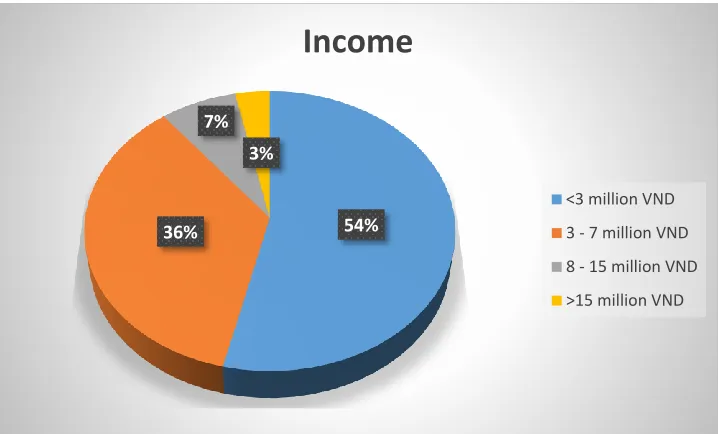
<3 million VND 161 53.7
3 - 7 million VND 107 35.7
8 - 15 million VND 22 7.3
>15 million VND 10 3.3
4.2.1 Gender
Figure 10: The percentage of respondents' gender
4.2.2 Age
The pie chart displays the respondents' age groups according to percentage. In which, the majority is the group of respondents with the age from 19 to 25 years old, which accounts for 95% of total respondents. The second highest group makes up for 2% of total respondents, which is the group of 26 - 30 years olds. Three others are the group of 15 - 18, 31 - 35, and more than 35. In which, each group makes up an equal proportion, which is 1% of total.
Figure 11: The percentage of respondents' age group
68% 32%
Gender
Female
Male
95% 2%
1% 1% 1%
Age Group
19 - 25
26 - 30
31 - 35
> 35
4.2.3 Job
The following characteristic is the current job of respondents. As being shown in the diagram, the greatest group is constituted by students accounting for 84% of total respondents. Besides, the office executives makes up for 11% of total, and the executives (including engineer, doctor, teachers,...) accounts for only 2% of total. The last is the other jobs, which accounts for 3% of total.
Figure 12: The percentage of respondents' job
4.2.4 Income
The respondents' income are divided into 4 groups comprising lower than 3 million VND, from 3 to 7 million VND, from 8 to 15 million VND, and more than 15 million VND. As can be seen from the chart, more than 50% of respondents has the income with lower than 3 million VND. The second highest income level is from 3 to 7 million VND, which makes up for 36%. Two other groups are from 8 to 15 million VND and more than 15 million VND account for 7%, and 3% respectively.
84% 11% 2%
3%
Job
Students
Office Executives
Executives (Engineer, Doctor, Teacher,...)
Figure 13: The percentage of respondents' income
4.2.5 Frequency of shopping on mobile applications in recent 6 months of
respondents
In recent 6 months, the number of times customers using mobile application to meet their demand can be classified into 5 main categories as the following: 0, 1 - 3 times, 4 - 6 times, 7 - 9 times, and equal or larger than 10 times. In which, the percentage for each group approximately is 62% for 1 - 3 times, 21% for 4 - 6 times, 5% for 7 - 9 times, 5% for equal or more than 10 times, and the remains for 0. It can be conluded that 1 - 3 times is the most common level of frequency that respondents purchase goods or services in latest 6 months.
Table 4: Frequency of shopping on mobile applications in recent 6 months
DETAIL FREQUENCY PERCENT
FREQUENCY
OF
SHOPPING
0 17 5.7
1 - 3 times 187 62.3
4 - 6 times 64 21.3
7 - 9 times 16 5.3
>=10 times 16 5.3
54% 36%
7% 3%
Income
<3 million VND
3 - 7 million VND
8 - 15 million VND
4.2.6 Frequency of mobile application brands shopped by respondents
The below table presents the overall view of mobile application brands that are used commonly by customers. In this section, each respondent can simultaneously choose one or multiple brands. Therefore, the total frequency of these brands is different from 300. From the statistics, the most popular brands in Vietnamese market are Tiki, Lazada with the amount of suggestions for each is around 180/300. Some other applications mentioned by respondents are Shopee, CGV Cinemas, Hotdeal, Cungmuam Adayroi, Lotte, Amazon, Zalora, Ebay, Zara, Hasaki, Sendo, Agoda, Yes24, Lotte Cinema, Sephora, and Taobao, ...
Table 5: Frequency of mobile application brands shopped by respondents
NAME FREQUENCY VALID
PERCENT
CUMULATIVE
PERCENT
Tiki 182 31.22 31.22
Lazada 181 31.05 62.26
Shopee 50 8.58 70.84
CGV
Cinemas 39 6.69 77.53
Hotdeal 35 6.00 83.53
Cungmua 31 5.32 88.85
Adayroi 23 3.95 92.80
Lotte 15 2.57 95.37
Amazon 7 1.20 96.57
Zalora 6 1.03 97.60
Ebay 3 0.51 98.11
Zara 2 0.34 98.46
Hasaki 2 0.34 98.80
Sendo 2 0.34 99.14
Agoda 1 0.17 99.31
Lotte Cinema 1 0.17 99.66
Sephora 1 0.17 99.83
Taobao 1 0.17 100.00
TOTAL 583 100.00
4.3 Descriptive Statistics
The objective of descriptive statistics is to summarize the general characteristics of respondents' evaluations towards each researched aspect of purchasing goods and services on mobile applications. In this analysis, there are two significant values namely mean and standard deviation. Particularly, mean shows the central value of each factor on the scale from 1 to 5, which shows the respondents' point of view to this factor. While standard deviation measures the distribution of values surrounding the mean. Specifically, the lower standard deviation, the lower different between the value that respondents choose and the mean.
4.3.1 Descriptive Statistics of Ease-of-access to mobile shopping applications
Table 6: Descriptive Statistics of Ease-of-access
N Mean Std.
Deviation
Average
Mean
EOA1 (I find it easy to access this mobile
shopping application). 300 4.00 0.881
3.94 EOA2 (I find it easy to connect and get this
mobile shopping application what I want it to do).
300 3.89 0.880
EOA3 (Accessing to this mobile shopping application does not require a lot of my mental effort).
300 3.84 0.975
EOA4 (It is easy for me to become skillful at
accessing this mobile shopping application). 300 4.02 0.905
Valid N (listwise) 300
4.3.2 Descriptive Statistics of Usefulness when using mobile shopping applications
Table 7: Descriptive Statistics of Usefulness
N Mean Std.
Deviation
Average
Mean
USE1 (This mobile shopping application enables me to accomplish my shopping more quickly).
300 3.94 0.936
3.78 USE2 (I find this mobile shopping application
useful for online transactions). 300 3.92 0.898 USE3 (This mobile shopping application
enables me to enhance my purchasing effectiveness).
300 3.69 0.958
USE4 (This mobile shopping application improves my ability to make good purchase decisions).
300 3.56 0.998
Valid N (listwise) 300
4.3.3 Descriptive Statistics of Enjoyment when using mobile shopping applications
Table 8: Descriptive Statistics of Enjoyment
4.3.4 Descriptive Statistics of Anxiety when using mobile shopping applications
Overall, the respondents' level of agreement towards this variable is lower than neutral degree as its average mean only equals 2.54. Hence, it is obvious that respondents shows the disagreement with the anxiety when shopping by applications. The range of mean value fluctuates from 2.24 to 2.92. The lowest mean value is 2.24, which belongs to ANX4 stating that respondents avoided using mobile applications due to the unfamiliarity with these shopping applications. The highest mean value is 2.92, which belongs to ANX1 asserting that it scares respondents to think that they could cause their mobile devices to destroy a large amount of information by hitting the wrong key when shopping online on the mobile applications. The remains, which are ANX2 and ANX3, has the mean value equaling 2.92 and 2.45, respectively.
Table 9: Descriptive Statistics of Anxiety
N Mean Std.
Deviation
Average
Mean
ANX1 (I feel apprehensive about using this
mobile shopping application for purchase). 300 2.53 0.844
2.54 ANX2 (It scares me to think that I could
cause my mobile devices to destroy a large amount of information by hitting the wrong
300 2.92 1.030
N Mean Std.
Deviation
Average
Mean
ENJ1 (Using this mobile application to shop
is fun). 300 3.66 0.796
3.60 ENJ2 (Using this mobile application to shop
is enjoyable). 300 3.70 0.867
ENJ3 (Using this mobile application to shop
is very entertaining). 300 3.45 0.926
key when shopping online on this mobile application).
ANX3 (Using this mobile shopping
application is somewhat intimidating me). 300 2.45 0.951 ANX4 (I have avoided using this mobile
shopping application because it is unfamiliar to me).
300 2.24 0.908
Valid N (listwise) 300
4.3.5 Descriptive Statistics of Price Value when using mobile shopping
applications
The range of value mean varies from 3.43 to 4.01. It shows that respondents have both neutral opinions and agreement with all items of this factor. With the mean value is 3.70, it generally reflects that respondents hold an agreement with this variable. The item PRI5 having the highest mean value (4.01) is agreed by respondents. On the other hand, the item PRI2 having the lowest mean value (3.43) receives the neutral evaluations from respondents. Three others' mean values of PRI1, PRI3, PRI4 are 3.57, 3.51, 3.98 respectively.
Table 10: Descriptive Statistics of Price Value
N Mean Std.
Deviation
Average
Mean
PRI1 (Using this mobile application to shop is
reasonably priced). 300 3.57 0.809
3.70 PRI2 (Shopping on this mobile application is
a good value for the money) 300 3.43 0.809
PRI3 (At the current price, shopping on this
mobile application provides a good value). 300 3.51 0.791 PRI4 (When using this mobile shopping
brands to be sure I get the best value for the money).
PRI5 (I always check prices at this mobile shopping application to be sure I get the best value for the money I spend).
300 4.01 0.894
Valid N (listwise) 300
4.3.6 Descriptive Statistics of Trust on mobile shopping applications
Among the measurement items of trust factor, there is one noticeable point is that item TRU6 is a reverse question. Thus, when inputting data, the scale of this question will be converted as the following: 1 into 5, 2 into 4, and vice versa. According to the result, the fluctuation range of mean value is between 3.07 and 3.48. The item TRU6, which expresses that shopping by mobile applications could cause some negative outcomes, has the lowest mean value (3.07). While the mean value of item TRU4 is highest (3.48) asserting that respondents believe in the information mobile applications provides. The remains' mean values is 3.43, 3.31, 3.25, and 3.30 belonging to item TRU1, TRU2, TRU3, and TRU5 respectively. The average value mean for all items is 3.31, which proves that respondents hold a neutral evaluation to this factor.
Table 11: Descriptive Statistics of Trust
N Mean Std.
Deviation
Average
Mean
TRU1 (I feel safe in my transactions with this
mobile shopping application). 300 3.43 0.825
3.31 TRU2 (I trust this mobile shopping
application to keep my personal information safe).
300 3.31 0.838
TRU3 (I trust the administrators of this mobile shopping application will not misuse my personal information).
TRU4 (I believe in the information this
mobile shopping application provides). 300 3.48 0.836 TRU5 (Based on my perception of this
mobile shopping application, I know it is not opportunistic).
300 3.30 0.915
TRU6 (There are negative outcomes on this
mobile shopping application). 300 3.07 0.954
Valid N (listwise) 300
4.3.7 Descriptive Statistics of Online Shopping Intention on Mobile Applications
Generally, the average mean value of intention to shop on mobile applications is 3.61. It means that respondents tend to agree with this variable. The mean value of each item fluctuates from 3.36 to 3.82. The highest mean value (3.82) is achieved by item INT1, which presents that respondents intend to shop on applications. The item INT5 reaches the lowest mean value (3.36), it explains that respondents have the neutral opinion of using mobile shopping applications as much as possible. The other items are INT2, INT3, and INT4 having mean value equalling 3.75, 3.63, and 3.48 respectively.
Table 12: Descriptive Statistics of Online Shopping Intention on Mobile
Applications
N Mean Std.
Deviation
Average
Mean
INT1 (I intend to shop on this mobile
shopping application). 300 3.82 0.744
3.61 INT2 (I will always try to shop on this mobile
shopping application). 300 3.75 0.789
INT3 (I plan to shop on this mobile shopping
application). 300 3.63 0.813
INT4 (I will strongly recommend this mobile
INT5 (If I have accessed to this mobile shopping application, I want to use it as much as possible).
300 3.36 0.935
Valid N (listwise) 300
4.4 Reliability Test
This reliability test is conducted to check the internal consistency of a set of items for each variable. Before running Exploratory Factor Analysis, this test is a must to eliminate failed item based on the vital coefficient called Cronbach's Alpha. Particularly, Cronbach's Alpha is a coefficient measuring the strength of reliability (or consistency) of all items in each factor. The higher correlation among items of each construct is, the higher Cronbach's Alpha is. The criteria to check the reliability and eliminate failed items in this test are as the following :
- Firstly, as stated by Geogre and Mallery (2003), the rules of thumb for alucidating the value of Cronbach's Alpha is illustrated in the below table:
Table 13: Rules of thumb for interpretation of the Cronbach's Alpha
Cronbach's alpha Evaluation of consistency
𝛼 > 0.9 Excellent
0.9 > 𝛼 ≥ 0.8 Good
0.8 > 𝛼 ≥ 0.7 Acceptable
0.7 > 𝛼 ≥ 0.6 Questionable
0.6 > 𝛼 ≥ 0.5 Poor
0.5 > 𝛼 Unacceptable
4.4.1 Reliability Test for Ease-of-access
The first factor to check the reliability test is the ease-of-access. As can be seen from table 13, the Cronbach's Alpha of this factor is 0.903. According to the rules of thumb, this value is viewed as excellent number. It means that all items of factor ease-of-access have a strong correlation with each other. Moreover, with the results from the table of Item-Total Statistics, we can conclude that 0.903 is the best Cronbach's Alpha in this test because there is no value of Cronbach's Alpha when an item rejected that is larger than the initial value. Hence, no items is eliminated from this factor.
Table 14: Reliability Statistics of Ease-of-access
Table 15: Item-Total Statistics of Ease-of-access
4.4.2 Reliability Test for Usefulness
Table 16: Reliability Statistics of Usefulness
Table 17: Item-Total Statistics of Usefulness
4.4.3 Reliability Test for Enjoyment
The next factor is the enjoyment. This factor has the Cronbach's Alpha equaling 0.840, which is a good value or the factor is reliable. All items in this scale are maintained as no Cronbach's Alpha if Item deleted is higher than the current value of Cronbach's Alpha.
Table 19: Item-Total Statistics of Enjoyment
4.4.4 Reliability Test for Anxiety
In respect of anxiety, the Cronbach's Alpha achieves 0.779. It is considered as an acceptable value. It means that this scale has a good internal consistency. Besides, it does not need to eliminate any item from the scale to raise the magnitude of Cronbach's Alpha.
Table 20: Reliability Statistics of Anxiety
4.4.5 Reliability Test for Price Value
As regards price value, the Cronbach's Alpha reaches 0.844. It can be concluded that the scale has a good consistency and all items of this factor has a strong correlation. In addition, no items need to be deleted because all items meet the qualifications.
Table 22: Reliability Statistics of Price Value
Table 23: Item-Total Statistics of Price Value
4.4.6 Reliability Test for Trust
Table 24: Reliability Statistics of Trust
Table 25: Item-Total Statistics of Trust
After rejecting item TRU6 from the scale, we get the new result of the Cronbach's Alpha as the below tables. The new value of Cronbach's Alpha is better than the initial value, which is 0.892 > 0.802. Furthermore, the values of Corrected Item - Total Correlation of all items are greater than 0.3.
Table 27: Item-Total Statistics of Trust after rejecting item TRU6
4.4.7 Reliability Test for Shopping Intention on Mobile Applications
In regard to dependent variable, we have shopping intention on mobile applications. The Cronbach's Alpha of this factor is 0.874, which is viewed as good value. It also proves the strong reliability and correlation among 5 items of this factor. Besides, all items are kept the same as beginning, since the Corrected Item - Total Correlation of all items are greater than 0.3 and there is no any item deleted causing an increase in value of Cronbach's Alpha.
Table 29: Item-Total Statistics of Shopping Intention on Mobile Applications
4.4.8 Summary of the final Cronbach's Alpha for all factors
Table 30: Summary of the final Cronbach's Alpha
applications are 0.842, 0.840, 0.844, 0.892, and 0.874 respectively. In which, one item of factor trust is rejected due to the increase in value of Cronbach's Alpha when this item eliminated, which is TRU6.
4.5 Exploratory Factor Analysis (EFA)
After checking the reliability, EFA is carried out to test the validity of scale and seperate the variables into different groups, in which each group includes intercorrelated factors. The criteria need to be considered when analysing the results of EFA:
- The first aspect need to be checked is the value of KMO. The rules of thumb to interpret this value is explained in the following table (Kaiser, 1974):
Table 31: The rules of thumb to interpret the value of KMO
- Secondly, as regards examining the null hypotheses H0, Bartlett's Test is in charge of this. Based on the results, the null hypotheses will be rejected if the value of significant level is less than 0.05. It means that the significant value must be lower than 0.05. (sig. < 0.05)
- The third standard is the eigenvalues must be higher than 1 and Total Variance Explained must be greater than 50%. Therefore, the number of eigenvalues which is higher than 1 equals the number of variables which is valid in the proposed model.
4.5.1 EFA for Independent Variables
To run EFA for Independent Variables, Varimax Rotation and Principle Component Analysis are applied. This study totally has six Independent Variables including ease-of-access, usefulness, enjoyment, anxiety, price value, and trust. Three following tables present the results of running EFA for these independent variables.
Table 34: Rotated Component Matrix for Independent Variables of first round
that there are only five variables kept in the model. In addition, the Total Variance Explained is 67.375% > 50%, which indicates the EFA is qualified. However, the factor loadings of item USE3 is not satisfied as it did not present the value of factor loadings for this item. Moreover, as regards the group items of factor usefulness (USE), instead of belonging to one different group, USE1 and USE2 belong to group of factor ease-of-access, and USE 4 belongs to group of factor Enjoyment.Therefore, to keep exactly five factors, researcher decide to delete the items that belong to other factors, and the items that having factor loadings do not satisfy the condition. In particular, after 4 times of running EFA to eliminate unsatisfied items from the test, we collect the results in these below tables.
Table 37: Rotated Component Matrix for Independent Variables of final round
value is appropriate, which equals 0.000 < 0.05. Moreover, there are five Eigenvalues higher than 1. Besides, there is an increase in value of the Total Variance Explained, which equals 70.105% > 50%. It means that the EFA is significant. Last but not least, there are five independent variables maintained in the model with all the factor loadings of each item greater than 0.5. The remained factors are ease-of-access, enjoyment, anxiety, price value, and trust. The eliminated factor is usefulness.
4.5.2 EFA for Dependent Variables
There is only one Dependent Variable in this study, which is shopping intention on mobile applications. In this test, Varimax Rotation and Principle Component Analysis are applied.
Table 38: Component Matrix for Dependent Variable
Table 40: Total Variance Explained for Dependent Variable
Because there is only one dependent variable, there is only one component analysed and all factor loadings are greater than 0.5. The KMO value equals 0.824, which is considered as a good number. Besides, the significant value is 0.000 < 0.05. It means that EFA is appropriate. Moreover, there is one eigenvalue higher than 1, which corresponds to one component extracted. Finally, the Total Variance Explain reaches 67.47% > 50%.
4.6 Multiple Linear Regressison Analysis
4.6.1 Correlation Analysis between independent variables and dependent
variables.
Table 41: Correlations
From the result of the Correlations Table, all the significant values between each independent variable and dependent variable are lower than 0.01, which shows that each independent variable has correlation with dependent variable. More particularly:
• Ease-of-access and shopping intention have a correlation and linear relationship with a positive pearson correlation is 0.531.
• Enjoyment and shopping intention have a correlation and linear relationship with a positive pearson correlation is 0.627.
• Anxiety and shopping intention have a correlation and linear relationship with a negative pearson correlation is -0.127.
• Price value and shopping intention have a correlation and linear relationshop with a positive pearson correlation is 0.646.
• Trust and shopping intention have a correlation and linear relationship with a positive pearson correlation is 0.622.
4.6.2 Regression Analysis
After conducting Correlation analysis, Multiple Regression analysis is carried out. According to Lawrence Neuman (2014), the results collected from this analysis presents two major implications:
- Firstly, it helps to explain the prophetic influence of independent variables on the dependent variable. Specifically, R-squared (R2) shows the effect level of the set of independent variables on dependent variable. The higher R-squared is, the fewer errors get when anticipating the dependent variable based on information of the independent variables.
sign of independent variables on dependent variables and effect level of each independent variable on dependent variable.
Table 42: Model Summary
Table 43: ANOVA
The above table describes the final results of Regression analysis for this study. As can be seen from the Model Summary, the R-squared is 0.589, which means the remained independent variables could nearly describe 59% variance of dependent variable. In terms of ANOVA table, the significant level is 0.000 < 0.05. Hence, it draws a conclusion that the research model is significant. Regard to table of Coeffients, all values of Variance inflation factor (VIF) are less than 2. However, there are two values of significant level greater than 0.05. It means that they must be eliminated, which are constant and anxiety. Therefore, anxiety do not affect the dependent variable of this research. The remained factors, which are ease-of-access, enjoyment, price value, and trust have the influence on Shopping intention on mobile applications because all their significant level are lower than 0.05. In conclusion, the linear equation can be implied from this research is as the following:
INT = 0.384 + 0.097 * EOA + 0.225 * ENJ - 0.020 * ANX + 0.309 * PRI + 0.281 * TRU
Where:
INT: Shopping intention on mobile applications EOA: Ease-of-access
ENJ: Enjoyment ANX: Anxiety PRI: Price Value TRU: Trust
4.7 Revised research model