F
FAA-G-8082-22
U.S. Department of Transportation Federal Aviation Administration
Remote Pilot – Small
Unmanned Aircraft Systems
Study Guide
August 2016
Preface
The Federal Aviation Administration (FAA) has published the Remote Pilot – Small Unmanned Aircraft Systems (sUAS) Study Guide to communicate the knowledge areas you need to study to prepare to take the Remote Pilot Certificate with an sUAS rating airman knowledge test.
This Remote Pilot – Small Unmanned Aircraft Systems Study Guide is available for download from
Table of Contents
Introduction ... 1
Obtaining Assistance from the Federal Aviation Administration (FAA) ... 1
FAA Reference Material ... 1
Chapter 1: Applicable Regulations ... 3
Chapter 2: Airspace Classification, Operating Requirements, and Flight Restrictions ... 5
Introduction ... 5
Controlled Airspace ... 5
Uncontrolled Airspace ... 6
Special Use Airspace ... 6
Other Airspace Areas ... 9
Air Traffic Control and the National Airspace System ... 12
Visual Flight Rules (VFR) Terms & Symbols ... 12
Notices to Airmen (NOTAMs) ... 13
Chapter 3a: Aviation Weather Sources ... 15
Introduction ... 15
Surface Aviation Weather Observations ... 15
Aviation Weather Reports ... 15
Aviation Forecasts ... 18
Convective Significant Meteorological Information (WST) ... 19
Chapter 3b: Effects of Weather on Small Unmanned Aircraft Performance ... 21
Introduction ... 21
Density Altitude ... 21
Performance ... 22
Measurement of Atmosphere Pressure ... 22
Effect of Obstructions on Wind ... 23
Low-Level Wind Shear ... 23
Atmospheric Stability ... 24
Temperature/Dew Point Relationship ... 25
Clouds ... 25
Fronts ... 26
Mountain Flying ... 26
Structural Icing... 26
Thunderstorm Life Cycle ... 26
Ceiling ... 27
Visibility ... 28
Introduction ... 29
Weight ... 29
Stability ... 30
Load Factors... 30
Weight and Balance ... 32
Chapter 5: Emergency Procedures ... 35
Introduction ... 35
Inflight Emergency ... 35
Chapter 6: Crew Resource Management ... 37
Chapter 7: Radio Communication Procedures ... 39
Introduction ... 39
Understanding Proper Radio Procedures ... 39
Traffic Advisory Practices at Airports without Operating Control Towers ... 39
Chapter 8: Determining the Performance of Small Unmanned Aircraft ... 43
Introduction ... 43
Effect of Temperature on Density ... 43
Effect of Humidity (Moisture) on Density ... 43
Chapter 9: Physiological Factors (Including Drugs and Alcohol) Affecting Pilot Performance ... 45
Introduction ... 45
Physiological/Medical Factors that Affect Pilot Performance ... 45
Vision and Flight ... 50
Chapter 10: Aeronautical Decision-Making and Judgment ... 51
Introduction ... 51
History of ADM ... 51
Risk Management ... 52
Crew Resource Management (CRM) and Single-Pilot Resource Management ... 53
Hazard and Risk ... 53
Human Factors... 56
The Decision-Making Process ... 57
Decision-Making in a Dynamic Environment ... 59
Situational Awareness ... 63
Chapter 11: Airport Operations ... 65
Introduction ... 65
Types of Airports ... 65
Sources for Airport Data ... 65
Antenna Towers ... 69
Chapter 12: Maintenance and Preflight Inspection Procedures ... 71
Appendix 1: Study References ... 73
Appendix 2: Registration and Marking Requirements for Small Unmanned Aircraft ... 75
Introduction
The information in this study guide was arranged according to the knowledge areas that are covered on the airman knowledge test for a Remote Pilot Certificate with a Small Unmanned Aircraft Systems Rating as required by Title 14 of the Code of Federal Regulations (14 CFR) part 107, section 107.73(a). The knowledge areas are as follows:
Applicable regulations relating to small unmanned aircraft system rating privileges, 1.
limitations, and flight operation;
Airspace classification, operating requirements, and flight restrictions affecting small 2.
unmanned aircraft operation;
Aviation weather sources and effects of weather on small unmanned aircraft performance; 3.
Small unmanned aircraft loading; 4.
Emergency procedures; 5.
Crew resource management; 6.
Radio communication procedures; 7.
Determining the performance of small unmanned aircraft; 8.
Physiological effects of drugs and alcohol; 9.
Aeronautical decision-making and judgment; 10.
Airport operations; and 11.
Maintenance and preflight inspection procedures. 12.
Obtaining Assistance from the Federal Aviation Administration (FAA)
Information can be obtained from the FAA by phone, Internet/e-mail, or mail. To talk to the FAA toll-free 24 hours a day, call 1-866-TELL-FAA (1-866-835-5322). To visit the FAA’s website, go to
www.faa.gov. Individuals can also e-mail an FAA representative at a local FSDO office by accessing the staff e-mail address available via the “Contact FAA” link at the bottom of the FAA home page. Letters can be sent to:
Federal Aviation Administration 800 Independence Ave, SW Washington, DC 20591
FAA Reference Material
The FAA provides a variety of important reference material for the student, as well as the advanced civil aviation pilot. In addition to the regulations provided online by the FAA, several other publications are available to the user. Almost all reference material is available online at www.faa.gov in
downloadable format. Commercial aviation publishers also provide published and online reference material to further aid the aviation pilot.
• Aeronautical Information Manual (AIM)
• Handbooks
• Advisory Circulars (ACs)
Chapter 1:
Applicable Regulations
Chapter 2:
Airspace Classification, Operating Requirements, and Flight Restrictions
Introduction
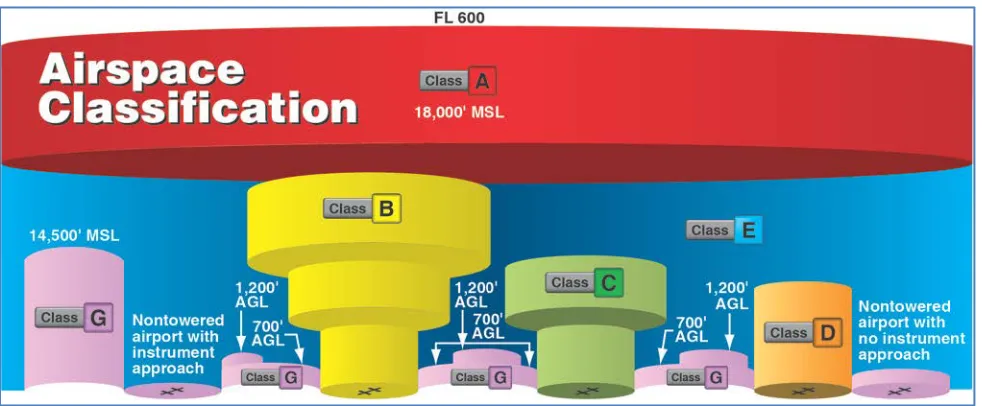
The two categories of airspace are: regulatory and nonregulatory. Within these two categories, there are four types: controlled, uncontrolled, special use, and other airspace. The categories and types of airspace are dictated by the complexity or density of aircraft movements, nature of the operations conducted within the airspace, the level of safety required, and national and public interest. Figure 2-1
presents a profile view of the dimensions of various classes of airspace.
Figure 2-1. Airspace profile.
Controlled Airspace
Controlled airspace is a generic term that covers the different classifications of airspace and defined dimensions within which air traffic control (ATC) service is provided in accordance with the airspace classification. Controlled airspace that is of concern to the remote pilot is:
• Class B • Class C • Class D • Class E Class B Airspace
Class B airspace is generally airspace from the surface to 10,000 feet mean sea level (MSL)
Chapter 2: Airspace Classification, Operating Requirements, and Flight Restrictions
Class C Airspace
Class C airspace is generally airspace from the surface to 4,000 feet above the airport elevation (charted in MSL) surrounding those airports that have an operational control tower, are serviced by a radar approach control, and have a certain number of instrument flight rules (IFR) operations or passenger enplanements. Although the configuration of each Class C area is individually tailored, the airspace usually consists of a surface area with a five nautical mile (NM) radius, an outer circle with a ten NM radius that extends from 1,200 feet to 4,000 feet above the airport elevation. A remote pilot must receive authorization before operating in Class C airspace.
Class D Airspace
Class D airspace is generally airspace from the surface to 2,500 feet above the airport elevation (charted in MSL) surrounding those airports that have an operational control tower. The
configuration of each Class D airspace area is individually tailored and, when instrument procedures are published, the airspace is normally designed to contain the procedures. Arrival extensions for instrument approach procedures (IAPs) may be Class D or Class E airspace. A remote pilot must receive ATC authorization before operating in Class D airspace.
Class E Airspace
Class E airspace is the controlled airspace not classified as Class A, B, C, or D airspace. A large amount of the airspace over the United States is designated as Class E airspace. This provides sufficient airspace for the safe control and separation of aircraft during IFR operations. Chapter 3 of the Aeronautical Information Manual (AIM) explains the various types of Class E airspace.
Sectional and other charts depict all locations of Class E airspace with bases below 14,500 feet MSL. In areas where charts do not depict a class E base, class E begins at 14,500 feet MSL. In most areas, the Class E airspace base is 1,200 feet above ground level (AGL). In many other areas, the Class E airspace base is either the surface or 700 feet AGL. Some Class E airspace begins at an MSL altitude depicted on the charts, instead of an AGL altitude. Class E airspace typically extends up to, but not including, 18,000 feet MSL (the lower limit of Class A airspace). All airspace above FL 600 is Class E airspace.
Federal Airways, which are shown as blue lines on a sectional chart, are usually found within Class E airspace. Federal Airways start at 1,200’ AGL and go up to, but, not including 18,000’ MSL.
In most cases, a remote pilot will not need ATC authorization to operate in Class E airspace.
Uncontrolled Airspace
Class G Airspace
Uncontrolled airspace or Class G airspace is the portion of the airspace that has not been designated as Class A, B, C, D, or E. It is therefore designated uncontrolled airspace. Class G airspace extends from the surface to the base of the overlying Class E airspace. A remote pilot will not need ATC authorization to operate in Class G airspace.
Special Use Airspace
Chapter 2: Airspace Classification, Operating Requirements, and Flight Restrictions
effective altitude, time and weather conditions of operation, the controlling agency, and the chart panel location. On National Aeronautical Charting Group (NACG) en route charts, this information is available on one of the end panels. Special use airspace usually consists of:
• Prohibited areas • Restricted areas • Warning areas
• Military operation areas (MOAs) • Alert areas
• Controlled firing areas (CFAs) Prohibited Areas
Prohibited areas contain airspace of defined dimensions within which the flight of aircraft is prohibited. Such areas are established for security or other reasons associated with the national welfare. These areas are published in the Federal Register and are depicted on aeronautical charts. The area is charted as a “P” followed by a number (e.g., P-40). Examples of prohibited areas include Camp David and the National Mall in Washington, D.C., where the White House and the Congressional buildings are located.
[Figure 2-2]
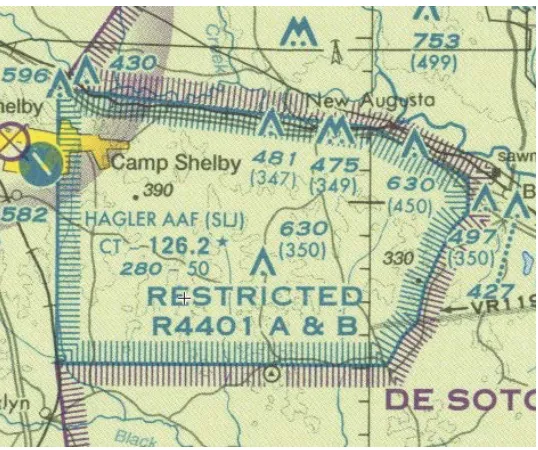
Restricted Areas
Restricted areas are areas where operations are hazardous to nonparticipating aircraft and contain airspace within which the flight of aircraft, while not wholly prohibited, is subject to restrictions. Activities within these areas must be confined because of their nature, or limitations may be imposed upon aircraft operations that are not a part of those activities, or both. Restricted areas denote the existence of unusual, often invisible, hazards to aircraft (e.g., artillery firing, aerial gunnery, or guided missiles). Penetration of restricted areas without authorization from the using or controlling agency may be extremely hazardous to the aircraft.
Figure 2-2. An example of a prohibited area, P-40 around Camp
David.
Chapter 2: Airspace Classification, Operating Requirements, and Flight Restrictions
If the restricted area is not active and has been released to the FAA, the ATC facility allows 1.
the aircraft to operate in the restricted airspace without issuing specific clearance for it to do so.
If the restricted area is active and has not been released to the FAA, the ATC facility issues a 2.
clearance that ensures the aircraft avoids the restricted airspace.
Restricted areas are charted with an “R” followed by a number (e.g., R-4401) and are depicted on the en route chart appropriate for use at the altitude or flight level (FL) being flown. [Figure 10-1]
Restricted area information can be obtained on the back of the chart. Warning Areas
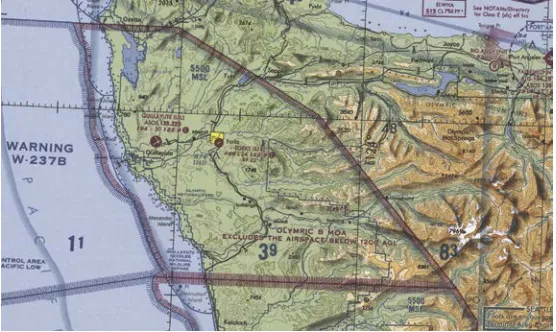
Warning areas are similar in nature to restricted areas; however, the United States government does not have sole jurisdiction over the airspace. A warning area is airspace of defined dimensions, extending from 3 NM outward from the coast of the United States, containing activity that may be hazardous to nonparticipating aircraft. The purpose of such areas is to warn nonparticipating pilots of the potential danger. A warning area may be located over domestic or international waters or both. The airspace is designated with a “W” followed by a number (e.g., W-237). [Figure 2-4]
Military Operation Areas (MOAs) MOAs consist of airspace with defined vertical and lateral limits established for the purpose of separating certain military training activities from IFR traffic. Whenever an MOA is being used, nonparticipating IFR traffic may be cleared through an MOA if IFR separation can be provided by ATC. Otherwise, ATC reroutes or restricts nonparticipating IFR traffic. MOAs are depicted on sectional, VFR terminal area, and en route low altitude charts and are not numbered (e.g., “Camden Ridge MOA”).
[Figure 2-5] However, the MOA
Figure 2-4. Requirements for airspace operations.
Chapter 2: Airspace Classification, Operating Requirements, and Flight Restrictions
is also further defined on the back of the sectional charts with times of operation, altitudes affected, and the controlling agency.
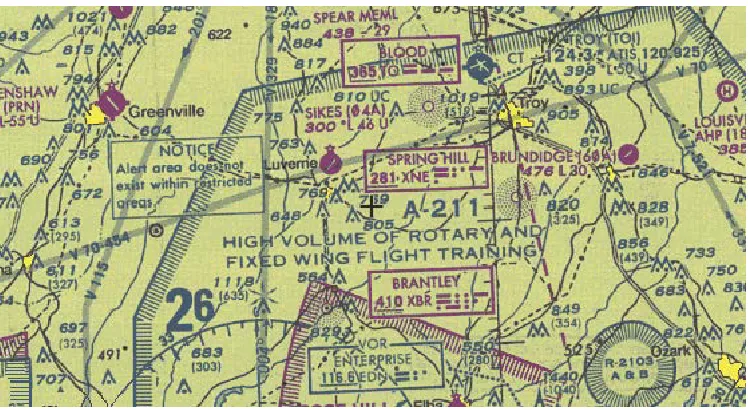
Alert Areas
Alert areas are depicted on aeronautical charts with an “A” followed by a number (e.g., A-211) to inform nonparticipating pilots of areas that may contain a high volume of pilot training or an
unusual type of aerial activity. Pilots should exercise caution in alert areas. All activity within an alert area shall be conducted in accordance with regulations, without waiver, and pilots of participating aircraft, as well as pilots transiting the area, shall be equally responsible for collision avoidance.
[Figure 2-6]
Figure 2-6. Alert area (A-211).
Controlled Firing Areas (CFAs)
CFAs contain activities that, if not conducted in a controlled environment, could be hazardous to nonparticipating aircraft. The difference between CFAs and other special use airspace is that
activities must be suspended when a spotter aircraft, radar, or ground lookout position indicates an aircraft might be approaching the area. There is no need to chart CFAs since they do not cause a nonparticipating aircraft to change its flight path.
Other Airspace Areas
“Other airspace areas” is a general term referring to the majority of the remaining airspace. It includes: • Local airport advisory (LAA)
• Military training route (MTR) • Temporary flight restriction (TFR) • Parachute jump aircraft operations • Published VFR routes
• Terminal radar service area (TRSA) • National security area (NSA)
• Air Defense Identification Zones (ADIZ) land and water based and need for Defense VFR (DVFR) flight plan to operate VFR in this airspace
Chapter 2: Airspace Classification, Operating Requirements, and Flight Restrictions
• Wildlife Areas/Wilderness Areas/National Parks and request to operate above 2,000 AGL • National Oceanic and Atmospheric Administration (NOAA) Marine Areas off the coast with
requirement to operate above 2,000 AGL
• Tethered Balloons for observation and weather recordings that extend on cables up to 60,000
Local Airport Advisory (LAA)
An advisory service provided by Flight Service facilities, which are located on the landing airport, using a discrete ground-to-air frequency or the tower frequency when the tower is closed. LAA services include local airport advisories, automated weather reporting with voice broadcasting, and a continuous Automated Surface Observing System (ASOS)/Automated Weather Observing Station (AWOS) data display, other continuous direct reading instruments, or manual observations available to the specialist.
Military Training Routes (MTRs)
MTRs are routes used by military aircraft to maintain proficiency in tactical flying. These routes are usually established below 10,000 feet MSL for operations at speeds in excess of 250 knots. Some route segments may be defined at higher altitudes for purposes of route continuity. Routes are identified as IFR (IR), and VFR (VR), followed by a number. [Figure 2-7] MTRs with no segment above 1,500 feet AGL are identified by four number characters (e.g., IR1206, VR1207). MTRs that include one or more segments above 1,500 feet AGL are identified by three number characters (e.g., IR206, VR207). IFR low altitude en route charts depict all IR routes and all VR routes that accommodate operations above 1,500 feet AGL. IR routes are conducted in accordance with IFR regardless of weather conditions. VFR sectional charts depict military training activities, such as IR, VR, MOA, restricted area, warning area, and alert area information.
Figure 2-7. Military training route (MTR) chart symbols.
Temporary Flight Restrictions (TFR)
A flight data center (FDC) Notice to Airmen (NOTAM) is issued to designate a TFR. The NOTAM begins with the phrase “FLIGHT RESTRICTIONS” followed by the location of the temporary
Chapter 2: Airspace Classification, Operating Requirements, and Flight Restrictions
also contains the FAA coordination facility and telephone number, the reason for the restriction, and any other information deemed appropriate. The pilot should check the NOTAMs as part of flight planning.
Some of the purposes for establishing a TFR are:
• Protect persons and property in the air or on the surface from an existing or imminent hazard.
• Provide a safe environment for the operation of disaster relief aircraft.
• Prevent an unsafe congestion of sightseeing aircraft above an incident or event, that may generate a high degree of public interest.
• Protect declared national disasters for humanitarian reasons in the State of Hawaii. • Protect the President, Vice President, or other public figures.
• Provide a safe environment for space agency operations.
Since the events of September 11, 2001, the use of TFRs has become much more common. There have been a number of incidents of aircraft incursions into TFRs that have resulted in pilots undergoing security investigations and certificate suspensions. It is a pilot’s responsibility to be aware of TFRs in their proposed area of flight. One way to check is to visit the FAA website, www.tfr.faa.gov, and verify that there is not a TFR in the area.
Parachute Jump Aircraft Operations
Parachute jump aircraft operations are published in the Chart Supplement U.S. (formerly Airport/Facility Directory). Sites that are used frequently are depicted on sectional charts. Published VFR Routes
Published VFR routes are for transitioning around, under, or through some complex airspace. Terms such as VFR flyway, VFR corridor, Class B airspace VFR transition route, and terminal area VFR route have been applied to such routes. These routes are generally found on VFR terminal area planning charts.
Terminal Radar Service Areas (TRSAs)
TRSAs are areas where participating pilots can receive additional radar services. The purpose of the service is to provide separation between all IFR operations and participating VFR aircraft.
The primary airport(s) within the TRSA become(s) Class D airspace. The remaining portion of the TRSA overlies other controlled airspace, which is normally Class E airspace beginning at 700 or 1,200 feet and established to transition to/ from the en route/terminal environment. TRSAs are depicted on VFR sectional charts and terminal area charts with a solid black line and altitudes for each
segment. The Class D portion is charted with a blue segmented line. Participation in TRSA services is voluntary; however, pilots operating under VFR are encouraged to contact the radar approach control and take advantage of TRSA service.
National Security Areas (NSAs)
NSAs consist of airspace of defined vertical and lateral dimensions established at locations where there is a requirement for increased security and safety of ground facilities. Flight in NSAs may be temporarily prohibited by regulation under the provisions of Title 14 of the Code of Federal
Chapter 2: Airspace Classification, Operating Requirements, and Flight Restrictions
Air Traffic Control and the National Airspace System
The primary purpose of the ATC system is to prevent a collision between aircraft operating in the system and to organize and expedite the flow of traffic. In addition to its primary function, the ATC system has the capability to provide (with certain limitations) additional services. The ability to provide additional services is limited by many factors, such as the volume of traffic, frequency congestion, quality of radar, controller workload, higher priority duties, and the pure physical inability to scan and detect those situations that fall in this category. It is recognized that these services cannot be provided in cases in which the provision of services is precluded by the above factors.
Consistent with the aforementioned conditions, controllers shall provide additional service procedures to the extent permitted by higher priority duties and other circumstances. The provision of additional services is not optional on the part of the controller, but rather is required when the work situation permits. Provide ATC service in accordance with the procedures and minima in this order except when other procedures/minima are prescribed in a letter of agreement, FAA directive, or a military
document.
Operating Rules and Pilot/Equipment Requirements
The safety of flight is a top priority of all pilots and the responsibilities associated with operating an aircraft should always be taken seriously. The air traffic system maintains a high degree of safety and efficiency with strict regulatory oversight of the FAA. Pilots fly in accordance with regulations that have served the United States well, as evidenced by the fact that the country has the safest aviation system in the world.
All aircraft operating in today’s National Airspace System (NAS) has complied with the CFR governing its certification and maintenance; all pilots operating today have completed rigorous pilot
certification training and testing. Of equal importance is the proper execution of preflight planning, aeronautical decision-making (ADM) and risk management. ADM involves a systematic approach to risk assessment and stress management in aviation, illustrates how personal attitudes can influence decision-making, and how those attitudes can be modified to enhance safety. More detailed
information regarding ADM and risk mitigation can be found in Chapter 10, “Aeronautical Decision-Making and Judgment,” of this study guide.
Pilots also comply with very strict FAA general operating and flight rules as outlined in the CFR, including the FAA’s important “see and avoid” mandate. These regulations provide the historical foundation of the FAA regulations governing the aviation system and the individual classes of airspace.
Visual Flight Rules (VFR) Terms & Symbols
Remote pilots need to be familiar with the following information from the FAA Aeronautical Chart User’s Guide website:
• All information on the VFR Terms tab
• The following sections under “VFR Aeronautical Chart Symbols” on the VFR Symbols tab: Airports
o
Airspace Information o
Navigational and Procedural Information o
Chart Limits o
Chapter 2: Airspace Classification, Operating Requirements, and Flight Restrictions
Hydrography o
Relief o
Notices to Airmen (NOTAMs)
Notices to Airmen, or NOTAMs, are time-critical aeronautical information either temporary in nature or not sufficiently known in advance to permit publication on aeronautical charts or in other
operational publications. The information receives immediate dissemination via the National Notice to Airmen (NOTAM) System. NOTAMs contain current notices to airmen that are considered essential to the safety of flight, as well as supplemental data affecting other operational publications. There are many different reasons that NOTAMs are issued. Following are some of those reasons:
• Hazards, such as air shows, parachute jumps, kite flying, and rocket launches • Flights by important people such as heads of state
• Inoperable lights on tall obstructions
• Temporary erection of obstacles near airfields
• Passage of flocks of birds through airspace (a NOTAM in this category is known as a BIRDTAM) NOTAMs are available in printed form through subscription from the Superintendent of Documents or online at PilotWeb, which provides access to current NOTAM information. Local airport NOTAMs can be obtained online from various websites. Some examples are www.fltplan.com and
Chapter 2: Airspace Classification, Operating Requirements, and Flight Restrictions
Chapter 3a:
Aviation Weather Sources
Introduction
In aviation, weather service is a combined effort of the National Weather Service (NWS), Federal Aviation Administration (FAA), Department of Defense (DOD), other aviation groups, and individuals. Because of the increasing need for worldwide weather services, foreign weather organizations also provide vital input. While weather forecasts are not 100 percent accurate, meteorologists, through careful scientific study and computer modeling, have the ability to predict weather patterns, trends, and characteristics with increasing accuracy. Through a complex system of weather services,
government agencies, and independent weather observers, pilots and other aviation professionals receive the benefit of this vast knowledge base in the form of up-to-date weather reports and
forecasts. These reports and forecasts enable pilots to make informed decisions regarding weather and flight safety before and during a flight.
Surface Aviation Weather Observations
Surface aviation weather observations are a compilation of elements of the current weather at individual ground stations across the United States. The network is made up of government and privately contracted facilities that provide continuous up-to-date weather information. Automated weather sources, such as the Automated Weather Observing Systems (AWOS), Automated Surface Observing Systems (ASOS), as well as other automated facilities, also play a major role in the gathering of surface observations.
Surface observations provide local weather conditions and other relevant information for a specific airport. This information includes the type of report, station identifier, date and time, modifier (as required), wind, visibility, runway visual range (RVR), weather phenomena, sky condition,
temperature/dew point, altimeter reading, and applicable remarks. The information gathered for the surface observation may be from a person, an automated station, or an automated station that is updated or enhanced by a weather observer. In any form, the surface observation provides valuable information about individual airports around the country. These reports cover a small area and will be beneficial to the remote pilot.
Aviation Weather Reports
Aviation weather reports are designed to give accurate depictions of current weather conditions. Each report provides current information that is updated at different times. Some typical reports are
METARs and PIREPs. To view a weather report, go to http://www.aviationweather.gov/. Aviation Routine Weather Report (METAR)
A METAR is an observation of current surface weather reported in a standard international format. METARs are issued on a regularly scheduled basis unless significant weather changes have occurred. A special METAR (SPECI) can be issued at any time between routine METAR reports.
Chapter 3a: Aviation Weather Sources
A typical METAR report contains the following information in sequential order:
Type of report—there are two types of METAR reports. The first is the routine METAR report 1.
that is transmitted on a regular time interval. The second is the aviation selected SPECI. This is a special report that can be given at any time to update the METAR for rapidly changing weather conditions, aircraft mishaps, or other critical information.
Station identifier—a four-letter code as established by the International Civil Aviation 2.
Organization (ICAO). In the 48 contiguous states, a unique three-letter identifier is preceded by the letter “K.” For example, Gregg County Airport in Longview, Texas, is identified by the letters “KGGG,” K being the country designation and GGG being the airport identifier. In other regions of the world, including Alaska and Hawaii, the first two letters of the four-letter ICAO identifier indicate the region, country, or state. Alaska identifiers always begin with the letters “PA” and Hawaii identifiers always begin with the letters “PH.” Station identifiers can be found by searching various websites such as DUATS and NOAA's Aviation Weather Aviation Digital Data Services (ADDS).
Date and time of report—depicted in a six-digit group (161753Z). The first two digits are the 3.
date. The last four digits are the time of the METAR/SPECI, which is always given in coordinated universal time (UTC). A “Z” is appended to the end of the time to denote the time is given in Zulu time (UTC) as opposed to local time.
Modifier—denotes that the METAR/SPECI came from an automated source or that the report 4.
was corrected. If the notation “AUTO” is listed in the METAR/SPECI, the report came from an automated source. It also lists “AO1” (for no precipitation discriminator) or “AO2” (with precipitation discriminator) in the “Remarks” section to indicate the type of precipitation sensors employed at the automated station. When the modifier “COR” is used, it identifies a corrected report sent out to replace an earlier report that contained an error (for example: METAR KGGG 161753Z COR).
Wind—reported with five digits (14021KT) unless the speed is greater than 99 knots, in which 5.
case the wind is reported with six digits. The first three digits indicate the direction the true wind is blowing from in tens of degrees. If the wind is variable, it is reported as “VRB.” The last two digits indicate the speed of the wind in knots unless the wind is greater than 99 knots, in which case it is indicated by three digits. If the winds are gusting, the letter “G” follows the wind speed (G26KT). After the letter “G,” the peak gust recorded is provided. If the wind direction varies more than 60° and the wind speed is greater than six knots, a separate group of numbers, separated by a “V,” will indicate the extremes of the wind directions.
Visibility—the prevailing visibility (¾ SM) is reported in statute miles as denoted by the letters 6.
“SM.” It is reported in both miles and fractions of miles. At times, runway visual range (RVR) is reported following the prevailing visibility. RVR is the distance a pilot can see down the runway in a moving aircraft. When RVR is reported, it is shown with an R, then the runway number followed by a slant, then the visual range in feet. For example, when the RVR is reported as R17L/1400FT, it translates to a visual range of 1,400 feet on runway 17 left. Weather—can be broken down into two different categories: qualifiers and weather 7.
phenomenon (+TSRA BR). First, the qualifiers of intensity, proximity, and the descriptor of the weather are given. The intensity may be light (–), moderate ( ), or heavy (+). Proximity only depicts weather phenomena that are in the airport vicinity. The notation “VC” indicates a specific weather phenomenon is in the vicinity of five to ten miles from the airport. Descriptors are used to describe certain types of precipitation and obscurations. Weather
Chapter 3a: Aviation Weather Sources
phenomena may be reported as being precipitation, obscurations, and other phenomena, such as squalls or funnel clouds. Descriptions of weather phenomena as they begin or end and hailstone size are also listed in the “Remarks” sections of the report. [Figure 3-1]
Figure 3-1. Descriptors and weather phenomena used in a typical METAR.
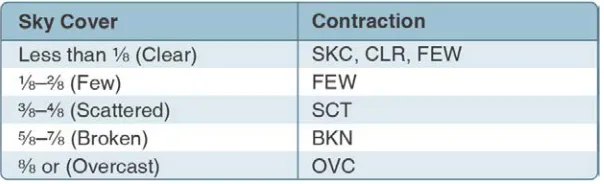
Sky condition—always reported in the sequence of amount, height, and type or indefinite 8.
ceiling/height (vertical visibility) (BKN008 OVC012CB, VV003). The heights of the cloud bases are reported with a three-digit number in hundreds of feet AGL. Clouds above 12,000 feet are not detected or reported by an automated station. The types of clouds, specifically towering cumulus (TCU) or cumulonimbus (CB) clouds, are reported with their height. Contractions are used to describe the amount of cloud coverage and obscuring phenomena. The amount of sky coverage is reported in eighths of the sky from horizon to horizon. [Figure 3-2]
Figure 3-2. Reportable contractions for sky condition.
Temperature and dew point—the air temperature and dew point are always given in degrees 9.
Celsius (C) or (18/17). Temperatures below 0 °C are preceded by the letter “M” to indicate minus.
Altimeter setting—reported as inches of mercury ("Hg) in a four-digit number group (A2970). 10.
Chapter 3a: Aviation Weather Sources
Zulu time—a term used in aviation for UTC, which places the entire world on one time 11.
standard.
Remarks—the remarks section always begins with the letters “RMK.” Comments may or may 12.
not appear in this section of the METAR. The information contained in this section may include wind data, variable visibility, beginning and ending times of particular phenomenon, pressure information, and various other information deemed necessary. An example of a remark regarding weather phenomenon that does not fit in any other category would be: OCNL LTGICCG. This translates as occasional lightning in the clouds and from cloud to ground. Automated stations also use the remarks section to indicate the equipment needs
maintenance.
Example: METAR KGGG 161753Z AUTO 14021G26KT 3/4SM +TSRA BR BKN008 OVC012CB 18/17 A2970 RMK PRESFR
Explanation: Routine METAR for Gregg County Airport for the 16th day of the month at 1753Z automated source. Winds are 140 at 21 knots gusting to 26. Visibility is ¾ statute mile. Thunderstorms with heavy rain and mist. Ceiling is broken at 800 feet, overcast at 1,200 feet with cumulonimbus clouds. Temperature 18 °C and dew point 17 °C. Barometric pressure is 29.70 "Hg and falling rapidly.
Aviation Forecasts
Observed weather condition reports are often used in the creation of forecasts for the same area. A variety of different forecast products are produced and designed to be used in the preflight planning stage. The printed forecasts that pilots need to be familiar with are the terminal aerodrome forecast (TAF), aviation area forecast (FA), inflight weather advisories (Significant Meteorological Information (SIGMET), Airman’s Meteorological Information (AIRMET)), and the winds and temperatures aloft forecast (FB).
Terminal Aerodrome Forecasts (TAF)
A TAF is a report established for the five statute mile radius around an airport. TAF reports are usually given for larger airports. Each TAF is valid for a 24 or 30-hour time period and is updated four times a day at 0000Z, 0600Z, 1200Z, and 1800Z. The TAF utilizes the same descriptors and
abbreviations as used in the METAR report. These weather reports can be beneficial to the remote pilot for flight planning purposes. The TAF includes the following information in sequential order:
Type of report—a TAF can be either a routine forecast (TAF) or an amended forecast (TAF 1.
AMD).
ICAO station identifier—the station identifier is the same as that used in a METAR. 2.
Date and time of origin—time and date (081125Z) of TAF origination is given in the six-3.
number code with the first two being the date, the last four being the time. Time is always given in UTC as denoted by the Z following the time block.
Valid period dates and times—The TAF valid period (0812/0912) follows the date/time of 4.
forecast origin group. Scheduled 24 and 30 hour TAFs are issued four times per day, at 0000, 0600, 1200, and 1800Z. The first two digits (08) are the day of the month for the start of the TAF. The next two digits (12) are the starting hour (UTC). 09 is the day of the month for the end of the TAF, and the last two digits (12) are the ending hour (UTC) of the valid period. A forecast period that begins at midnight UTC is annotated as 00. If the end time of a valid
Chapter 3a: Aviation Weather Sources
period is at midnight UTC, it is annotated as 24. For example, a 00Z TAF issued on the 9th of the month and valid for 24 hours would have a valid period of 0900/0924.
Forecast wind—the wind direction and speed forecast are coded in a five-digit number group. 5.
An example would be 15011KT. The first three digits indicate the direction of the wind in reference to true north. The last two digits state the wind speed in knots appended with “KT.” Like the METAR, winds greater than 99 knots are given in three digits.
Forecast visibility—given in statute miles and may be in whole numbers or fractions. If the 6.
forecast is greater than six miles, it is coded as “P6SM.”
Forecast significant weather—weather phenomena are coded in the TAF reports in the same 7.
format as the METAR.
Forecast sky condition—given in the same format as the METAR. Only CB clouds are forecast 8.
in this portion of the TAF report as opposed to CBs and towering cumulus in the METAR. Forecast change group—for any significant weather change forecast to occur during the TAF 9.
time period, the expected conditions and time period are included in this group. This
information may be shown as from (FM), and temporary (TEMPO). “FM” is used when a rapid and significant change, usually within an hour, is expected. “TEMPO” is used for temporary fluctuations of weather, expected to last less than 1 hour.
PROB30—a given percentage that describes the probability of thunderstorms and 10.
precipitation occurring in the coming hours. This forecast is not used for the first 6 hours of the 24-hour forecast.
Example: TAF KPIR 111130Z 1112/1212 TEMPO 1112/1114 5SM BR FM1500 16015G25KT P6SM SCT040 BKN250 FM120000 14012KT P6SM BKN080 OVC150 PROB30 1200/1204 3SM TSRA BKN030CB FM120400 1408KT P6SM SCT040 OVC080 TEMPO 1204/1208 3SM TSRA OVC030CB
Explanation: Routine TAF for Pierre, South Dakota…on the 11th day of the month, at 1130Z…valid for 24 hours from 1200Z on the 11th to 1200Z on the 12th…wind from 150° at 12 knots… visibility greater than 6 SM…broken clouds at 9,000 feet… temporarily, between 1200Z and 1400Z, visibility 5 SM in mist…from 1500Z winds from 160° at 15 knots, gusting to 25 knots visibility greater than 6 SM…clouds scattered at 4,000 feet and broken at 25,000 feet…from 0000Z wind from 140° at 12 knots…visibility greater than 6 SM…clouds broken at 8,000 feet, overcast at 15,000 feet…between 0000Z and 0400Z, there is 30 percent probability of visibility 3 SM…thunderstorm with moderate rain showers…clouds broken at 3,000 feet with cumulonimbus clouds…from
0400Z…winds from 140° at 8 knots…visibility greater than 6 miles…clouds at 4,000 scattered and overcast at 8,000… temporarily between 0400Z and 0800Z…visibility 3 miles… thunderstorms with moderate rain showers…clouds overcast at 3,000 feet with cumulonimbus clouds…end of report (=).
Convective Significant Meteorological Information (WST)
Chapter 3a: Aviation Weather Sources
This page intentionally left blank.
Chapter 3b:
Effects of Weather on Small Unmanned Aircraft Performance
Introduction
This chapter discusses the factors that affect aircraft performance, which include the aircraft weight, atmospheric conditions, runway environment, and the fundamental physical laws governing the forces acting on an aircraft.
Since the characteristics of the atmosphere have a major effect on performance, it is necessary to review two dominant factors—pressure and temperature.
Density Altitude
The more appropriate term for correlating aerodynamic performance in the nonstandard atmosphere is density altitude—the altitude in the standard atmosphere corresponding to a particular value of air density.
As the density of the air increases (lower density altitude), aircraft performance increases. Conversely, as air density decreases (higher density altitude), aircraft performance decreases. A decrease in air density means a high density altitude; an increase in air density means a lower density altitude. Density altitude has a direct effect on aircraft performance.
Air density is affected by changes in altitude, temperature, and humidity. High density altitude refers to thin air while low density altitude refers to dense air. The conditions that result in a high density
altitude are high elevations, low atmospheric pressures, high temperatures, high humidity, or some combination of these factors. Lower elevations, high atmospheric pressure, low temperatures, and low humidity are more indicative of low density altitude.
Effects of Pressure on Density
Since air is a gas, it can be compressed or expanded. When air is compressed, a greater amount of air can occupy a given volume. Conversely, when pressure on a given volume of air is decreased, the air expands and occupies a greater space. That is, the original column of air at a lower pressure contains a smaller mass of air. In other words, the density is decreased. In fact, density is directly proportional to pressure. If the pressure is doubled, the density is doubled, and if the pressure is lowered, so is the density. This statement is true only at a constant temperature.
Effects of Temperature on Density
Increasing the temperature of a substance decreases its density. Conversely, decreasing the temperature increases the density. Thus, the density of air varies inversely with temperature. This statement is true only at a constant pressure.
In the atmosphere, both temperature and pressure decrease with altitude and have conflicting effects upon density. However, the fairly rapid drop in pressure as altitude is increased usually has the dominant effect. Hence, pilots can expect the density to decrease with altitude.
Effects of Humidity (Moisture) on Density
Chapter 3b: Effects of Weather on Small Unmanned Aircraft Performance
under certain conditions, but in other conditions humidity may become an important factor in the performance of an aircraft. Water vapor is lighter than air; consequently, moist air is lighter than dry air. Therefore, as the water content of the air increases, the air becomes less dense, increasing density altitude and decreasing performance. It is lightest or least dense when, in a given set of conditions, it contains the maximum amount of water vapor.
Humidity, also called relative humidity, refers to the amount of water vapor contained in the atmosphere and is expressed as a percentage of the maximum amount of water vapor the air can hold. This amount varies with the temperature; warm air can hold more water vapor, while colder air can hold less. Perfectly dry air that contains no water vapor has a relative humidity of zero percent, while saturated air that cannot hold any more water vapor has a relative humidity of 100 percent. Humidity alone is usually not considered an essential factor in calculating density altitude and aircraft performance; however, it does contribute.
Performance
Performance is a term used to describe the ability of an aircraft to accomplish certain things that make it useful for certain purposes.
The primary factors most affected by performance are the takeoff and landing distance, rate of climb, ceiling, payload, range, speed, maneuverability, stability, and fuel economy.
Climb Performance Factors
Since weight, altitude and configuration changes affect excess thrust and power, they also affect climb performance. Climb performance is directly dependent upon the ability to produce either excess thrust or excess power.
Weight has a very pronounced effect on aircraft performance. If weight is added to an aircraft, it must fly at a higher angle of attack (AOA) to maintain a given altitude and speed. This increases the induced drag of the wings, as well as the parasite drag of the aircraft. Increased drag means that additional thrust is needed to overcome it, which in turn means that less reserve thrust is available for climbing. Aircraft designers go to great lengths to minimize the weight, since it has such a marked effect on the factors pertaining to performance.
A change in an aircraft’s weight produces a twofold effect on climb performance. An increase in altitude also increases the power required and decreases the power available. Therefore, the climb performance of an aircraft diminishes with altitude.
Measurement of Atmosphere Pressure
To provide a common reference, the International Standard Atmosphere (ISA) has been established. These standard conditions are the basis for most aircraft performance data. Standard sea level
pressure is defined as 29.92 "Hg and a standard temperature of 59 °F (15 °C). Atmospheric pressure is also reported in millibars (mb), with 1 "Hg equal to approximately 34 mb. Standard sea level pressure is 1,013.2 mb. Typical mb pressure readings range from 950.0 to 1,040.0 mb. Surface charts, high and low pressure centers, and hurricane data are reported using mb.
Chapter 3b: Effects of Weather on Small Unmanned Aircraft Performance
elevation. For example, a station at 5,000 feet above sea level, with a reading of 24.92 "Hg, reports a sea level pressure reading of 29.92 "Hg.
By tracking barometric pressure trends across a large area, weather forecasters can more accurately predict movement of pressure systems and the associated weather. For example, tracking a pattern of rising pressure at a single weather station generally indicates the approach of fair weather. Conversely, decreasing or rapidly falling pressure usually indicates approaching bad weather and, possibly, severe storms.
Effect of Obstructions on Wind
Another atmospheric hazard exists that can create problems for pilots. Obstructions on the ground affect the flow of wind and can be an unseen danger. Ground topography and large buildings can break up the flow of the wind and create wind gusts that change rapidly in direction and speed. These
obstructions range from man-made structures, like hangars, to large natural obstructions, such as mountains, bluffs, or canyons.
The intensity of the turbulence associated with ground obstructions depends on the size of the obstacle and the primary velocity of the wind. This can affect the performance of any aircraft and can present a very serious hazard.
This same condition is even more noticeable when flying in mountainous regions. [Figure 3-3] While the wind flows smoothly up the windward side of the mountain and the upward currents help to carry an aircraft over the peak of the mountain, the wind on the leeward side does not act in a similar manner. As the air flows down the leeward side of the mountain, the air follows the contour of the terrain and is increasingly turbulent. This tends to push an aircraft into the side of a mountain. The stronger the wind, the greater the downward pressure and turbulence become.
Figure 3-3. Turbulence in mountainous regions.
Low-Level Wind Shear
Wind shear is a sudden, drastic change in wind speed and/or direction over a very small area. Wind shear can subject an aircraft to violent updrafts and downdrafts, as well as abrupt changes to the horizontal movement of the aircraft. While wind shear can occur at any altitude, low-level wind shear is especially hazardous due to the proximity of an aircraft to the ground. Low-level wind shear is
Chapter 3b: Effects of Weather on Small Unmanned Aircraft Performance
Wind shear is dangerous to an aircraft. It can rapidly change the performance of the aircraft and disrupt the normal flight attitude. For example, a tailwind quickly changing to a headwind causes an increase in airspeed and performance. Conversely, a headwind changing to a tailwind causes a
decrease in airspeed and performance. In either case, a pilot must be prepared to react immediately to these changes to maintain control of the aircraft.
The most severe type of low-level wind shear, a microburst, is associated with convective precipitation into dry air at cloud base. Microburst activity may be indicated by an intense rain shaft at the surface but virga at cloud base and a ring of blowing dust is often the only visible clue. A typical microburst has a horizontal diameter of 1–2 miles and a nominal depth of 1,000 feet. The lifespan of a microburst is about 5–15 minutes during which time it can produce downdrafts of up to 6,000 feet per minute (fpm) and headwind losses of 30–90 knots, seriously degrading performance. It can also produce strong turbulence and hazardous wind direction changes. During an inadvertent microburst encounter, the small UA may first experience a increasing headwind, followed by
performance-decreasing downdrafts, followed by a rapidly increasing tailwind. This can result in terrain impact or flight dangerously close to the ground. An encounter during approach involves the same sequence of wind changes and could force the small UA to the ground short of the intended landing area.
It is important to remember that wind shear can affect any flight at any altitude. While wind shear may be reported, it often remains undetected and is a silent danger to aviation. Always be alert to the possibility of wind shear, especially when flying in and around thunderstorms and frontal systems.
Atmospheric Stability
The stability of the atmosphere depends on its ability to resist vertical motion. A stable atmosphere makes vertical movement difficult, and small vertical disturbances dampen out and disappear. In an unstable atmosphere, small vertical air movements tend to become larger, resulting in turbulent airflow and convective activity. Instability can lead to significant turbulence, extensive vertical clouds, and severe weather.
The combination of moisture and temperature determine the stability of the air and the resulting weather. Cool, dry air is very stable and resists vertical movement, which leads to good and generally clear weather. The greatest instability occurs when the air is moist and warm, as it is in the tropical regions in the summer. Typically, thunderstorms appear on a daily basis in these regions due to the instability of the surrounding air.
Inversion
As air rises and expands in the atmosphere, the temperature decreases. There is an atmospheric anomaly that can occur; however, that changes this typical pattern of atmospheric behavior. When the temperature of the air rises with altitude, a temperature inversion exists. Inversion layers are commonly shallow layers of smooth, stable air close to the ground. The temperature of the air increases with altitude to a certain point, which is the top of the inversion. The air at the top of the layer acts as a lid, keeping weather and pollutants trapped below. If the relative humidity of the air is high, it can contribute to the formation of clouds, fog, haze, or smoke resulting in diminished visibility in the inversion layer.
Chapter 3b: Effects of Weather on Small Unmanned Aircraft Performance
becomes cooler than the air above it. Frontal inversions occur when warm air spreads over a layer of cooler air, or cooler air is forced under a layer of warmer air.
Temperature/Dew Point Relationship
The relationship between dew point and temperature defines the concept of relative humidity. The dew point, given in degrees, is the temperature at which the air can hold no more moisture. When the temperature of the air is reduced to the dew point, the air is completely saturated and moisture begins to condense out of the air in the form of fog, dew, frost, clouds, rain, or snow.
Methods by Which Air Reaches the Saturation Point
If air reaches the saturation point while temperature and dew point are close together, it is highly likely that fog, low clouds, and precipitation will form. There are four methods by which air can reach the saturation point. First, when warm air moves over a cold surface, the air temperature drops and reaches the saturation point. Second, the saturation point may be reached when cold air and warm air mix. Third, when air cools at night through contact with the cooler ground, air reaches its saturation point. The fourth method occurs when air is lifted or is forced upward in the
atmosphere. Dew and Frost
On cool, clear, calm nights, the temperature of the ground and objects on the surface can cause temperatures of the surrounding air to drop below the dew point. When this occurs, the moisture in the air condenses and deposits itself on the ground, buildings, and other objects like cars and
aircraft. This moisture is known as dew and sometimes can be seen on grass and other objects in the morning. If the temperature is below freezing, the moisture is deposited in the form of frost. While dew poses no threat to a small UA, frost poses a definite flight safety hazard. Frost disrupts the flow of air over the wing and can drastically reduce the production of lift. It also increases drag, which when combined with lowered lift production, can adversely affect the ability to take off. A small UA must be thoroughly cleaned and free of frost prior to beginning a flight.
Clouds
To pilots, the cumulonimbus cloud is perhaps the most dangerous cloud type. It appears individually or in groups and is known as either an air mass or orographic thunderstorm. Heating of the air near the Earth’s surface creates an air mass thunderstorm; the upslope motion of air in the mountainous regions causes orographic thunderstorms. Cumulonimbus clouds that form in a continuous line are nonfrontal bands of thunderstorms or squall lines.
Since rising air currents cause cumulonimbus clouds, they are extremely turbulent and pose a
significant hazard to flight safety. For example, if a small UA enters a thunderstorm, the small UA could experience updrafts and downdrafts that exceed 3,000 fpm. In addition, thunderstorms can produce large hailstones, damaging lightning, tornadoes, and large quantities of water, all of which are potentially hazardous to an aircraft.
Standing Lenticular Altocumulus Clouds.
Chapter 3b: Effects of Weather on Small Unmanned Aircraft Performance Stability
Stability of an air mass determines its typical weather characteristics. When one type of air mass overlies another, conditions change with height. Characteristics typical of an unstable and a stable air mass are as follows:
Unstable Air Stable Air
Cumuliform clouds Stratiform clouds and fog
Showery precipitation Continuous precipitation
Rough air (turbulence) Smooth air
Good visibility (except in blowing obstructions) Fair to poor visibility in haze and smoke
Fronts
As air masses move out of their source regions, they come in contact with other air masses of different properties. The zone between two different air masses is a frontal zone or front. Across this zone, temperature, humidity and wind often change rapidly over short distances.
Mountain Flying
When planning a flight over mountainous terrain, gather as much preflight information as possible on cloud reports, wind direction, wind speed, and stability of air. Satellites often help locate mountain waves. Adequate information may not always be available, so remain alert for signposts in the sky. Wind at mountain top level in excess of 25 knots suggests some turbulence. Wind in excess of 40 knots across a mountain barrier dictates caution. Stratified clouds mean stable air. Standing lenticular and/or rotor clouds suggest a mountain wave; expect turbulence many miles to the lee of mountains and relative smooth flight on the windward side. Convective clouds on the windward side of mountains mean unstable air; expect turbulence in close proximity to and on either side of the mountain.
Structural Icing
Two conditions are necessary for structural icing in flight:
The aircraft must be flying through visible water such as rain or cloud droplets 1.
The temperature at the point where the moisture strikes the aircraft must be 0° C or colder. 2.
Aerodynamic cooling can lower temperature of an airfoil to 0° C even though the ambient temperature is a few degrees warmer.
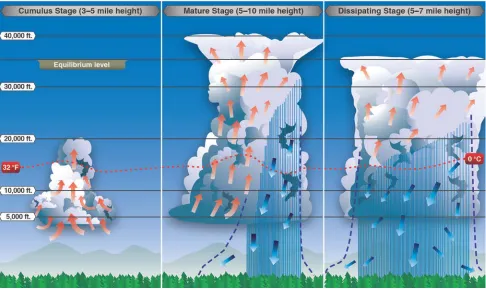
Thunderstorm Life Cycle
A thunderstorm cell during its life cycle progresses through three stages-( 1) the cumulus, (2) the mature, and (3) the dissipating. Itis virtually impossible to visually detect the transition from one stage to another; the transition is subtle and by no means abrupt. Furthermore, a thunderstorm may be a cluster of cells in different stages of the lifecycle.
The Cumulus Stage
Chapter 3b: Effects of Weather on Small Unmanned Aircraft Performance
building cumulus clouds. Early during the cumulus stage, water droplets are quite small but grow to raindrop size as the cloud grows. The upwelling air carries the liquid water above the freezing level creating an icing hazard. As the raindrops grow still heavier, they fall. The cold rain drags air with it creating a cold downdraft coexisting with the updraft; the cell has reached the mature stage. The Mature Stage
Precipitation beginning to fall from the cloud base is your signal that a downdraft has developed and a cell has entered the mature stage. Cold rain in the downdraft retards compressional heating, and the downdraft remains cooler than surrounding air. Therefore, its downward speed is accelerated and may exceed 2,500 feet per minute. The down rushing air spreads outward at the surface as shown in figure 3-4 producing strong, gusty surface winds, a sharp temperature drop, and a rapid rise in pressure. The surface wind surge is a "plow wind" and its leading edge is the "first gust." Meanwhile, updrafts reach a maximum with speeds possibly exceeding 6,000 feet per minute. Updrafts and downdrafts in close proximity create strong vertical shear and a very turbulent environment. All thunderstorm hazards reach their greatest intensity during the mature stage. The Dissipating Stage
Downdrafts characterize the dissipating stage of the thunderstorm cell as shown in figure 3-4 and the storm dies rapidly. When rain has ended and downdrafts have abated, the dissipating stage 'is complete. When all cells of the thunderstorm have completed this stage, only harmless cloud remnants remain.
Figure 3-4. Life cycle of a thunderstorm.
Ceiling
five-Chapter 3b: Effects of Weather on Small Unmanned Aircraft Performance
eighths to seven-eighths of the sky is covered with clouds. Overcast means the entire sky is covered with clouds. Current ceiling information is reported by the aviation routine weather report (METAR) and automated weather stations of various types.
Visibility
Chapter 4:
Small Unmanned Aircraft Loading
Introduction
Before any flight, the remote pilot-in-command (PIC) should verify the aircraft is correctly loaded by determining the weight and balance condition of the aircraft. An aircraft’s weight and balance restrictions established by the manufacturer or the builder should be closely followed. Compliance with the manufacturer’s weight and balance limits is critical to flight safety. The remote PIC must consider the consequences of an overweight aircraft if an emergency condition arises.
• Although a maximum gross takeoff weight may be specified, the aircraft may not always safely take off with this load under all conditions. Conditions that affect takeoff and climb performance, such as high elevations, high air temperatures, and high humidity (high density altitudes) may require a reduction in weight before flight is attempted. Other factors to consider prior to takeoff are runway/launch area length, surface, slope, surface wind, and the presence of obstacles. These factors may require a reduction in weight prior to flight.
• Weight changes during flight also have a direct effect on aircraft performance. Fuel burn is the most common weight change that takes place during flight. As fuel is used, the aircraft becomes lighter and performance is improved, but this could have a negative effect on balance. In small UA operations, weight change during flight may occur when expendable items are used on board (e.g., a jettisonable load).
Adverse balance conditions (i.e., weight distribution) may affect flight characteristics in much the same manner as those mentioned for an excess weight condition. Limits for the location of the center of gravity (CG) may be established by the manufacturer. The CG is not a fixed point marked on the
aircraft; its location depends on the distribution of aircraft weight. As variable load items are shifted or expended, there may be a resultant shift in CG location. The remote PIC should determine how the CG will shift and the resultant effects on the aircraft. If the CG is not within the allowable limits after loading or do not remain within the allowable limits for safe flight, it will be necessary to relocate or shed some weight before flight is attempted.
Weight
Gravity is the pulling force that tends to draw all bodies to the center of the earth. The CG may be considered as a point at which all the weight of the aircraft is concentrated. If the aircraft were supported at its exact CG, it would balance in any attitude. It will be noted that CG is of major
importance in a small UA, for its position has a great bearing upon stability. The allowable location of the CG is determined by the general design of each particular aircraft. The designers determine how far the center of pressure (CP) will travel. It is important to understand that an aircraft’s weight is
concentrated at the CG and the aerodynamic forces of lift occur at the CP. When the CG is forward of the CP, there is a natural tendency for the aircraft to want to pitch nose down. If the CP is forward of the CG, a nose up pitching moment is created. Therefore, designers fix the aft limit of the CG forward of the CP for the corresponding flight speed in order to retain flight equilibrium.
Chapter 4: Small Unmanned Aircraft Loading
equilibrium and neither accelerates upward or downward. If lift becomes less than weight, the vertical speed will decrease. When lift is greater than weight, the vertical speed will increase.
Stability
Stability is the inherent quality of an aircraft to correct for conditions that may disturb its equilibrium and to return to or to continue on the original flight path. It is primarily an aircraft design
characteristic.
Stability in an aircraft affects two areas significantly:
• Maneuverability—the quality of an aircraft that permits it to be maneuvered easily and to withstand the stresses imposed by maneuvers. It is governed by the aircraft’s weight, inertia, size and location of flight controls, structural strength, and powerplant. It too is an aircraft design characteristic.
• Controllability—the capability of an aircraft to respond to the pilot’s control, especially with regard to flight path and attitude. It is the quality of the aircraft’s response to the pilot’s control application when maneuvering the aircraft, regardless of its stability characteristics.
Load Factors
In aerodynamics, the maximum load factor (at given bank angle) is a proportion between lift and weight and has a trigonometric relationship. The load factor is measured in Gs (acceleration of gravity), a unit of force equal to the force exerted by gravity on a body at rest and indicates the force to which a body is subjected when it is accelerated. Any force applied to an aircraft to deflect its flight from a straight line produces a stress on its structure. The amount of this force is the load factor. While a course in aerodynamics is not a prerequisite for obtaining a remote pilot certificate, the competent pilot should have a solid understanding of the forces that act on the aircraft, the advantageous use of these forces, and the operating limitations of the aircraft being flown.
For example, a load factor of 3 means the total load on an aircraft’s structure is three times its weight. Since load factors are expressed in terms of Gs, a load factor of 3 may be spoken of as 3 Gs, or a load factor of 4 as 4 Gs.
With the structural design of aircraft planned to withstand only a certain amount of overload, a knowledge of load factors has become essential for all pilots. Load factors are important for two reasons:
It is possible for a pilot to impose a dangerous overload on the aircraft structures. 1.
An increased load factor increases the stalling speed and makes stalls possible at seemingly 2.
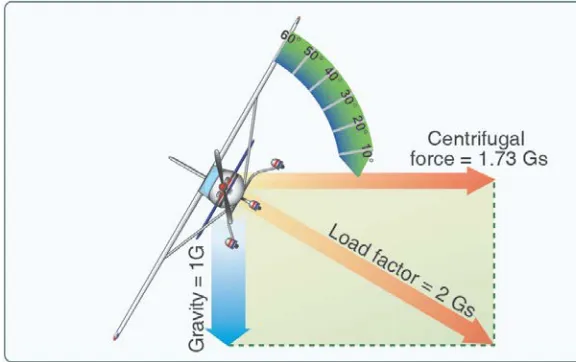
Chapter 4: Small Unmanned Aircraft Loading Load Factors in Steep Turns
At a constant altitude, during a coordinated turn in any aircraft, the load factor is the result of two forces: centrifugal force and weight. [Figure 4-1] For any given bank angle, the rate-of-turn varies with the airspeed—the higher the speed, the slower the rate-of-turn (ROT). This compensates for added centrifugal force, allowing the load factor to remain the same.
Figure 4-2 reveals an important fact about
turns—the load factor increases at a terrific rate after a bank has reached 45° or 50°. The load factor for any aircraft in a coordinated level turn at 60° bank is 2 Gs. The load factor in an 80° bank is 5.76 Gs. The wing must produce lift equal to these load factors if altitude is to be maintained.
It should be noted how rapidly the line denoting load factor rises as it approaches the 90° bank line, which it never quite reaches because a 90° banked, constant altitude turn is not mathematically possible. An aircraft may be banked to 90° in a coordinated turn if not trying to hold altitude. An aircraft that can be held in a 90° banked slipping turn is capable of straight knife-edged flight. At slightly more than 80°, the load factor exceeds the limit of 6 Gs, the limit load factor of an acrobatic aircraft. Load Factors and Stalling Speeds
Any aircraft, within the limits of its structure, may be stalled at any airspeed. When a sufficiently high AOA is imposed, the smooth flow of air over an airfoil breaks up and separates, producing an abrupt change of flight characteristics and a sudden loss of lift, which results in a stall.
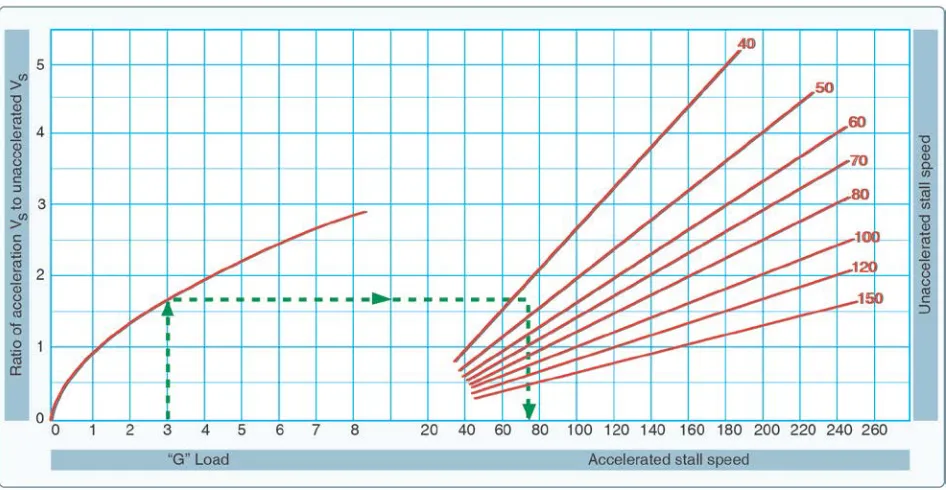
A study of this effect has revealed that an aircraft’s stalling speed increases in proportion to the square root of the load factor. This means that an aircraft with a normal unaccelerated stalling speed of 50 knots can be stalled at 100 knots by inducing a load factor of 4 Gs. If it were possible for this aircraft to withstand a load factor of nine, it could be stalled at a speed of 150 knots. A pilot should be aware of the danger of inadvertently stalling the aircraft by increasing the load factor, as in a steep turn or spiral.
Figures 4-2 and 4-3show that banking an aircraft greater than 72° in a steep turn produces a load factor of 3, and the stalling speed is increased significantly. If this turn is made in an aircraft with a
Chapter 4: Small Unmanned Aircraft Loading
normal unaccelerated stalling speed of 45 knots, the airspeed must be kept greater than 75 knots to prevent inducing a stall. A similar effect is experienced in a quick pull up or any maneuver producing load factors above 1 G. This sudden, unexpected loss of control, particularly in a steep turn or abrupt application of the back elevator control near the ground, has caused many accidents.
Since the load factor is squared as the stalling speed doubles, tremendous loads may be imposed on structures by stalling an aircraft at relatively high airspeeds.
Figure 4-3. Load factor changes stall speed.
Weight and Balance
Compliance with the weight and balance limits of any aircraft is critical to flight safety. Operating above the maximum weight limitation compromises the structural integrity of an aircraft and adversely affects its performance. Operation with the center of gravity (CG) outside the approved limits results in control difficulty. The aircraft’s weight and balance data is important information for a pilot that must be frequently reevaluated.
Weight Control
Weight is the force with which gravity attracts a body toward the center of the Earth. It is a product of the mass of a body and the acceleration acting on the body. Weight is a major factor in aircraft construction and operation and demands respect from all pilots. The force of gravity continuously attempts to pull an aircraft down toward Earth. The force of lift is the only force that counteracts weight and sustains an aircraft in flight. The amount of lift produced by an airfoil is limited by the airfoil design, AOA, airspeed, and air density. To assure that the lift generated is sufficient to counteract weight, loading an aircraft beyond the manufacturer’s recommended weight must be avoided. If the weight is greater than the lift generated, the aircraft may be incapable of flight. Effects of Weight
Any item aboard an aircraft that increases the total weight is undesirable for performance.