Cloud Vulnerabilities Working Group
Cloud Computing
Vulnerability Incidents:
2
Contents
About the Working Group ... 3
Acknowledgments ... 4
1. Implementation ... 5
2. Sources and Methodology of Search ... 5
2.1 How the Articles and Incidents were Collected and Screened ... 6
2.2 Demography of Cloud Data ... 6
3. Total Number of Incidents and Unique News Incidents ... 7
3.1 Some Caveats ... 8
4. Observations of the Cloud Vulnerability Incidents ... 9
4.1 Frequency of Cloud Vulnerability Incidents ... 10
4.2 Proposed New Cloud Threat Categories ... 10
4.3 Causes of Cloud Outages by Threat Category ... 12
4.4 Frequency of Cloud Outages by Threat Category ... 13
4.5 Overview of Incidents by Cloud Provider ... 15
5. Concluding Remarks ... 18
6. References ... 18
3
About the Working Group
Formed in 2013 and led by CSA APAC, the CSA Cloud Vulnerabilities Working Group is chartered to cover the research and standardization of the burgeoning area of cloud vulnerabilities scanning, reporting and solutions. The following white paper reports the state of the cloud, from the cloud computing vulnerability point-of-view. A brief overview of the dataset is also published in IEEE Spectrum Volume 49 Issue 12
(http://spectrum.ieee.org/computing/networks/understanding-cloud-failures).
This white paper and its raw data are protected under the Creative Commons (Attribution-NonCommercial-NoDerivs) license.
CC BY-NC-ND Contact:
Dr. Ryan Ko – [email protected]
4
Acknowledgments
AuthorsRyan K L Ko,Cyber Security Lab, Department of Computer Science, University of Waikato, New Zealand; Cloud Security Alliance (Asia Pacific)
Stephen G Lee, School of Mechanical and Aerospace Engineering, Nanyang Technological University, Singapore V Rajan, School of Mechanical and Aerospace Engineering, Nanyang Technological University, Singapore
Staff
Aloysius Cheang, Managing Director APAC
Brianna Lichtenauer, Copyeditor
Luciano JR Santos, Global Research Director Kendall Scoboria, Graphic Designer
5
1.
Implementation
In an attempt to ascertain Cloud Computing [1] reliability, 11,491 news articles on cloud computing-related outages from 39 news sources between Jan 2008 and Feb 2012 – effectively covering the first five years of cloud computing - were reviewed.
During this period, the number of cloud vulnerability incidents rose considerably. For instance, the number of cloud vulnerability incidents more than doubled over a four year period, increasing from 33 in 2009 to 71 in 2011. A total of 172 unique cloud computing outage incidents were uncovered, of which 129 (75%) declared their cause(s) while 43 (25%) did not. As cloud computing matures into mainstream computing, transparency in the disclosure of outages is imperative.
The investigation revealed that the top three threats were “Insecure Interfaces & APIs” (51 incidents; 29% of all threats), “Data Loss & Leakage” (43 incidents; 25%), and “Hardware Failure” (18 incidents; 10%). These three threats accounted for 64% of all cloud outage incidents. The investigation based its threat categories on the Cloud Security Alliance’s Top Threats to Cloud Computing v 1.0 (CSA Top Threats) [2]. After a thorough review of reported incidents, 128 incidents were grouped into the 8 threats contained in the Top Threats Report while 44 incidents were unable to be categorized. As such, the authors propose five new categories to accommodate the remaining 44 incidents: Hardware Failure, Natural Disasters, Closure of Cloud Service, Cloud-related Malware and Inadequate Infrastructure Designand Planning.
While the investigation did not include unreported cases of outages, the considerable mainstream media coverage of the reported cases under-score their significance. It may be opportune for regulators and consortia to subtly compel cloud vendors to be more transparent in order to make the cloud a more trustable, reliable and secure environment for both end-users and enterprises. A vendor-neutral outage reporting platform could be a start.
2.
Sources and Methodology of Search
Since cloud computing is a relatively recent phenomenon, no published analysis of cloud vulnerability incidents could be found. Therefore, the authors embarked on a methodology to collate and analyze reported cloud incidents.
As of the time of writing, there were more than 50 online news archives on cloud computing, some with as few as 1,000 and others with as many as 10,000 articles on various aspects of cloud computing. Simply using Google returned about 168,000,000 results on cloud computing. As Google was the top search engine in July 2011 according to Experian Hitwise [3], the authors used it to search for cloud vulnerability incidents. Only news reports before 1st January 2012 were accessed. Due to a lack of documented reports on cloud vulnerabilities, all
6
2.1
How the Articles and Incidents were Collected and
Screened
11,491 news articles on cloud computing-related outages from 39 news sources between Jan 2008 and Feb 2012 – effectively covering the first five years of cloud computing - were reviewed.
The search was conducted in two phases: primary and secondary (See Appendix A – Methodology of Search and Categorization). In the primary screening for cloud vulnerability incidents, online news archive portals were scoured for keywords such as “cloud”, “cloud computing”, “cloud outage”, etc.
Then, in the secondary screening, the cloud vulnerability incidents discovered earlier were verified by recourse to other online news archive and search engines, to sieve out duplicate reports and to obtain more information on the incident. If the new search resulted in nothing new, then the articles were treated as secondary or tertiary sources (See Appendix A). After the two screenings of the 11,491 collected news articles, 172 unique cloud computing outage incidents were identified. The raw data is released as Appendix B of this paper.
2.2
Demography of Cloud Data
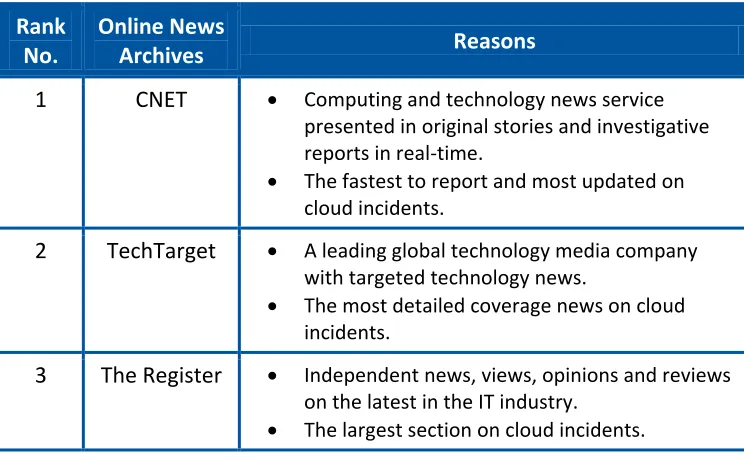
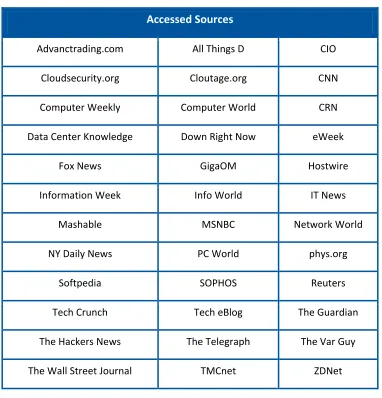
[image:6.612.119.491.404.632.2]The top three main news sources as well as the online news sources accessed by the authors are shown in tables 1 and 2, respectively.
Table 1: Top news sources for cloud computing outages
Rank
No.
Online News
Archives
Reasons
1
CNET
Computing and technology news service presented in original stories and investigative reports in real-time. The fastest to report and most updated on cloud incidents.
2
TechTarget
A leading global technology media company with targeted technology news. The most detailed coverage news on cloud incidents.
3
The Register
Independent news, views, opinions and reviews on the latest in the IT industry.7
Table 2: List of all news sources accessed
Accessed Sources
Advanctrading.com All Things D CIO
Cloudsecurity.org Cloutage.org CNN
Computer Weekly Computer World CRN
Data Center Knowledge Down Right Now eWeek
Fox News GigaOM Hostwire
Information Week Info World IT News
Mashable MSNBC Network World
NY Daily News PC World phys.org
Softpedia SOPHOS Reuters
Tech Crunch Tech eBlog The Guardian
The Hackers News The Telegraph The Var Guy
The Wall Street Journal TMCnet ZDNet
3.
Total Number of Incidents and Unique News
Incidents
The final demography of results obtained after 7 months of research is as follows: Total Number of Online News Sources: 39
Total Number of Reference Sources: 237
Number of Online Cloud articles reviewed: 11,491
8
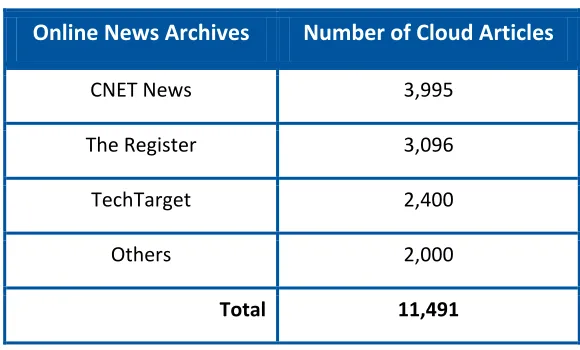
Table 3: Top news sources and their article counts
Online News Archives
Number of Cloud Articles
CNET News 3,995
The Register 3,096
TechTarget 2,400
Others 2,000
Total 11,491
In summary, only 172 out of 11,491 reports reviewed (or about 1.5% of all the online cloud articles retrieved) were related to cloud vulnerability incidents.
3.1
Some Caveats
It is important to note that the data collected is the result of a best effort attempt. Largely, it is due to the lack of transparency of the reports on vulnerabilities in the cloud computing industry. The data on cloud vulnerability incidents may be incomplete for the following reasons:
1. The online news archive sources may not cover all cloud providers, due to a bias towards the more prominent ones.
2. Although search engines can quickly filter findings based on keywords, the sites accessed are often those with high online network traffic. Hence, the incidents reported may be skewed.
3. Since the news articles are from online archives, some incidents before July 2011 when reporting began may have been dropped.
4. It is not mandatory for cloud providers to report incidents.
9
4.
Observations of the Cloud Vulnerability Incidents
129 (75%) of the 172 reported cloud vulnerability incidents declared the cause(s) while 43 (25%) incidents did not.
[image:9.612.116.495.215.497.2]In Figure 1, it can be observed that the top three cloud providers, Amazon, Google and Microsoft, account for about 56% of all non-transparent incidents of cloud vulnerability. Beginning in 2010, cloud providers became more transparent with their reports of cloud vulnerability incidents, most likely because Amazon became more open about the causes of their incidents [4].
Figure 1: Number of incidents reported by cloud service providers 0
1 2 3 4 5 6 7 8 9 10
Numb
er
of Inc
iden
ts
10
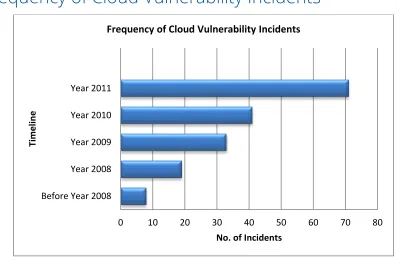
[image:10.612.102.499.88.350.2]4.1
Frequency of Cloud Vulnerability Incidents
Figure 2: Frequency of cloud vulnerability incidents
As is to be expected, over the years the number of cloud vulnerability incidents has risen (see figure 2). In fact from 2009 to 2011 the number of cloud vulnerability incidents more than doubled - from 33 to 71, most likely due to the phenomenal growth in cloud services [5].
4.2
Proposed New Cloud Threat Categories
In 2009, the Cloud Security Alliance propounded the Top Seven Threats to Cloud Computing in all cloud computing environments.
Table 4: Overview of CSA Top Threats v1.0
No.
CSA Top Threat
1
Abuse and Nefarious Use of Cloud Computing
2
Insecure Interfaces and APIs
3
Malicious Insiders
4
Shared Technology Issues
5
Data Loss or Leakage
6
Account or Service Hijacking
7
Unknown Risk Profile
0 10 20 30 40 50 60 70 80
Before Year 2008 Year 2008 Year 2009 Year 2010 Year 2011
No. of Incidents
Timelin
e
[image:10.612.137.474.522.699.2]11
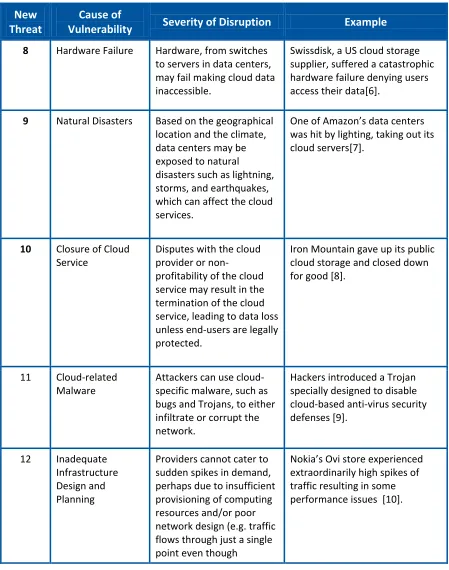
However, our investigations revealed that five more threat categories are needed for a more accurate
[image:11.612.82.531.148.718.2]representation of cloud outage threats and vulnerabilities. The five new categories - Threats 8 to 12 - proposed by the authors are explained in Table 5.
Table 5: Description of new threats uncovered
New
Threat
Cause of
Vulnerability
Severity of Disruption
Example
8 Hardware Failure Hardware, from switches to servers in data centers, may fail making cloud data inaccessible.
Swissdisk, a US cloud storage supplier, suffered a catastrophic hardware failure denying users access their data[6].
9 Natural Disasters Based on the geographical location and the climate, data centers may be exposed to natural
disasters such as lightning, storms, and earthquakes, which can affect the cloud services.
One of Amazon’s data centers was hit by lighting, taking out its cloud servers[7].
10 Closure of Cloud Service
Disputes with the cloud provider or
non-profitability of the cloud service may result in the termination of the cloud service, leading to data loss unless end-users are legally protected.
Iron Mountain gave up its public cloud storage and closed down for good [8].
11 Cloud-related Malware
Attackers can use cloud-specific malware, such as bugs and Trojans, to either infiltrate or corrupt the network.
Hackers introduced a Trojan specially designed to disable cloud-based anti-virus security defenses [9].
12 Inadequate Infrastructure Design and Planning
Providers cannot cater to sudden spikes in demand, perhaps due to insufficient provisioning of computing resources and/or poor network design (e.g. traffic flows through just a single point even though
12
sufficient hardware is available) – resulting in unacceptable network latency or inability to meet agreed service levels.
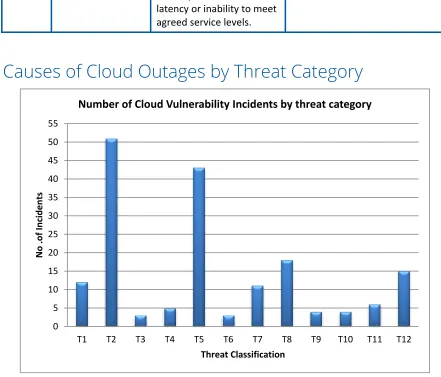
[image:12.612.81.522.115.492.2]4.3
Causes of Cloud Outages by Threat Category
Figure 3: Number of reported cloud outages by threats
Figure 3 shows the frequency of occurrence of the existing seven CSA threats, and five new threats proposed by the authors. The three most frequent incidents are:
CSA Threat 2 “Insecure Interfaces & APIs” with 51 incidents accounting for 29% of all threats; CSA Threat 5 “Data Loss & Leakage” with 43 incidents accounting for 25% of all threats reported; New Threat 8 “Hardware Failure” with 18 incidents accounts for 10% of all threats reported. All other threats have 15 or fewer cloud vulnerability incidents each, accounting for 8.5% or less.
0 5 10 15 20 25 30 35 40 45 50 55
T1 T2 T3 T4 T5 T6 T7 T8 T9 T10 T11 T12
No
.o
f
In
ciden
ts
Threat Classification
13
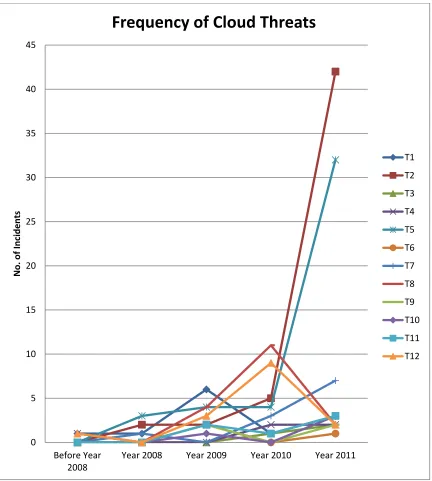
[image:13.612.163.450.121.441.2]4.4
Frequency of Cloud Outages by Threat Category
Table 6: Frequency of cloud outage incidents by threat category
Threat
Category
Before
2008
2008
2009
2010
2011
T1 1 1 6 1 3
T2 0 2 2 5 42
T3 0 0 0 1 2
T4 1 0 0 2 2
T5 0 3 4 4 32
T6 0 0 2 0 1
T7 0 1 0 3 7
T8 1 0 4 11 2
T9 0 0 2 0 2
T10 0 0 1 0 3
T11 0 0 2 1 3
T12 1 0 3 9 2
It can be observed from Table 6 and Figure 4 that with the growth of cloud services from 2008 [11], there was also a corresponding rise in the number of cloud computing threats.
14
Figure 4: Frequency of cloud threats
A Pareto analysis reveals that the first three threats, CSA Threat 2, CSA Threat 5, and New Threat 8, account for 64% of all cloud vulnerability incidents, although collectively they make up only 25% of total threats (see Figure 5).
0 5 10 15 20 25 30 35 40 45
Before Year 2008
Year 2008 Year 2009 Year 2010 Year 2011
No.
of Inc
iden
ts
Frequency of Cloud Threats
15
Figure 5: Pareto analysis of the number of incidents
4.5
Overview of Incidents by Cloud Provider
We were also able to sort the collected data by cloud provider, and generate the charts shown in Figure 6, 7, and 8 below.
Figures 6 and 8 show the breakdown of cloud provider incidents and the breakdown of cloud providers according to incidents with unknown causes respectively.
It is perhaps important to note in Figure 5 that the number of incidents reported may have a correlation to market share, but it is noteworthy to observe companies which have a large customer base but relatively lesser cloud outages.
It is shown in Figure 7 that 25% of reported cloud outages did not reveal the causes of the outages. Figure 8 reports a breakdown of cloud providers by the 25% incidents (from Figure 6) that did not report a cause of the outages. It is the aim of this report to encourage transparency and accountability from cloud service providers.
0%
10%
20%
30%
40%
50%
60%
70%
80%
90%
100%
0
20
40
60
80
100
120
140
160
180
T2 T5 T8 T12 T1 T7 T11 T4 T10 T9 T3 T6
Number of In
ciden
ts
16
Figure 6: Breakdown of cloud provider incidents Amazon Google Microsoft Sony Apple Facebook Salesforce.com VMWare Citigroup Flickr Nokia Oracle Rackspace Sage Twitter Xcalibre Acer Atari & Square Enix Cloud Engines Cloud Nine CyberLynk Danger Dropbox Electronic Arts EMC EndNote Epsilon GoGrid Heartland HP Humyo Intuit Iron Mountain LastPass Liquid Motors Livedrive Ma.gnolia Netflix Nirvanix Ricoh RSA SK Communications SwissDisk Terremark Toshiba Zendesk Zoho
17
Figure 7: Transparency of causes of cloud vulnerabilities
Figure 8: Breakdown of cloud provider vulnerabilities with unknown reasons Known
Causes 75% Unknown
Causes 25%
Threat Cause Transparency Chart
0 2 4 6 8 10
[image:17.612.82.534.362.557.2]18
5.
Concluding Remarks
A systematic investigation into reported vulnerabilities in cloud computing such as outages, downtimes, and data loss was conducted. Online news archives were scoured for cloud vulnerability incidents, followed by other online news archives and search engines. Out of about 11,491 articles retrieved, only 1.5% pertained to
vulnerabilities in cloud computing; 25% of these did not disclose their causes. However, the number of cloud vulnerability incidents over the past 5 years has risen considerably.
The authors adopted the CSA’s Top Seven Threats in Cloud Computing v1.0 guideline as a reference taxonomy to track cloud vulnerability incidents. CSA Threats 2 (Insecure Interfaces & APIs), 5 (Data Loss or Leakage), and New Threat 8 (Hardware Failure), constitute 25% of threats and account for 64% of all cloud vulnerability incidents. There is clearly a need for more efforts to increase the accountability [12, 13] of cloud service providers. It is clear that mandatory reporting of probable causes of cloud incidents and the possible counter measures can foster best practices in the industry.
6.
References
[1] R. K. L. Ko, "Cloud computing in plain English," ACM Crossroads, vol. 16 (3), pp. 5-6, 2010. [2] Cloud Security Alliance. (2010). Top Threats to Cloud Computing (V1.0). Available:
https://cloudsecurityalliance.org/topthreats/csathreats.v1.0.pdf
[3] A. Banks. (2011, 7th April 2012). Microsoft’s Bing regains position as UK’s 2nd favourite search engine. YouTube accounts for 1 in every 35 UK Internet visits. Available: http://www.hitwise.com/uk/press-centre/press-releases/bing-uks-second-favourite-search-engine/
[4] C. Brooks. (2010, 7th April 2012). IT shops cheer new openness at Amazon following outage. Available:
http://searchcloudcomputing.techtarget.com/news/1507837/IT-shops-cheer-new-openness-at-Amazon-following-outage
[5] C. Babcock. (2009, 7th April 2012). Cloud Implementation To Double By 2012. Available:
http://www.informationweek.com/news/services/saas/214502033?queryText=cloud
[6] C. Mellor. (2009, 7th April 2012). Swissdisk suffers spectacular cloud snafu. Available:
http://www.theregister.co.uk/2009/10/19/swissdisk_failure/
[7] C. Metz. (2009, 7th April 2012). Lightning strikes Amazon cloud (honest). Available:
http://www.theregister.co.uk/2009/06/12/lightning_strikes_amazon_cloud/
[8] C. Mellor. (2011, 7th April 2012). Bruised Iron Mountain gives up on storage cloud. Available:
http://www.theregister.co.uk/2011/04/11/iron_mountain_exits_public_storage_cloud/
[9] J. Leyden. (2011, 7th April 2012). Chinese Trojan blocks cloud-based security defences. Available:
http://www.theregister.co.uk/2011/01/20/chinese_cloud_busting_trojan/
[10] B. Ray. (2009, 7th April 2012). Ovi still bouncing on and offline. Available:
http://www.theregister.co.uk/2009/05/27/ovi_down/
19
[12] R. K. L. Ko, P. Jagadpramana, M. Mowbray, S. Pearson, M. Kirchberg, Q. Liang, et al., "TrustCloud - A Framework for Accountability and Trust in Cloud Computing," in IEEE 2nd Cloud Forum for Practitioners (IEEE ICFP 2011), Washington DC, USA, 2011, pp. 1-5.
20
[image:20.612.57.510.70.721.2]Appendix A - Methodology of Search and
Categorization
Figure 9: Flowchart showing the primary screening
Yes No
Cloud Computing
Involved? Keyword Search
Discard
Cloud Vulnerability
Incident?
Yes No
Discard
Yes No
New Threat (s) CSA Threat (s)
Yes No
Cause of
Vulnerability
Known?
Unknown Causes CSA’s Top Threats
for Cloud
21
Figure 10: Flowchart showing the secondary screening
Yes No
Cloud Computing
Involved?
Discard
NEW Cloud
Vulnerability
Yes No
Use as SECONDARY or TERTIARY
Source
CSA’s Top Threats for
Cloud Computing?
Yes No
New Threat (s) CSA Threat (s)
Yes No
Cause of
Vulnerability Known?
Unknown Causes
Incident Search