unit 11
Probability
at the carnival
le a rn in g g o a ls
use the language of probability
conduct experiments predict the results of
experiments
draw tree diagrams
compare actual results w ith predicted results
use probability to solve and pose problems
K ey W o rd s
p r o b a b l e
improbable
p re d ictio n
experiment
outcome
p ro b a b ility
equa lity p ro b a b le
tre e d ia g ra m
pre d icte d re sults
Look at the different carnival games.
Which games would you play? Why?
Which game would you likely win? Explain.
Which game would you likely lose? Explain.
L E S S O N
1
1
The Language of Probability
Is the month after June always July?
Some events are impossible. Some events are certain.
Events that could happen are possible.
explore
Make a table with these headings. Write 5 events under each heading.
Impossible Possible Possible Certain but Unlikely and Likely
S h o w a n d S h a re
Share your events with another pair of students.
Do you agree about the likelihood of each event? Explain.
400
Can you find a flower that talks?
H
ey
,
HoW's
I T
c o n n e c t
If an event is likely to happen, it is probable.
If an event is unlikely to happen, it is improbable.
Luis has these coins in his pocket.
9 pennies 2 nickels 2 dimes
One coin falls out.
How likely is it that this coin is:
a a a a
It is impossible for the coin to be a because Luis doesn't have any quarters.
It is probable that the coin is a because most of Luis'coins are pennies.
The coin is most likely to be a
It Is improbable that the coin Is a or a because Luis has only 2 of each coin.
The coin is equally likely to be a or a
You can use a line to show how likely it is an event will happen.
unlikely - likely
practice
1
.
Use the words "impossible, "possible," ''certain," "unlikely, or "likely" to describe each event.a) It will snow tomorrow.
b) You will have orange juice with your lunch today.
c) You will see a whale next week.
d) You will go camping in the spring.
e) Tomorrow is Friday.
f) The sun will rise tomorrow.
n u m b e s e v e ry d a y
N u m b e r Strate gies
Find the fe w e st coins that would make each amount.
49 cents $1.67 $3.99
2. This spinner is from a board game.
The pointer is spun.
a) Which colour Is the pointer most likely to stop on? How do you know?
b) It is equally likely that the pointer will stop on one of two colours.
What are the two colours? How do you know?
c) Write a statement about the pointer using the word "impossible."
3. Fatima Is playing this game for the first time. She throws a dart at the target.
a) Is It likely Fatima will hit the bulls-eye? Explain your answer.
b) Explain why the chances of hitting white or red are not equally likely.
c) Design a target so the chances of hitting red or white are equally likely.
Show your work.
4. Suppose you close your eyes, then pick one marble from this bag.
Say which colour:
a) You are most likely to pick.
b) You are least likely to pick.
c) You will never pick.
5. Draw a bag of marbles for which:
a) Picking a pink marble is a likely event.
b) Picking a green marble is an unlikely event
c) Picking an orange marble is possible.
d) Picking a black marble is impossible.
Reflect
Which event Is likely to happen at school today?
Which event is unlikely to happen at school today? Explain.
W hat are tw o likely events and tw o unlikely events that could happen at home this week?
L e s s o n
6
Identifying Outcomes and
Predicting Results
A meteorologist predicts the weather.
When you decide the likelihood of an event, you make a prediction.
e x p lo r e
You will need a blank spinner and an open paper clip as a pointer.
Design your own spinner. Use four colours.
List the possible outcomes of a spin. Predict which colour the pointer is most likely to stop on.
Test your prediction by spinning the pointer.
Record your results in a tally chart. Repeat this until you have the results from 20 trials.
How do your results compare with your prediction?
S h o w a n d S h a r e
Compare your spinner with that of another pair of students. How are the spinners alike? Different?
How are the results alike? Different?
connect
This is a spinner from a game board. There are 7 equal sectors.
There are 7 possible outcomes,
but only 3 different outcomes.
Spinning the pointer is an experiment.
To predict the results of the experiment, you find how likely each outcome is.
This is called the probability of the outcome.
• Three sectors show "Move 2 spaces forward."
The probability of "Move 2 spaces forward" is 3 out of 7.
You write this as a fraction: 3 over 7
The probability of "Move 2 spaces back" is 2 out of 7.
You write: 2 over 7
The probability of "Miss a tu rn " is 2 out of 7. You write: 2 over 7
"Move 2 spaces forward" is most probable.
"Move 2 spaces back" and "Miss a turn" are equally probable.
You can show probabilities on a line.
Probability 0
less probable
1 /2
more probable
practice
1
.
List the possible outcomes for each experiment.a) tossing a coin
b) rolling a number cube
2. Use the words "more probable,""less probable," or "equally probable" to compare each pair of events.
a) It will rain today. It will snow today.
b) You will eat dinner today.
You will eat breakfast tomorrow.
c) You will sleep for 1 hour tonight. You will sleep for 8 hours tonight.
d) The pointer on each spinner will land on red.
Spinner A Spinner B
3. Use question 2 to give you ideas. Make up two events.
Use the words "more probable,""less probable," or "equally probable" to compare the events.
4. The pointer on this spinner is spun.
a) What are the possible outcomes?
b) What is the probability of the pointer landing on each fruit?
• banana • apple • orange • pear
c) Describe the likelihood of each outcome.
Use the words "most probable,""equally probable," or "less probable."
5. Suppose you close your eyes, then pick a marble from this jar.
a) What are the possible outcomes?
b) What is the probability that you pick each marble? • a red marble
• a yellow marble • a black marble
c) Which outcome is most probable? Least probable?
d) Which outcomes are equally probable?
6. Design a spinner so that when the pointer is spun: • Landing on red is most probable.
• Landing on blue is impossible.
• Landing on green and landing on yellow are equally probable. • Landing on purple Is least probable.
Explain your work.
7. Todd and Anna disagree on the probabilities of the outcomes for this spinner.
Todd thinks that the pointer landing on 1 is more probable than the pointer landing on any other number.
Anna thinks that the pointer landing on 2 Is more probable because it has two spaces on the spinner.
Who is correct? Why?
reflect
Suppose you have a spinner with equal sectors and different colours.
What do you know about the probability of landing on each colour?
Use words, pictures, or numbers to explain.
Number Strategies
Estimate each product.
52 times 3 71 times8 327 times5 415 times 2
L E S S O N
3
Strategies Toolkit
E x p l o r e
Jolene has a nickel, a dime, and a loonie in one pocket. She has a $5 bill, a $10 bill, and a $20 bill in another pocket. Without looking, Jolene picks one coin and one bill.
What is the probability that Jolene picks a $ 10 bill and a dime?
S h o w
and
S h a re
Describe the strategy you used to solve the problem.
connect
Scott has 4 pairs of pants: red, blue, black, green Scott has 3 T-shirts: white, blue, purple
Scott dresses in the dark.
What is the probability that he chooses the blue pants and blue T-shirt?
What do you know?
• Scott has 4 pairs of pants and 3 T-shirts.
• He chooses 1 pair of pants and 1 T-shirt.
Think of a strategy to help you solve the problem. • You need to find out how many possible outfits
there are.
You can draw a picture.
Strategies
• Make a table.
• Use a model.
• Draw a picture.
• Solve a simpler problem.
• Work backward.
• G uess and check.
• Make an organized list.
• Use a pattern.
Draw a tree diagram. List the pants. Next to each pair of pants, list the T-shirts. Then list all possible outfits.
Pants T-Shirts Possible Outfits
White Red Pants, White T-shirt
red Blue Red Pants, Blue T-shirt — Purple Red Pants, Purple T-shirt
Copy and complete the tree diagram. How many outfits does Scott have?
What is the probability that Scott chooses the blue pants and blue T-shirt?
How could you solve this problem a different way?
p r a c t i c e
1
.
There are four types of sandwiches onwhite or brown bread: cheese, tuna, tomato, egg Suppose you pick a sandwich without looking.
What is the probability that you pick a tuna on brown bread?
2. Students' names are put in two bags.
The teacher, without looking, picks one name from each bag. Bag A has Amy, Alice, Jan, and Joline.
Bag B has Brock, Brady,Tran, and Kim.
What is the probability that Jan and Tran are picked?
Choose one of the
Strategies
reflect
Exploring Predictions
explore
You will need an envelope, 10 paper clips of one colour, and 10 paper clips of another colour.
Close your eyes while your partner puts at least 10 paper clips in the envelope.
Your partner tells how many there are in total.
There must be two colours of paper clips in the envelope.
Without looking, take 1 paper clip from the envelope. Record the colour, then put the paper clip back.
Repeat the experiment until you have the results of 20 trials.
Use the results to predict how many paper clips of each colour are in the envelope.
Take the paper clips from the envelope and compare the numbers of paper clips with your prediction.
Trade roles and repeat the experiment.
S h o w and S h a r e
How close was your estimate of the numbers of paper clips to the actual numbers?
Suppose you carried out only 5 trials.
Would your predictions
have been the same? Explain.
410
4
connect
Sue and Tim conducted an experiment with 2 colours of tiles in a paper bag.
Sue put 2 red tiles and 8 blue tiles in the bag. Tim picked a tile, recorded its colour,
then returned the tile to the bag. Here are the results.
red
B lu e
The experiment suggests that there are about 3 times as many blue tiles as red tiles.
Tim knows there are 10 tiles in the bag. So, Tim estimates 3 red tiles and 7 blue tiles.
numbers every day
Calculator S k ills
Order from least to greatest. 0.72 . 3 over 4. 7 over 10. 0.77 . 80 over 100
Describe the strategies you used.
practice
1
.
Work with a partner.One student puts paper clips of 3 colours in an envelope, then tells how many in total.
The other student conducts an experiment to find how many of each colour.
a) Decide how many trials you will conduct.
b) Conduct the trials, then make a prediction.
c) Count the number of paper clips of each colour. How close was your prediction?
2
.
Use a coin.a) Predict how many times heads and tails will show when you toss the coin 30 times.
b) Conduct the experiment.
math link
Your World
A com pany th a t makes potato chips offers a prize to any person w ho finds a game piece in a bag of chips. The probability of winning each prize is w ritte n on the bag. The probability of w inning a free packet of chips is
1 out of 20, or
3.
Use a copy of this spinner.
a) Predict how many times the pointer will land on each colour in 25 spins.
b) Conduct the experiment.
c) How do the results compare with your predictions?
4. Use a number cube.
a) Predict how many times each number will show when you roll the cube 25 times.
b) Conduct the experiment.
c) How do the results compare with your predictions? Explain your work.
reflect
Describe an experiment you conducted,
and how you used it to check your predictions.
l e s s o n
5
Predicted and Actual Results
explore
You will need a number cube.
Suppose you roll the number cube 30 times. Predict how often each outcome will occur. • You roll a 6.
• You roll an even number. • You roll an odd number.
What is the probability of each outcome? Are the outcomes equally probable? Explain. Re-cord your predictions.
Roll a number cube 30 times. Re-cord your results on a tally chart.
1 2 3 4 5 6
S h o w
S h a r e
How do your results compare with your predictions? Combine your results with those of another pair of students.
What do you notice about the combined results?
Combine your results with those of ail your classmates. What do you notice?
numbers every day
N u m b er Strate gies
Estimate each sum.
connect
Here are the results of another experiment. The spinner has 8 equal parts.
Milly will spin the pointer 50 times.
Since 1/2 of the spinner is red,
Milly predicts red will come up 25 times.
Since 1/4 of the spinner is green,
Milly predicts green will come up about 12 or 13 times.
Since 1/8 of the spinner Is yellow and 1/8 is blue,
Milly predicts yellow and blue will each come up about 6 or 7 times.
The probability that the pointer lands:
• on red is 4 out of 8, or 4 eighths
• on green is 2 out of 8, or 2 eighths
• on yellow is 1 out of 8, or 1 eighth
• on blue is 1 out of 8, or 1 eighth
Milly spun the pointer 50 times.
Here are her results. Red
22
green 15
yellow 7
Blue
6
Milly's results are close to her predictions.
Milly combined her results with the results of 3 classmates, for a total of 200 spins.
Milly now predicted that: • Red should show 100 times. • Green should show 50 times.
• Each of yellow and blue should show 25 times.
Red 99
g reen 51
Yellow
26
Blue 24
Here are the combined results.
The combined results suggest that the more trials you conduct, the closer the predicted results are to the actual results.
Prac tic e
1. Work with a partner.
a) Suppose you spin the pointer on this spinner 100 times.
• Predict how many times the pointer will land on each colour.
• What is the probability of the pointer landing on each colour?
b) Use a copy of this spinner.
Spin the pointer 100 times. Re-cord your results.
How do your predicted results compare with your actual results?
2. Work with a partner.
Suppose you roll a number cube 100 times.
• Predict how many times each outcome below occurs. • What is the probability of each outcome?
• Roll the number cube 100 times. Re-cord your results.
• How do your predicted results compare with your actual results? • Combine your results with those of another pair of students.
What are your new predicted results?
How do they compare with the actual results?
a) You roll a 2.
b) You roll a number greater than 2.
3. This graph shows the
predicted results for a spinner. Draw a spinner that
corresponds to the bar graph. Explain your work.
reflect
How do predicted results and actual results compare when you repeat an experiment many times?
u n it 11
What You know?
LESSON
1
1. Use the words "likely","unlikely"," i mpossible," "possible," or "certain" to describe each event.a) It will rain tomorrow.
b) You will be in school this afternoon.
c) You will go canoeing in January.
d) You will travel to the moon In the future.
2
.
2.
The Grade 4 class cannot agree on a name for its new goldfish: Drew or Jamie.One student says:
Let's roll a number cube to decide. If 3 or higher comes u p ,
we’ll choose Drew. If not we’ll choose Jamie,
Is this a fair way to choose? Explain.
3
3. Dezi packed these clothes for a trip:red shirt, green shirt, blue shirt, yellow shirt, brown pants, black pants
Dezi takes a shirt and a pair of pants from her suitcase, without looking. What is the probability Dezi picks a yellow shirt and brown pants?
LESSON
4
4. Which spinner below most likely has these results after 100 spins?60 blue and 40 red
Spinner A Spinner B
Explain your thinking.
5
5. These paper clips are put in an envelope.
a) Suppose you pick a paper clip, without looking. What is the probability the paper clip is red?
b) Suppose you conducted the experiment 50 times.
Predict how many times
you would pick a red paper clip.
c) Conduct the experiment 50 times. Re-cord your results.
d) How do your predicted results compare with the actual results?
e) Combine your results with the results of 3 classmates.
What are your new predicted results? How do they compare with the
actual results?
u n it 1 1 le a rn in g G o a ls
use the language of probability
conduct experiments predict the results of experiments
draw tree diagrams
compare actual results w ith predicted results
U n it
problem
at the Carnival
Think about the carnival games on pages 398 and 399.
Design 3 new carnival games. • one game in which winning is
not probable
• one game in which winning and losing are equally probable
• one game in which the probability of winning is 1 out of 5
Write about each game you design.
Check lis t
Your w o rk should show your designs fo r 3 games a description of each game, using probability how you found the probability of winning each game
appropriate language to explain the games
Reflect on the Unit
Write about a way you could use
c
ro
s
s
strand
I n v e s t i g a t i o n
Fair Game?
You will need a number cube and a shoebox lid.
The game board is a shoebox lid. It is divided into 4 different coloured sections. Here are the rules.
Each player chooses a different section.
Take turns to drop a number cube onto the middle of the board.
If the number cube lands on your section, you score the number shown on the cube. If the cube lands on a diagonal, nobody scores.
The first player to score 25 points wins.
David lost the first game. He said:
The game board is not fair.
My area is not one quarter o f the board. I’m not as likely to win a point as Maria o r Lindsay.
Investigate David's statement.
Does this game board show fourths? Explain
Test the game board. Use a shoebox. Draw the diagonals of the base.
Make each section a different colour. Re-cord the results. Does the game board seem fair? How do you know?
Lindsay suggested changing the shape of the board.
Investigate other 4-sided game boards. Which shapes give a fair game board? How do you know?
How are the fair game boards alike?
Display Your Work
Report your findings using words and pictures.
Take It Further
U n its 1-11
Cumulative
Review
UNIT
1.
1.
On a hundred chart:Shade all the multiples of 3 in one colour.
Shade all the multiples of 5 In a different colour.
a) Describe the position pattern for each set of multiples.
b) Write the pattern rule for each set of multiples.
c) Look at the numbers shaded in both colours. Write the pattern rule for these numbers.
Describe the position pattern for these numbers.
2
.
Write 15 as the sum of three numbers. 15 = + +H o w m a n y different w a ys ca n yo u d o it?
2
.
3. Write a low estimate and a high estimate for each sum.a) 713 + 126 b) 235 + 418 c) 436 + 96 Tell about the strategies you used.
4. Halifax is 4,975 km from Calgary. Calgary is 1,050 km from Vancouver.
a) How much closer is Calgary to Vancouver than to Halifax?
b) Suppose you drove from Halifax to Calgary to Vancouver. How far would you go?
3
.
5. Use 20 Snap cubes.How many different rectangular prisms can you make with a volume of 20 Snap cubes?
Describe each prism you make.
6. Which figures are similar? How do you know?
UNIT
3.
7. Use Plasticine and straws.Make a skeleton of a square pyramid.
How many edges and how many vertices does it have?
4
.
8.
There are 8 nickels and 7 dimes in a change purse. How many cents is that?9. Estimate each product.
a) 5 times 52 b) 68 times 6 c) 4 times 44 d) 9 times32
10. There are 85 counters.
They are to be shared equally among 6 students. Each student needs 14 counters.
Are there enough counters? Explain.
5
.
f avourite Animal
B ird Cat
h a m s t e r
Horse R a b b it
N u m ber of Students
a) Draw a bar graph to display these data. What scale will you use?
b) Which animal is twice as popular as the rabbit? c) What is the range of the data?
d) How many more students chose a cat over a hamster?
e) Suppose students in Grades 1 and 2 were asked about their favourite animals. Would the data change? Explain.
f) Write a question about the tally chart or bar graph. Answer your question.
unit
5
12. This circle graph shows the weather every day for the month of April in one Alberta town.a) About what fraction of the month was it rainy? Cloudy? Sunny?
b) About how many days was it rainy? Explain.
April Weather in Alberta
6
13. Danny and Laurie met for lunch. Danny arrived at quarter past 1. Laurie arrived at 1:05 p.m.a) Who arrived second?
How many minutes later was this person?
b) Draw a digital clock and an analog clock to show the time each person arrived.
7
14. Use dot paper.Draw each figure and its lines of symmetry,
a) square b) rectangle c) parallelogram Which figure has the most lines of symmetry?
The fewest lines of symmetry?
8
15. Fill in each missing number.a) 1.8 plus 3.6 = □ b) 4.5 minus 1.7 = □
c) 5.9 plus 2.3 = □ d) 8.4 minus 3.6 = □
9
16. The tallest known giraffe was about 6.10 m tall The tallest human was about 272 cm tall. Which was taller? How much taller? Give your answer in centimetres.UNIT
9
17 Use 1-cm grid paper.a) Draw 2 different figures with area 18 cm squared.
b) Draw 2 different figures with perimeter 30 cm.
18. Multiply.
a) 2 times198 b) 4 times136 c) 333 times 3 d) 164 times5
19. This growing pattern is made with rhombuses. The pattern continues.
The length of each side of a rhombus is 1 unit.
Frame 1 Frame 2 Frame 3
a) Look at the first three frames.
What is the perimeter of each frame?
b) What is the perimeter of frame 4? Frame 7? Frame 10? c) Which frame has a perimeter of 30 units? Explain.
20. Divide.
a) 368 ÷ 4 b) 2 2 9÷ 5 c) 1 3 6 ÷ 6
1
0
21.
Use a copy of this spinner.a) Predict how many times
the pointer will land on each colour in 30 spins,
b) Conduct this experiment. c) How do the results compare
with your prediction?
a.m.: A time between midnight and just before noon.
Angle: Two straight lines cross to form an angle. Each side of an angle is called an arm. We show an angle by
Area: The amount of surface a figure or region covers. We measure area in square units, such as square
centimetres and square metres.
Arm: See Angle.
Axis (plural: axes): A number line along the edge of a graph. We label each axis of a graph to tell what data it displays.
Bar graph: Displays data by using bars of equal width on a grid. The bars may be vertical or horizontal.
Base: The face that names a solid.
Capacity: A measure of how much a container holds. We measure capacity in litres or millilitres.
Centimetre: A unit to measure length. We write one centimetre as 1 cm. 1 cm = 0.01 m
Century: A unit of time equal to 100 years.
Changing-step growing pattern:
A number pattern where the number added increases.
2 3 5 8 12 17
+1 +2 +3 +4 +5
Circle graph: Displays data using a circle divided into sectors. We use a circle graph to show data about one whole or one group.
Clockwise / Counterclockwise: The hands on a clock turn in a clockwise direction. The opposite direction is called counterclockwise.
Cone: A solid with a circular base, curved surface, and a vertex.
426
Illustrated Glossary
Congruent figures: Two figures that have the same size and shape are congruent.
Coordinates: Describe a location on a grid. Coordinates use a letter and a number to label a column and a row on the grid. The coordinates D2 show the location of the airport on this map:
Core: See Repeating pattern.
Cube: A solid with 6 faces that are congruent squares. Two faces meet at an edge.
Cylinder: A solid with 2 congruent circular bases joined by a curved surface.
Decade: A unit of time equal to 10 years.
Decagon: A polygon with 10 sides.
Decimal: A way to write a fraction or mixed number. The mixed number 3 and two tenths can be written as the decimal 3.2.
Decimal point: Separates the whole number part and the fraction part in a decimal. We read the decimal point as "and." We say 3.2 as "three and
two-tenths."
Decimetre: A unit to measure length. We write one decimetre as 1 d.m.
1 decimetre = 0.1 m and 1 decimetre = 10 cm
Degree: 1. A unit to measure the size of an angle. The symbol for degrees is°.
2. A unit to measure temperature. We write one degree Celsius as 1°C.
Denominator: The part of a fraction that tells how many equal parts are in one whole. The denominator is the bottom number in a fraction.
Difference: The result of a subtraction. The difference of 5 and 2 is 3;
o r 5 minus 2 = 3.
Edge: See Cube.
Elapsed time: The amount of time that passes from the start to the end of an event. The elapsed time between when you eat lunch and the end of school is about 3 hours.
Equally probable: The outcomes of an event that are equally likely. For example, if you toss a coin, it is equally probable that the coin will land heads up as tails up.
Equation: Uses the = symbol to show two things that represent the same amount. 5 plus 2 = 7 is an equation.
Estimate: Close to an amount or value, but not exact.
Face: See Cube.
Factor: Numbers that are multiplied to get a product. In the multiplication sentence, 3 times 7 = 21, the factors of 21 are 3 and 7.
Gram: A unit to measure mass. We write one gram as 1 g. 1,000 g = 1 kg
Grid: See Coordinates.
Growing pattern: A number pattern where we add a number to a term or multiply a term by a number to get the next term.
Hexagon: A polygon with 6 sides.
Hundredth: A fraction that is one part of a whole when it is divided into 100 equal parts. We write one hundredth as or 0.01.
Image: The figure that is the result of a transformation. This is a rectangle and its image after a translation of 6 right and 1 up.
Improbable: An event that is unlikely to happen but not impossible.
Improper fraction: A fraction that shows an amount greater than one whole. The numerator is greater than the denominator, 3 over 2 is an improper fraction.
Key: See Pictograph.
Kilogram: A unit to measure mass. We write one kilogram as 1 kg.
1 kg = 1,000g
Kilometre: A unit to measure long distances. We write one kilometre as 1 km. 1 km = 1,000 m
Kite: A figure with 4 sides where two pairs of adjacent sides are equal.
Line of symmetry: Divides a figure into two congruent parts. If we fold the figure along its line of symmetry, the parts match.
line of symmetry
Linear dimension: Length, width, depth, height, and thickness.
Litre: A unit to measure the capacity of a container. We write one litre as 1 L. 1 L= 1,000mL
Mass: Measures how much matter is in an object. We measure mass in grams or kilograms.
Metre: A unit to measure length. We write one metre as 1 m.
1 m = 100 cm
Millennium: A unit of time equal to 1,000 years.
Millilitre: A unit to measure the
capacity of a container. We write one millilitre as 1 mL. 1,000 mL = 1 L
Millimetre: A unit to measure length. We write one millimetre as 1 mm. One millimetre is one-tenth of a centimetre; 1 mm = 0.1 cm. 10 mm = 1 cm
Mixed number: Has a whole number part and a fraction part. 3 and a half is a mixed number.
Multiple: Start at a number then count on by that number to get the
multiples of that number. Start at 3 and count on by 3 to get the
multiples of 3: 3,6,9,12,15,...
Multiplication fact: A sentence that relates factors to a product.
3 times7 = 21 is a multiplication fact.
Number line: Has evenly-spaced numbers marked in order.
Numerator: The part of a fraction that tells how many equal parts to count. The numerator is the top number in
a fraction. In the fraction 2/3, the numerator is 2, and we count 2 thirds of the whole.
Octagon: A polygon with 8 sides.
Outcome: One result of an event or experiment. Tossing a coin has two possible outcomes. The coin could land heads up or tails up.
p.m.: A time between noon and just before midnight.
Parallel: Two lines that are always the same distance apart are parallel.
Parallelogram: A figure with 4 sides, where 2 pairs of opposite sides are parallel.
Pattern rule: Describes a pattern or how to make a pattern. To make the pattern 1,2,4,8,16,..., use the pattern rule: Start with 1, then multiply by 2 each time.
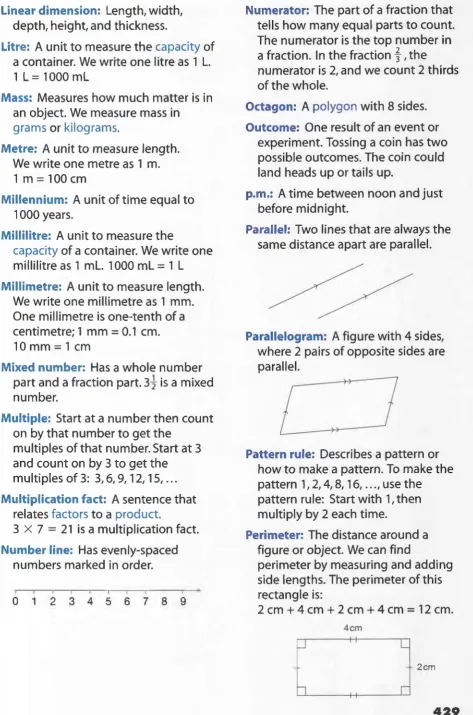
Perimeter: The distance around a figure or object. We can find
perimeter by measuring and adding side lengths. The perimeter of this rectangle is:
Pictograph; Uses pictures and symbols to display data. Each picture or symbol can represent more than one object. A key tells what each picture represents.
Polygon: A closed figure with three or more straight sides. We name a polygon by the number of its sides. For example, a five-sided polygon Is a pentagon.
Prediction: You make a prediction when you decide how likely or unlikely it is that an event will happen.
Prism: A solid with 2 bases.
Probability: Tells how likely it is that an event will turn out a certain way. Rolling a 6-faced number cube has 6 equally probable results. The probability that you will roll a 2 is
Probable: An event that Is likely but not certain to happen.
Product: The result of a multiplication. The product of 5 and 2 is 10;
o r 5times2 = 10.
Proper fraction: Describes an amount less than one. A proper fraction has a numerator that is less than its
denominator. 5 seventh is a proper fraction.
Protractor: An instrument that
measures the number of degrees in an angle.
Pyramid: A solid with 1 base and triangular faces.
Quadrilateral: A figure with 4 sides.
Range: Tells how spread out the numbers in a set of data are. We find the range by subtracting the least value from the greatest value. The range in the heights of the children is 122 cm - 100 cm = 22 cm.
Rectangle: A figure with 4 sides, where 2 pairs of opposite sides are equal and each angle is a right angle, or 90".
Rectangular prism: See Prism.
Reflection: Reflects a figure in a mirror line to create a congruent image. This is a triangle and its reflection image.
Regular figure: A polygon with all sides equal and all angles equal. Here is a regular triangle.
Related facts: Addition and subtraction have related facts. 2 plus 3 = 5 Is related to 5 minus 3 = 2. Multiplication and division have related facts.
5 times6 = 30 is related to 30 minus 5 = 6.
Remainder: What is left over when one number does not divide exactly into another number. For example,
12 minus 5 = 2 R2
Repeating pattern: A pattern with a core that repeats. The core is the smallest part of a repeating pattern. The repeating number pattern: 1,8, 2,1,8,2,1,8,2,...has a core of 1,8,2.
Rhombus: A figure with 4 equal sides, where 2 pairs of opposite sides are parallel.
Right angle: Two lines that meet in a square corner make a right angle. A right angle measures 90°.
Rotation: Turns a figure around a turn centre. This Is a triangle and its image after a rotation of a 1/4 turn about one vertex:
Same-step growing pattern: A number pattern where the same number is added each time.
Similar figures: Two figures are similar when they have the same shape. Two similar figures do not have to be the same size. These hexagons are similar.
Skeleton: The frame of a solid that shows the edges and vertices of the solid. This is the skeleton of a
Solid: Has length, width, and height. Solids have faces, edges, vertices, and bases. We name some solids by the number and shape of their bases.
Sphere: A solid shaped like a ball.
Square: A figure with 4 equal sides and each angle is a right angle or 90°.
Square centimetre: A unit of area that is a square with 1-cm sides. We write one square centimetre as 1 cm squared.
Square metre: A unit of area that is a square with 1 -m sides. We write one square metre as 1 m squared.
Sum: The result of an addition. The sum of 5 and 2 is 7; or 5 plus 2 = 7.
Survey: Used to collect data. You can survey your classmates by asking them which is their favourite ice cream flavour.
Tenth: A fraction that is one part of a whole when it is divided into ten equal parts. We write one-tenth as one tenth or as 0.1.
Term: One number in a number
pattern. For example, the number 4 is the third term in the pattern
1,2,4,8,16,...
Transformation: A translation (slide), a reflection (flip), and a rotation (turn) are transformations.
Translation: Slides a figure from one location to another. A translation arrow joins matching points on the figure and its image. This figure has been translated 6 squares left and 2 squares up.
Translation arrow: See Translation.
Trapezoid: A figure with 4 sides, where 1 pair of sides is parallel.
Tree diagram: A picture that shows the different ways to arrange objects.
Triangular prism: See Prism.
Triangular pyramid: See Pyramid.
Turn centre: Seel Rotation.
Vertex (plural: vertices): 1. A point where two sides of a figure meet.
2. A point where two or more edges of a solid meet.
Volume: The number of congruent cubes that make up a solid.
Index
Numbers and Symbols
3- d ig it numbers adding, 45,46 subtracting, 55-57 4- d ig it num ber
adding, 48,49
subtracting from, 59,60
A
Abacus, 58
Actual results, 413,414 Adding
3- d ig it numbers, 45,46 4- d ig it numbers, 48,49 using mental m ath, 43,44 A ddition fact, 17,18
Adjacent sides, 90 Angles, 73
measuring, 77-79 AppleWorks
creating patterns w ith, 390-392
exploring pentom inoes w ith, 96-98
transform ations w ith, 255-257 Area, 342,343,345,346,348,349,
351,356
Area pattern, 259,387 Arm o f an angle, 73,79 Array, 128,157
A ttrib u te Blocks, 364,365,377 Axis (axes) o f a graph, 170,179
B
Bar graphs, 170
drawing, 184,185,187-189 Base line o f protractor, 74,79 Base o f pyramid, 99
Base Ten Blocks, 137,151,152,384 adding decimals w ith, 302 fo r subtracting, 55
subtracting decimals w ith, 306 to explore hundredths, 295 to explore tenths, 291 to show w hole numbers, 30
C
Calculator
exploring decimals and fractions w ith, 294,297 num ber patterns on, 14,15
Calendar patterns, 5,26 Capacity, 222,223 Centimetre, 324,325,333 Centuries, 200,201
Changing-step grow ing patterns, 376,377
Circle graph, 174,175 Circle patterns, 268,269 Clustering, 41
Comparing numbers, 37,38 Congruent figures, 70,71,241,
245,247,252 Congruent slices, 78 Coordinates, 237 Core o f a pattern, 10 Corresponding angles, 94 Corresponding sides, 94 Cube, 99,101 D Data, 166 Day, 200,201 Decades, 200,201 Decagon, 249 Decimal point, 292 Decimals, 292
adding, 301,302
com paring and ordering, 298, 299 subtracting, 305,306 Decimetre, 327,328,333 Degree, 78 Denominator, 273 Depth, 321 Designer, 393 Diagonal, 81,82
Differences, estimating, 51 Distance, 331
Dividing, 142,143,145,146,148, 149,151,152,154,155 3-digit num ber by a 1-d ig it
number, 384,385 Division fact, 143,146,149 Division sentence, 148 Division w ith remainders, 148,
149,382,383
E
Edges o f solids, 104,108 Elapsed tim e, 209,210 Equal angles, 86 Equal sides, 82 Equally probable, 405 Equation, 18,21
Equivalent fractions, 283 Estimating differences, 51 Estimating sums, 40,41 Expanded form , 31,46,49 Experiment, 405,411
Faces o f solids, 99-101,104 Factor, 124
Figures
w ith equal areas, 356 w ith equal perimeters, 354 Fractions, 286
o f a set, 277,278 o f a whole, 272,273
ordering and comparing, 288, 289
using benchmarks, 275 Front-end estim ation, 41
G
Gram, 227
Graph, drawing, 177-179,184,185 Graphers, 181-183,187-189 Graphs, 170,171,174,175 Grid, 237
H
Hatch marks, 82,108 Height, 321,328 Hour, 200,201 Hundred chart, 120 Hundredths, 295,309
I
Image, 241,245,252 Improbable, 401 Im proper fraction, 286
K
Key o f a graph, 170,179 Kilogram, 227
Kilometre, 339 Kite, 83,86,90,252
Labels o f a graph, 170,179 Length, 321
Linear dimensions, 321 Lines o f symmetry, 247,248 Litre, 222,223
M
Mass, 226,227 M atching arcs, 86 M elodic ostinato, 16 Mental math
adding decimals w ith, 302 adding w ith, 43,44
subtracting decimals w ith, 306 subtracting w ith, 53,54,57 M eteorologist, 229
Metre, 332,333,339 M illennium , 200,201 M illilitre, 223 M illim etre, 324,333 Minutes, 200,201 Mixed number, 286 Money
adding and subtracting, 308, 309
estim ating and counting, 213, 214
m aking change, 217,218 M onth, 200,201
M ost probable, 405
Multiples, 121,131,132,268,269, 385
M ultiplication
strategies for, 137,138
M ultiplication chart, 120,123,124, 145,367
M ultiplication fact, 123-125,132, 143,146
M ultiplication patterns, 131,132, 367
M ultiplication sentence, 137 M ultiplying, 123-125,127-129
3-digit num ber by a 1-digit number, 369,370 Music pattern, 16
N
Num ber line, 38
Num ber patterns,4 -7,10,11 w ith a calculator, 14,15 Numbers
com paring and ordering, 37, 38
expanded form , 31 rounding, 33,34 standard form , 31 whole, 30,31 w ord form , 31 Numerator, 273
O
Octagon, 259 O pposite angles, 86 O pposite sides, 82
Ordering numbers, 6 ,37,38 Outcomes, 404,405
Parallel lines, 82
Parallelogram, 82,86,90 Pattern rules, 7,11 Patterns, 4 -7
growing, 11,372,373 in m ultiplication, 367 repeating, 10,364,365 shrinking, 11
w ith transform ations, 258,259 Pentominoes, 96-98
Perimeter, 335,336,339,354 Pictographs, 170,177-179,
181-183
Place value
adding decimals w ith , 302 adding w ith , 46,49
subtracting decimals w ith, 306 subtracting w ith, 56,59 Place-value chart, 38
to show w hole numbers, 31 Polygons
area of, 348,349 Position pattern, 6 Predicted results, 413,414 Prediction, 404,410,411 Prism, 99
volum e of, 110
Probability, 400,401,405,408,409 Probable, 401
Problem-solving strategies draw a picture, 330,331,408,
409
guess and check, 22,23 make a table, 192,193 make an organized list, 62,63,
220,221
solve a sim pler problem , 140, 141
use a m odel, 110,111,280,281 use a pattern, 380,381
w ork backward, 262,263 Product, 124,125,135 Proper fraction, 273 Protractor, 74,77,78 Pyramid, 99
Q
Quadrilateral, 81 -83 angles in, 85,86 attributes of, 90
R
Range, 171
Recjangle,82,86,90 area of, 343
Rectangular prism, 99,101,108 Rectangular pyramid, 101,108 Reflection, 244,245,252 Regular figure, 249 Related facts, 146 Remainders, 148,149
Repeating pattern, 10,364,365 Rhombus, 82,86,90
Richter scale, 168 Right angle, 73,78,79 Rotations, 251,252
Rounding numbers, 33,34,41
S
Scale drawing, 336 Scale o f a graph, 171 Short division, 155 Shrinking pattern, 11 Similar figures, 93,94 Skeletons, 107,108 Skip counting, 120,383 Solids,99-101,103,104 Square, 82,86,90 Square centim etre, 346 Square metre, 351 Square prism, 99 Square pyramid, 99
Standard form o f numbers, 31 Standard protractor (see
Protractor) Subtracting
3 -d ig it numbers, 55-57 from 4 -d ig it number, 59,60 using m ental math, 53,54 Subtraction facts, 20
Sums, 40,41 Surveys, 190,191 Symbol
"is greater th a n "38 "is less than" 38 on a graph, 179
Tables, 166,167
Tenths, 273,291,292,309 Terms o f a pattern, 10 Thickness, 321
TI-108 calculator (see Calculator) Time
estim ating, 206,207 telling, 203,204 units of, 200,201 Title o f a graph, 170,179 Train schedule pattern, 9 Transformations, 252,258,259 Translation arrow, 241
Translations, 240,241,252 Trapezoid, 83,89,90 Tree diagram, 409 Trial, 177
Triangular prism, 99,101 Triangular pyramid, 99,101 Turn centre, 251
U
Units o f measure, 333
Venn diagram, 84,89
Vertex (p/ura/Vertices), 73,78,79, 104,108
Volume o f a prism, 110
W
Week, 200,201 Whole numbers, 30,31 W idth, 321
Acknowledgments
The publisher wishes to thank the following sources for photographs, illustrations, and other materials used in this book. Care has been taken to determine and locate ownership of copyright material in this text. We will gladly receive information enabling us to rectify any errors or omissions in credits.
Photography
Cover Mark Hamblin/age fotostock; pp. 2-3 Ray Boudreau; p. 4 (left) Image State/firstlight.ca; p.4. (right) Stone/Frank Siteman; p. 5 (left) Stone/Rick Rusing; p. 5 (right) Taxi/Hans Neleman; pp. 14-15 Ray Boudreau; p. 17 Ray Boudreau; p. 19 Ray Boudreau; p. 20 Ray Boudreau; p. 24 Ray Boudreau; pp. 26-27 Ray Boudreau; p. 28 Tom Bean/Corbis/Magma; p. 30 (top) A. Ramey/PhotoEdit Inc.; p. 30 (bottom) Ray Boudreau; p. 36 Ray Boudreau; p.48 Used by permission of Scott Suko; p. 58 (top) Corel; p. 58 (bottom) Stockbyte; p. 59 Richard Lord/PhotoEdit Inc.; p.62 Ray Boudreau; p. 64 The Image Bank/Cousteau Society; p. 67 Ray Boudreau; pp. 70-71 Ray Boudreau; p. 75 Image State/firstlight.ca; p. 80 Ray Boudreau; p. 85 Ray Boudreau; p. 88 Henry Horenstein/Index Stock Imagery, Inc.; p. 89 Ray Boudreau; p. 93 Ray Boudreau; pp. 98 99 Ray Boudreau; p. 100 Ray Boudreau; p. (top) Corel; p. 103 (centre and bottom) Ray Boudreau; p. 105 (top left and right) Ray Boudreau; p. 105 (centre left) Photodisc Green/C Squared Studios; p. 105 (centre right) Corel; p. 105 (bottom left) Tom Stillo/Index Stock Imagery, Inc.; p. 106 Ray Boudreau; p. 107 (top) Photodisc Green/David Buffington; p. 107 (bottom) Ray Boudreau; p. 110 Ray Boudreau; pp. 116-117 Ray Boudreau; p. 118 Jeff Greenberg/PhotoEdit lnc.;p. 122 Ray Boudreau; p. 126 Michael Newman/PhotoEdit lnc.;p. 127 Ray Boudreau; p. 131 Ray Boudreau; p. 135 Used by permission of
Bombardier; p. 137 Ray Boudreau; p. 139 Ray Boudreau; p. 140 Ray Boudreau; p. 142 Taxi/Jeff Kaufman; p. 148 Corel; p. 151 Ray Boudreau; p. 154 Dave Reede/firstlight.ca; p. 157 Ray Boudreau; p. 161 Rubberball Images; p. 164 Mary Kate Denny/PhotoEdit Inc.; p. 167 Ray Boudreau; p. 169 Corel; p. 172 Reuters NewMedia Inc./Corbis; p. 173 Jeff
Greenberg/PhotoEdit Inc.; p. 175 Corel; pp. 176-177 Ray Boudreau; p. 178 Ray Boudreau; p. 181 Eyewire; p. 191 Ray Boudreau; p. 196 Stone/Kathi Lam; p. 196 (top and bottom left inset) Corel; p. 196 (top and bottom right inset) Corel; p. 197 Kit Houghton/Corbis/Magma; p. 200 (top) Corel; p. 200 (bottom) Ray Boudreau; p. 203 Ray Boudreau; p. 205 Ray Boudreau; p. 206 Ray Boudreau; p. 207 (top left) Digital Vision; p. 207 (top centre) Corel; p.207 (top right) The Image Bank/AJA Productions; pp. 212-213 Ray Boudreau; p. 220 Ray Boudreau; pp. 222-223 Ray Boudreau; p.226 (top left) Robert A.Tyrrell Photography;p.226 (top right) Corel;p.229 (top
right) Dwayne Newton/PhotoEdit Inc.; p. 229 (centre left) Photo Researchers Inc.; p. 229 (centre inner left) Stockbyte; p. 229 (centre inner right) Photo Researchers Inc.; p. 229 (centre right) Runk/Schoenberger/Grant Heilman Photography; p. 229 (bottom) Image Source; p. 235 Chip Henderson/Index Stock Imagery Inc.; p. 237 Miles
Ertman/Masterfile; p. 240 Ray Boudreau; p. 244 Corel; p. 250 Ray Boudreau; p. 251 Ray Boudreau;p. 252 Ray Boudreau; p. 255 David Young-Wolfl/PhotoEdit lnc.;p. 258 Ray Boudreau; pp. 266-267 (left) Tom Bean/Corbis/Magma; pp. 266-267 (centre) Michael Newman/PhotoEdit Inc.; pp. 266-267 (right) Tony Ereeman/PhotoEdit Inc.; pp. 268-269 Ray Boudreau; p. 272 Ray Boudreau; p. 277 Ray Boudreau; p. 280 Ray Boudreau; p. 282 Ray Boudreau; p. 285 Ray Boudreau; p. 287 Myrieen Eerguson Cate/PhotoEdit Inc.; p.288 Ray Boudreau; pp. 290 291; Ray Boudreau; p. 294-295 Ray Boudreau; p. 297 Ray Boudreau; p. 301 The Image Bank/Yellow Dog Productions; p. 304 Ray Boudreau; p. 305 Tony Freeman/PhotoEdit Inc.; p. 320 Ray Boudreau; p.323 Ray Boudreau; p. 324 Ray Boudreau; p. 327 Ray Boudreau; p. 329 (top) Darrell Gulin/Corbis; p. 329 (bottom) Ray Boudreau; p.3 3 0 Tony Ereeman/PhotoEdit Inc.; p. 332 Ray Boudreau; p. 335 Ray Boudreau; p. 339 (bottom) The Image Bank/Etienne Follet; p. 342 Ray Boudreau; p. 345 Ray Boudreau; p. 351 Ray Boudreau; p. 360 (inset) Omni Photo; p. 360 (bottom) Ray Boudreau; p. 361 (bottom left) Rob Melnychuk/Photodisc; p. 361 (bottom centre) Patrick Bennett/Corbis;p. 361 (bottom right) Susan Van Etten/PhotoEdit Inc.; p. 363 (bottom right) Laura Dwight/PhotoEdit Inc.; pp. 362-363 Ray Boudreau; p. 364 Ray Boudreau; p. 369 Ray Boudreau; p.372 Ray Boudreau; pp. 382 383 Ray Boudreau; p. 385 Ray Boudreau; p. 387 Ray Boudreau; p. 388 (top left) Photodisc Green/Hisham F. Ibrahim; p. 388 (top right) Steve Gorton/Dorling Kindersley Media Library; p. 388 (bottom left) Used by permission of Georgia Mills Direct; p. 388 (bottom right) Michelle D. Bridwell/PhotoEdit Inc.; p. 389 Ray Boudreau; p. 390 David Young-Wolff/PhotoEdit Inc.; p. 393 John Burnett; pp. 396-397 Ray Boudreau; p. 402 Corbis; p.403 Ray Boudreau; p.404 Ray Boudreau; p.410 Ray Boudreau; p.413 Ray Boudreau; pp.418-419 Ray Boudreau; p.418 (top inset)Tom Prettyman/PhotoEdit lnc.;p.418 (bottom inset) Taxi/West Rock; p. 419 (right inset) Tom Prettyman/PhotoEdit Inc.; pp.420-421 Ray Boudreau
Illustrations j
Kasia Charko, Leanne Franson, Linda Hendry, Paul McCusker, Grant Miehm, Suzanne Mogensen, Allan Moon,
NSV Productions, Dusan Petricic, Michel Rabagliati, Bill Slavin, Craig Terlson